2001 motor vehicle crashes - New York Metropolitan Transportation ...
2001 motor vehicle crashes - New York Metropolitan Transportation ...
2001 motor vehicle crashes - New York Metropolitan Transportation ...

Create successful ePaper yourself
Turn your PDF publications into a flip-book with our unique Google optimized e-Paper software.
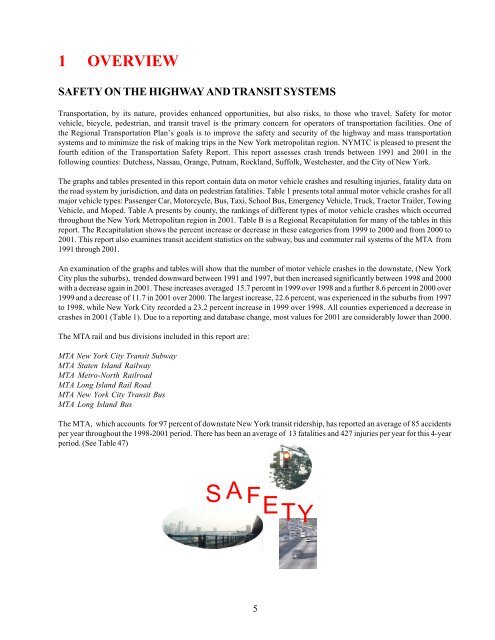
1 OVERVIEW<br />
SAFETY ON THE HIGHWAY AND TRANSIT SYSTEMS<br />
<strong>Transportation</strong>, by its nature, provides enhanced opportunities, but also risks, to those who travel. Safety for <strong>motor</strong><br />
<strong>vehicle</strong>, bicycle, pedestrian, and transit travel is the primary concern for operators of transportation facilities. One of<br />
the Regional <strong>Transportation</strong> Plan’s goals is to improve the safety and security of the highway and mass transportation<br />
systems and to minimize the risk of making trips in the <strong>New</strong> <strong>York</strong> metropolitan region. NYMTC is pleased to present the<br />
fourth edition of the <strong>Transportation</strong> Safety Report. This report assesses crash trends between 1991 and <strong>2001</strong> in the<br />
following counties: Dutchess, Nassau, Orange, Putnam, Rockland, Suffolk, Westchester, and the City of <strong>New</strong> <strong>York</strong>.<br />
The graphs and tables presented in this report contain data on <strong>motor</strong> <strong>vehicle</strong> <strong>crashes</strong> and resulting injuries, fatality data on<br />
the road system by jurisdiction, and data on pedestrian fatalities. Table 1 presents total annual <strong>motor</strong> <strong>vehicle</strong> <strong>crashes</strong> for all<br />
major <strong>vehicle</strong> types: Passenger Car, Motorcycle, Bus, Taxi, School Bus, Emergency Vehicle, Truck, Tractor Trailer, Towing<br />
Vehicle, and Moped. Table A presents by county, the rankings of different types of <strong>motor</strong> <strong>vehicle</strong> <strong>crashes</strong> which occurred<br />
throughout the <strong>New</strong> <strong>York</strong> <strong>Metropolitan</strong> region in <strong>2001</strong>. Table B is a Regional Recapitulation for many of the tables in this<br />
report. The Recapitulation shows the percent increase or decrease in these categories from 1999 to 2000 and from 2000 to<br />
<strong>2001</strong>. This report also examines transit accident statistics on the subway, bus and commuter rail systems of the MTA from<br />
1991 through <strong>2001</strong>.<br />
An examination of the graphs and tables will show that the number of <strong>motor</strong> <strong>vehicle</strong> <strong>crashes</strong> in the downstate, (<strong>New</strong> <strong>York</strong><br />
City plus the suburbs), trended downward between 1991 and 1997, but then increased significantly between 1998 and 2000<br />
with a decrease again in <strong>2001</strong>. These increases averaged 15.7 percent in 1999 over 1998 and a further 8.6 percent in 2000 over<br />
1999 and a decrease of 11.7 in <strong>2001</strong> over 2000. The largest increase, 22.6 percent, was experienced in the suburbs from 1997<br />
to 1998, while <strong>New</strong> <strong>York</strong> City recorded a 23.2 percent increase in 1999 over 1998. All counties experienced a decrease in<br />
<strong>crashes</strong> in <strong>2001</strong> (Table 1). Due to a reporting and database change, most values for <strong>2001</strong> are considerably lower than 2000.<br />
The MTA rail and bus divisions included in this report are:<br />
MTA <strong>New</strong> <strong>York</strong> City Transit Subway<br />
MTA Staten Island Railway<br />
MTA Metro-North Railroad<br />
MTA Long Island Rail Road<br />
MTA <strong>New</strong> <strong>York</strong> City Transit Bus<br />
MTA Long Island Bus<br />
The MTA, which accounts for 97 percent of downstate <strong>New</strong> <strong>York</strong> transit ridership, has reported an average of 85 accidents<br />
per year throughout the 1998-<strong>2001</strong> period. There has been an average of 13 fatalities and 427 injuries per year for this 4-year<br />
period. (See Table 47)<br />
S A<br />
F E<br />
T Y<br />
5