2001 motor vehicle crashes - New York Metropolitan Transportation ...
2001 motor vehicle crashes - New York Metropolitan Transportation ...
2001 motor vehicle crashes - New York Metropolitan Transportation ...

Create successful ePaper yourself
Turn your PDF publications into a flip-book with our unique Google optimized e-Paper software.
58<br />
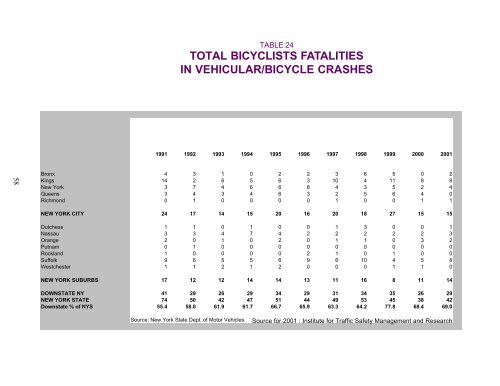
TABLE 24<br />
TOTAL BICYCLISTS FATALITIES<br />
IN VEHICULAR/BICYCLE CRASHES<br />
1991 1992 1993 1994 1995 1996 1997 1998 1999 2000 <strong>2001</strong><br />
Bronx 4 3 1 0 2 2 3 6 5 0 2<br />
Kings 14 2 6 5 6 3 10 4 11 8 8<br />
<strong>New</strong> <strong>York</strong> 3 7 4 6 6 8 4 3 5 2 4<br />
Queens 3 4 3 4 6 3 2 5 6 4 0<br />
Richmond 0 1 0 0 0 0 1 0 0 1 1<br />
NEW YORK CITY 24 17 14 15 20 16 20 18 27 15 15<br />
Dutchess 1 1 0 1 0 0 1 3 0 0 1<br />
Nassau 3 3 4 7 4 2 2 2 2 2 3<br />
Orange 2 0 1 0 2 0 1 1 0 3 2<br />
Putnam 0 1 0 0 0 0 0 0 0 0 0<br />
Rockland 1 0 0 0 0 2 1 0 1 0 0<br />
Suffolk 9 6 5 5 6 9 6 10 4 5 8<br />
Westchester 1 1 2 1 2 0 0 0 1 1 0<br />
NEW YORK SUBURBS 17 12 12 14 14 13 11 16 8 11 14<br />
DOWNSTATE NY 41 29 26 29 34 29 31 34 35 26 29<br />
NEW YORK STATE 74 50 42 47 51 44 49 53 45 38 42<br />
Downstate % of NYS 55.4 58.0 61.9 61.7 66.7 65.9 63.3 64.2 77.8 68.4 69.0<br />
Source: <strong>New</strong> <strong>York</strong> State Dept. of Motor Vehicles<br />
Source for <strong>2001</strong> : Institute for Traffic Safety Management and Research