Airport Liquefaction Susceptibility Analysis Report - ABAG ...
Airport Liquefaction Susceptibility Analysis Report - ABAG ...
Airport Liquefaction Susceptibility Analysis Report - ABAG ...

You also want an ePaper? Increase the reach of your titles
YUMPU automatically turns print PDFs into web optimized ePapers that Google loves.
Fugro Consultants, Inc.<br />
Project No. 04.79221200<br />
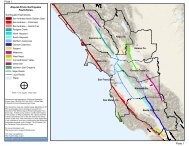
Table 1. Ground Motion Parameters for <strong>Liquefaction</strong> Assessment<br />
Peak Ground Acceleration (PGA) / Moment Magnitude (M)<br />
(PGA 7.5)<br />
<strong>Airport</strong> Location<br />
(V s30) 3 1906 San Hayward-<br />
10% Probability 2% Probability of<br />
Concord-<br />
Francisco Rodgers<br />
of Exceedance in Exceedance in<br />
Green Valley<br />
Earthquake Creek<br />
Scenario 1 Scenario 1 Scenario 1 50-Years<br />
50-Years<br />
Scenario 2 Scenario 2<br />
San Francisco<br />
International<br />
<strong>Airport</strong> (200 m/s)<br />
0.48 / 7.8<br />
(0.53)<br />
0.27 / 7.26<br />
(0.25)<br />
0.15 / 6.71<br />
(0.11)<br />
0.48 / 8.0<br />
(0.57)<br />
0.75 / 8.0<br />
(0.89)<br />
Oakland<br />
International<br />
<strong>Airport</strong> (210 m/s)<br />
0.32 / 7.8<br />
(0.35)<br />
0.35 / 7.26<br />
(0.32)<br />
0.20 / 6.71<br />
(0.15)<br />
0.49 / 6.7<br />
(0.37)<br />
0.73 / 6.7<br />
(0.55)<br />
Buchanan Field<br />
<strong>Airport</strong> (250 m/s)<br />
0.15 / 7.8<br />
(0.17)<br />
0.24 / 7.26<br />
(0.22)<br />
0.53 / 6.71<br />
(0.40)<br />
0.54 / 6.6<br />
(0.39)<br />
0.87 / 6.6<br />
(0.63)<br />
Livermore<br />
Municipal <strong>Airport</strong><br />
(330 m/s)<br />
0.18 / 7.8<br />
(0.20)<br />
0.25 / 7.26<br />
(0.23)<br />
0.17 / 6.71<br />
(0.13)<br />
0.53 / 6.7<br />
(0.40)<br />
0.84 / 6.7<br />
(0.63)<br />
Moffett Federal<br />
Airfield (290 m/s)<br />
0.31 / 7.8<br />
(0.34)<br />
0.32 / 7.26<br />
(0.29)<br />
0.10 / 6.71<br />
(0.07)<br />
0.49 / 6.7<br />
(0.37)<br />
0.75 / 6.7<br />
(0.56)<br />
Notes:<br />
1 Based on the PGA data points provided by USGS<br />
2 Based on USGS deaggregation calculator (2013)<br />
3 Based on USGS V s30 maps (2013)<br />
5.1.2 Groundwater<br />
Depth-to-groundwater (DTW) is an important variable in the assessment of liquefaction<br />
susceptibility since saturated soil conditions are required for liquefaction to occur. Saturation<br />
reduces the effective normal stress of near-surface sediment, increasing the likelihood of<br />
earthquake-induced liquefaction (Youd, 1973). DTW can vary daily, seasonally, and annually,<br />
as well as locally and regionally.<br />
For this assessment, only near-surface groundwater (i.e., groundwater levels at depths less<br />
than 40 feet) was considered and applied. The DTW data was compiled from CPT and borehole<br />
logs, and historical high ground water levels published by the California Geological Survey<br />
(2006 and 2008).<br />
17<br />
May 31, 2013