Airport Liquefaction Susceptibility Analysis Report - ABAG ...
Airport Liquefaction Susceptibility Analysis Report - ABAG ...
Airport Liquefaction Susceptibility Analysis Report - ABAG ...

Create successful ePaper yourself
Turn your PDF publications into a flip-book with our unique Google optimized e-Paper software.
Fugro Consultants, Inc.<br />
Project No. 04.79221200<br />
Preliminary Assessment of Earthquake-Induced<br />
<strong>Liquefaction</strong> <strong>Susceptibility</strong> at Five San Francisco<br />
Bay Area <strong>Airport</strong>s<br />
Prepared for:<br />
Association of Bay Area Governments<br />
c/o: Danielle Hutchings Mieler<br />
P.O. Box 2050<br />
Oakland, California 94604-2050<br />
Prepared by:<br />
Fugro Consultants, Inc.<br />
1777 Botelho Drive, Suite 262<br />
Walnut Creek, CA 94596<br />
May 31, 2013<br />
Oakland airport, 1939<br />
i<br />
May 31, 2013
Fugro Consultants, Inc.<br />
Project No. 04.79221200<br />
EXECUTIVE SUMMARY<br />
The Association of Bay Area Governments (<strong>ABAG</strong>), under a grant issued by the California<br />
Department of Transportation (CalTrans), is revising and updating their 1999 earthquakeinduced<br />
liquefaction susceptibility assessments of San Francisco International <strong>Airport</strong> (SFO)<br />
and Oakland International <strong>Airport</strong> (OAK), as well as performing new assessments at three<br />
smaller general aviation regional airports; Moffett Federal Airfield (Moffett), located in<br />
Sunnyvale; Buchanan Field <strong>Airport</strong> (Buchanan), located in Concord; and Livermore Municipal<br />
<strong>Airport</strong> (Livermore), located in Livermore. These assessments are part of a larger planning<br />
study to evaluate the use of and access to these facilities following a hypothetical largemagnitude<br />
earthquake. Fugro Consultants, Inc. (FCL) is collaborating with <strong>ABAG</strong> to assess the<br />
susceptibility to liquefaction at each of these five airports.<br />
<strong>Liquefaction</strong> is the transformation of a granular material from a solid state into a liquefied state<br />
as a consequence of increased pore pressure and decreased effective stress (Youd, 1973).<br />
Increased pore pressures in unconsolidated sediment, especially in west-central California, are<br />
typically earthquake-induced (co-seismic). <strong>Liquefaction</strong> related ground failure can result in<br />
settlement, foundation (bearing) failure, lateral movement (lateral spread), and general ground<br />
cracking. <strong>Airport</strong> runway surfaces are susceptible to damage and closure following liquefactionrelated<br />
ground failure. In this study, FCL develops earthquake-induced liquefaction hazard<br />
maps following the general liquefaction susceptibility hazard analyses and mapping approach of<br />
the California Geological Survey and based on current and recent research studies performed<br />
by FCL and former William Lettis and Associates (WLA) in California.<br />
Eathquake-induced liquefaction-related ground failures historically have caused extensive<br />
structural and lifeline damage in urbanized areas around the world. Recent examples of these<br />
effects include damage produced during the 1994 Northridge (California), 1995 Kobe (Japan),<br />
1999 Izmit (Turkey), 2001 India earthquakes, and also the 2010-2011 Christchurch earthquake<br />
sequence (New Zealand). Damaging liquefaction occurred in the San Francisco Bay Area<br />
during the 1868 Hayward earthquake, the 1906 San Francisco earthquake, the 1957 Daly City<br />
earthquake, and the 1989 Loma Prieta earthquake (Youd and Hoose, 1978; Holzer, 1998).<br />
Studies of historical earthquakes show that the areal distribution of liquefaction-related damage<br />
is generally restricted to alluviated basins and filled land areas that contain shallow layers of low<br />
density, saturated, granular sediment (e.g. Youd and Hoose, 1978; Holzer, 1998; Tinsley et al.,<br />
1985). In the areas around San Francisco Bay, the geologic materials with a history of<br />
liquefaction include Holocene-aged estuarine deposits, Holocene stream and alluvial fan<br />
deposits, Holocene and Pleistocene eolian deposits, and artificially emplaced fill materials.<br />
Understanding the distribution and extent of these materials is critical to understanding the<br />
potential hazard posed by co-seismically induced liquefaction.<br />
All five of the subject airports are sited on young unconsolidated sediments and artificial fill,<br />
materials considered to have moderate to very high susceptibility to liquefaction (Knudsen et al.,<br />
ii<br />
May 31, 2013
Fugro Consultants, Inc.<br />
Project No. 04.79221200<br />
2000, Witter et al., 2006). The San Francisco and Oakland airports sit on artificial fill placed over<br />
tidal marsh deposits and bay mud. Most of the fill is non-engineered, emplaced before 1970,<br />
and may include loose sandy material highly susceptible to liquefaction. Moffett, Buchannan,<br />
and Livermore airports are built over young alluvial fan sediments, considered to have moderate<br />
susceptibility to liquefaction.<br />
There are numerous faults in the San Francisco Bay Area that are capable of producing largemagnitude<br />
earthquakes and strong ground shaking that can induce liquefaction. Ground<br />
shaking from an earthquake is measured in units of gravitational acceleration (g), and one “g” is<br />
about 9.8 m/sec 2 , or 32 ft/sec 2 . For a given location and earthquake scenario, the strongest<br />
acceleration anticipated to occur is called peak ground acceleration (PGA). Each earthquake<br />
scenario, deterministic or probabilistic, generates a grid of PGA values that spans the area of<br />
influence.<br />
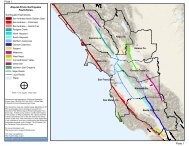
For this study, we consider ground motions from three likely earthquake scenarios<br />
(deterministic), and for two different probability levels (probabilistic) based on the United States<br />
National Seismic Hazard Maps working group (Petersen et al., 2008). Earthquakes on the<br />
following fault segments are considered for the deterministic events: 1) 1906 San Andreas Fault<br />
scenario, 2) Hayward-Rodgers Creek Fault scenario, and 3) Concord-Green Valley Fault<br />
scenario (Figure 1). The two probabilistic ground motions consider the contribution of all the<br />
faults in the Bay Area, and use the compiled probabilities assigned by the Working Group on<br />
California Earthquake Probabilities (WGCEP, 2008). For this study, we considered the 2%<br />
chance of excedance in 50 years scenario, and the 10% chance of exceedance in 50 years<br />
scenario.<br />
Fugro compiled existing borehole and cone penetration test (CPT) data for each airport to<br />
perform quantitative liquefaction potential assessments. A liquefaction analysis using the<br />
Simplified Procedure was performed for San Francisco, Oakland, Moffett, and Buchanan<br />
airports, and yield ranges of settlement values between 0 and 4 inches, 2 and 9 inches, less<br />
than one to 3 inches, and 1 to 4 inches, respectively. A liquefaction analysis was not performed<br />
for Livermore because the available subsurface data did not extend below the historical high<br />
water table. The geologic units found to be most susceptible to liquefaction include coarsegrained<br />
artificial fill, artificial fill over estuarine mud, the Merritt Sand and coarse grained lenses<br />
within the Young Bay Mud, Old Bay Mud, and Holocene alluvial fan deposits.<br />
Given the limitation in data density and extent, we recommend that a liquefaction specific<br />
investigation be conducted for Buchanan and Livermore airports to better characterize the<br />
liquefaction hazard. To address the gaps in subsurface data coverage at Moffett and Oakland,<br />
we recommend additional subsurface studies. A comprehensive investigation to determine the<br />
characteristics of different fill types (type, distribution, and thickness), and the potential for<br />
differential settlement should be performed at Moffett, Oakland, and San Francisco. In addition,<br />
we recommend future evaluations should specifically address perimeter dikes and levees at<br />
iii<br />
May 31, 2013
Fugro Consultants, Inc.<br />
Project No. 04.79221200<br />
San Francisco and Oakland airports to assess the potential for slope instability and seepage<br />
resulting from co-seismic liquefaction.<br />
TABLE OF CONTENTS<br />
Executive Summary .................................................................................................................... ii<br />
1.0 introduction ......................................................................................................................... 1<br />
1.1 Purpose ........................................................................................................................... 2<br />
2.0 Background ......................................................................................................................... 2<br />
2.1 <strong>Liquefaction</strong> during the 1989 Loma Prieta Earthquake .................................................... 3<br />
2.2 Fill Emplacement around San Francisco Bay .................................................................. 3<br />
3.0 Scope and Methodology ...................................................................................................... 4<br />
3.1 Project Scope .................................................................................................................. 4<br />
3.2 Methodology .................................................................................................................... 5<br />
3.2.1 Data Compilation and Review................................................................................... 5<br />
3.2.2 Development of a Geologic Map and Model ............................................................. 5<br />
3.2.3 <strong>Liquefaction</strong> <strong>Susceptibility</strong> <strong>Analysis</strong> .......................................................................... 6<br />
3.2.4 Preparation of Settlement Maps ............................................................................... 7<br />
4.0 Geologic Setting .................................................................................................................. 8<br />
4.1 San Francisco International <strong>Airport</strong> (SFO)....................................................................... 9<br />
4.2 Oakland International <strong>Airport</strong> (OAK) ...............................................................................10<br />
4.3 Buchanan Field <strong>Airport</strong> (CCR)........................................................................................11<br />
4.4 Livermore Municipal <strong>Airport</strong> (LVK)..................................................................................12<br />
4.5 Moffett Federal Airfield (NUQ) ........................................................................................13<br />
5.0 <strong>Liquefaction</strong> Hazard Assessment .......................................................................................14<br />
5.1 Methodology ...................................................................................................................14<br />
5.1.1 Ground Motion Parameters .....................................................................................15<br />
5.1.2 Groundwater ............................................................................................................17<br />
5.1.3 Quality of Available Subsurface Data.......................................................................18<br />
5.2 Results ...........................................................................................................................18<br />
5.2.1 San Francisco International <strong>Airport</strong> ..........................................................................20<br />
5.2.2 Oakland International <strong>Airport</strong> ...................................................................................20<br />
5.2.3 Buchanan Field <strong>Airport</strong> ............................................................................................21<br />
iv<br />
May 31, 2013
Fugro Consultants, Inc.<br />
Project No. 04.79221200<br />
5.2.4 Livermore Municipal <strong>Airport</strong> .....................................................................................21<br />
5.2.5 Moffett Federal Airfield ............................................................................................21<br />
6.0 Conclusions .......................................................................................................................22<br />
6.1 <strong>Liquefaction</strong> Hazards ......................................................................................................23<br />
6.1.1 San Francisco International <strong>Airport</strong> ..........................................................................23<br />
6.1.2 Oakland International <strong>Airport</strong> ...................................................................................24<br />
6.1.3 Buchanan Field <strong>Airport</strong> ............................................................................................25<br />
6.1.4 Livermore Municipal <strong>Airport</strong> .....................................................................................26<br />
6.1.5 Moffett Federal Airfield ............................................................................................26<br />
6.2 Recommendations .........................................................................................................27<br />
6.2.1 <strong>Liquefaction</strong> Investigations ......................................................................................27<br />
6.2.2 Additional Site Studies .............................................................................................27<br />
6.2.3 Mitigation .................................................................................................................27<br />
7.0 References .........................................................................................................................29<br />
LIST OF FIGURES<br />
Figure 1<br />
Figure 2<br />
Figure 3A<br />
Figure 3B<br />
Figure 3C<br />
Figure 3D<br />
<strong>Airport</strong> and Fault Location Map<br />
A and B. Photographs of <strong>Liquefaction</strong> Features at Oakland International<br />
<strong>Airport</strong> Following the October 17, 1989 Loma Prieta Earthquake<br />
Quaternary Geologic Map, San Francisco International <strong>Airport</strong><br />
Historical Bay Environments Map, San Francisco International <strong>Airport</strong><br />
Geologic Cross Section AA-AA’, San Francisco International <strong>Airport</strong>, San<br />
Francisco, California<br />
Historical Aerial Views of San Francisco International <strong>Airport</strong><br />
Figure 3E Approximate Extent of Developed Land in 1943, 1956, 1968, 1973, 1974,<br />
and Circa 1850 Bay Margin, San Francisco International <strong>Airport</strong><br />
Figure 4A<br />
Figure 4B<br />
Figure 4C<br />
Quaternary Geologic Map, Oakland International <strong>Airport</strong><br />
Historical Bay Environments Map, Oakland International <strong>Airport</strong><br />
Geologic Cross Section BB-BB’, Oakland International <strong>Airport</strong>, Oakland,<br />
California<br />
Figure 4D Historical Aerial View of Oakland International <strong>Airport</strong>, 1939<br />
v<br />
May 31, 2013
Fugro Consultants, Inc.<br />
Project No. 04.79221200<br />
Figure 4E Approximate Extent of Developed Land in 1939, 1958, 1959, 1968, 1999,<br />
and Circa 1850 Bay Margin, Oakland International <strong>Airport</strong><br />
Figure 5A<br />
Figure 5B<br />
Figure 5C<br />
Figure 5D<br />
Quaternary Geologic Map, Buchanan Field <strong>Airport</strong><br />
Historical Bay Environments Map, Buchanan Field <strong>Airport</strong><br />
Geologic Cross Section CC-CC’, Buchanan Field <strong>Airport</strong>, Concord,<br />
California<br />
Historical Aerial Photograph, 1939, Buchanan Field<br />
Figure 5E Buchanan – Aerial Photo from NAIP 2009<br />
Figure 6A<br />
Figure 6B<br />
Figure 6C<br />
Quaternary Geologic Map of Livermore Municipal <strong>Airport</strong><br />
Geologic Cross Section DD-DD’, Livermore Municipal <strong>Airport</strong>, Livermore,<br />
California<br />
Historical Aerial Photograph, 1949, Livermore<br />
Figure 6D Livermore – Aerial Photo from NAIP 2009<br />
Figure 7A<br />
Figure 7B<br />
Figure 7C<br />
Figure 7D<br />
Quaternary Geologic Map, Moffett Federal Airfield<br />
Historical Bay Environments Map, Moffett Federal Airfield<br />
Geologic Cross Section EE-EE’, Moffett Federal Airfield, Mountain View,<br />
CA<br />
Historical Aerial Photograph, 1939, Moffett Field<br />
Figure 7E Moffett Field – Aerial Photo from NAIP 2009<br />
Figure 8<br />
Figure 9<br />
Figure 10<br />
Figure 11<br />
Figure 12<br />
Figure 13<br />
Figure 14<br />
Figure 15<br />
Figure 16<br />
<strong>Liquefaction</strong> Settlement Map, San Francisco International <strong>Airport</strong>, San<br />
Francisco, California<br />
<strong>Liquefaction</strong> Settlement Map, Oakland International <strong>Airport</strong>, Oakland,<br />
California<br />
<strong>Liquefaction</strong> Settlement Map, Buchanan Field <strong>Airport</strong>, Concord, California<br />
<strong>Liquefaction</strong> Settlement Map, Moffett Federal Airfield, Mountain View,<br />
California<br />
Preliminary <strong>Liquefaction</strong> Hazard Map, San Francisco International <strong>Airport</strong><br />
Preliminary <strong>Liquefaction</strong> Hazard Map, Oakland International <strong>Airport</strong><br />
Regional <strong>Liquefaction</strong> <strong>Susceptibility</strong>, Buchanan Field <strong>Airport</strong><br />
Regional <strong>Liquefaction</strong> <strong>Susceptibility</strong>, Livermore Municipal <strong>Airport</strong><br />
Regional <strong>Liquefaction</strong> <strong>Susceptibility</strong>, Moffett Federal Airfield<br />
vi<br />
May 31, 2013
Fugro Consultants, Inc.<br />
Project No. 04.79221200<br />
LIST OF TABLES<br />
Table 1 Ground Motion Parameters for <strong>Liquefaction</strong> Assessment<br />
Table 2 Summary of Subsurface Explorations Analyzed for <strong>Liquefaction</strong> <strong>Susceptibility</strong><br />
Table 3 Calculated <strong>Liquefaction</strong> Settlement Summary<br />
LIST OF APPENDICES<br />
Appendix A<br />
Appendix B<br />
Appendix C<br />
Appendix D<br />
<strong>Report</strong>s Reviewed as Part of this Study<br />
Description of Geologic Units<br />
Subsurface Data Used in <strong>Liquefaction</strong> Analyses<br />
<strong>Liquefaction</strong> Analyses<br />
vii<br />
May 31, 2013
Fugro Consultants, Inc.<br />
Project No. 04.79221200<br />
1.0 INTRODUCTION<br />
The Association of Bay Area Governments (<strong>ABAG</strong>), under a grant issued by the California<br />
Department of Transportation (CalTrans), is revising and updating the earthquake-induced<br />
liquefaction susceptibility assessments conducted in 1999 for San Francisco International<br />
<strong>Airport</strong> (San Francisco; SFO) and Oakland International <strong>Airport</strong> (Oakland; OAK) (WLA, 1999),<br />
and is performing new assessments at three smaller General Aviation (GA) airports; Moffett<br />
Federal Airfield (Moffett; NUQ), located in Sunnyvale; Buchanan Field <strong>Airport</strong> (Buchanan; CCR),<br />
located in Concord; and Livermore Municipal <strong>Airport</strong> (Livermore; LVK), located in Livermore<br />
(Figure 1). The Moffett, Buchanan, and Livermore airports have been identified by <strong>ABAG</strong> as<br />
airports that could provide emergency relief or could temporarily accommodate increased air<br />
traffic or serve as a back-up for certain airport functions in the event that the one of the major<br />
commercial airports (SFO, OAK, and SJC) suffer severe damage from an earthquake. The San<br />
Jose International airport is not included in this assessment because a detailed susceptibility<br />
analysis was recently conducted.<br />
Major faults capable of producing large earthquakes that can result in strong ground shaking at<br />
the airports include the San Andreas, Hayward-Rogers Creek, and Concord-Green Valley faults.<br />
Other faults associated with the San Andreas fault system may also have the potential to<br />
generate large earthquakes (Figure 1). For this study we use earthquake scenarios considered<br />
‘likely’ by the 2007 Working Group on California Earthquake Probabilities (WGCEP, 2008) for<br />
the San Andreas, Hayward-Rogers Creek, and Concord-Green Valley faults. Earthquakes on<br />
these three faults would expose the airports to long-duration ground motions with peak ground<br />
accelerations in excess of 0.2 g (20 percent of the acceleration due to gravity). The distance<br />
between an earthquake epicenter and the farthest effects of liquefaction is directly related to the<br />
magnitude of the event (Tinsley et al., 1985), the presence of susceptible geologic and shallow<br />
hydrologic conditions, and the amplification of ground motion at lower frequencies. In addition,<br />
empirical correlations between ground shaking intensity and geology show that the distribution<br />
of amplified ground shaking is correlated with geologic conditions, and is most severe in<br />
alluviated basins that contain thick deposits of unconsolidated sediments.<br />
Previous damaging liquefaction occurred in the San Francisco Bay Area during the 1868<br />
Hayward earthquake, the 1906 San Francisco earthquake, the 1957 Daly City earthquake, the<br />
1983 Coalinga earthquake, and the 1989 Loma Prieta earthquake. Studies of the distribution of<br />
liquefaction features from these and other historical earthquakes demonstrate that liquefactionrelated<br />
damage is generally restricted to alluviated basins that contain shallow layers of lowdensity,<br />
saturated, granular sediment (i.e., sand) (Youd and Hoose, 1978; Tinsley et al., 1985,<br />
Holzer, 1998; Cetin et al., 2004a; Cubrinovski et al., 2011).<br />
1<br />
May 31, 2013
Fugro Consultants, Inc.<br />
Project No. 04.79221200<br />
1.1 Purpose<br />
The purpose of this study is to evaluate the susceptibility to liquefaction at five San Francisco<br />
Bay area airports. The findings of this study provide input to <strong>ABAG</strong>’s <strong>Airport</strong> and Infrastructure<br />
Resilience Project which evaluates the role of airports in regional disaster response and<br />
recovery. In this study we evaluate earthquake-induced liquefaction susceptibility at San<br />
Francisco and Oakland airports and conduct preliminary assessments at Buchanan, Moffett and<br />
Livermore airports. Examination of liquefaction susceptibility in the vicinity of these airports is<br />
important because they are developed on land underlain by saturated Holocene deposits and<br />
artificial fill. In the San Francisco Bay area, these types of geologic deposits are historically<br />
associated with earthquake-induced liquefaction ground failure (Youd and Hoose, 1978; Holzer,<br />
1999). Delineating the extent of liquefaction-susceptible deposits and estimating the magnitude<br />
of deformation along runways provides awareness of damage-potential and helps start the<br />
conversation for mitigation and planning for the eventualities of the next large earthquake.<br />
2.0 BACKGROUND<br />
Earthquake-induced liquefaction has historically caused loss of life and damage to property and<br />
infrastructure. Observations show that the distribution of liquefaction phenomena is not random;<br />
liquefaction is typically restricted to areas underlain by saturated, loose, cohesionless sand, and<br />
silt. Areas susceptible to liquefaction can be delineated on the basis of geologic, geomorphic,<br />
geotechnical and hydrologic mapping, and purposed subsurface analyses (e.g., Youd and<br />
Perkins, 1987; Tinsley and Holzer, 1990; Witter et al., 2006). Based on a comparison of<br />
historical occurrences of liquefaction in the San Francisco Bay Area to geologic and geomorphic<br />
mapping, Knudsen and others (2000) found that Holocene estuarine deposits, Holocene stream<br />
and alluvial fan deposits, Holocene and Pleistocene eolian deposits, and artificial fill are the<br />
geologic materials most susceptible to liquefaction.<br />
<strong>Liquefaction</strong> is the transformation of a granular material from a solid state into a liquefied state<br />
as a consequence of increased pore pressure and decreased effective stress (Youd, 1973).<br />
Increased pore pressures in unconsolidated sediment, especially in west-central California, are<br />
most typically seismically induced (co-seismic). Observed types of ground failure resulting from<br />
liquefaction can include sand boils, lateral spreads, ground settlement, ground cracking, and<br />
ground warping (Youd and Hoose, 1978).<br />
Earthquake-induced liquefaction is of special concern in the San Francisco Bay Area.<br />
Mountains on either side have shed thick alluvial sediments that mantle the bay and form a<br />
gently sloping apron on which the bay cities are founded. The toe of the alluvial apron grades<br />
into estuarine deposits lining the margins of the bay. Many of these alluvial and estuarine<br />
deposits are young, unconsolidated, granular, saturated, and thus, susceptible to liquefaction.<br />
2<br />
May 31, 2013
Fugro Consultants, Inc.<br />
Project No. 04.79221200<br />
Another characteristic of the bay margin areas is the presence of artificial fill. Fill has a long<br />
history in and around San Francisco Bay; fill placement has been ongoing for more than a<br />
hundred years, and much of the emplaced fill is susceptible to liquefaction. All five of the<br />
airports studied are founded on Holocene alluvium, estuarine deposits, or on fill overlying these<br />
Holocene deposits, and liquefaction is a hazard that needs to be evaluated when assessing the<br />
integrity of the infrastructure at these important facilities.<br />
2.1 <strong>Liquefaction</strong> during the 1989 Loma Prieta Earthquake<br />
During the 1989 Loma Prieta earthquake, soil liquefaction at Oakland International <strong>Airport</strong><br />
caused considerable damage to the 3,000 meter-long main jet runway, located along the<br />
southwest edge of the airport. This runway was built entirely on fill in the early 1960s. Sand<br />
boils, settlement, and lateral spreads were documented within wide areas of airport fill to the<br />
north, south, and east of the damaged runway section (Holzer, 1998; Figures 2A and 2B).<br />
Extensive soil liquefaction was documented within the western section of the airport fill, where<br />
sand boils and cracks were observed and approximately the northwestern 900 meters of the<br />
runway was damaged (Figure 2A). In addition, the adjacent taxiway pavement sustained heavy<br />
damage, with cracks as wide as 30 centimeters and vertical displacement up to 15 centimeters<br />
(Figure 2B, photo A). The perimeter dikes at the west end of the runway experienced settlement<br />
and lateral spreading of approximately 0.5 to 0.7 meters (Holzer, 1998).<br />
<strong>Liquefaction</strong> damage was also documented in other locations on the airport property. Sand boils<br />
and large fissures caused by lateral spreading damaged an undeveloped area of fill to the north<br />
and northeast of the main runway. <strong>Liquefaction</strong> and settlements of as much as 8 cm were<br />
observed in several locations near the main terminal buildings, which are supported on deeper<br />
foundations and were not significantly damaged. In addition, a below-ground tramway, which<br />
allows service vehicles carrying passengers' luggage to pass under part of one of the main<br />
terminal buildings, was filled with sand and water released from the subsurface (Figure 2B,<br />
photo B) (Holzer, 1998).<br />
2.2 Fill Emplacement around San Francisco Bay<br />
The historical placement of fill into and on the margins of San Francisco Bay began in the 1850s<br />
and accelerated through the mid-1900s as urbanization encroached on the Bay (Hitchcock et<br />
al., 2008). By 1970, the rapid filling of the Bay and its tidal marshes had virtually halted after the<br />
1969 implementation of the San Francisco Bay Plan (SFBCDC, 1969), which included<br />
restrictions on Bay margin development and requirements that fill be engineered.<br />
Four of the five airports evaluated in this report were partly or wholly constructed prior to 1965<br />
on fill over estuarine deposits of the tidal marsh, tidal flats, or bay mud. Fill materials and<br />
emplacement methods evolved over the decades, resulting in a mosaic of fill types present<br />
within the Bay area today. Emplacement methods included 1) scooping of tidal marsh<br />
3<br />
May 31, 2013
Fugro Consultants, Inc.<br />
Project No. 04.79221200<br />
sediments and piling the material to make dikes, 2) hydraulic pumping of sand and silt from the<br />
bay, 3) the dumping of waste debris, rubble, quarry rock or soil, and, in later years, 4)<br />
construction using engineered compacted fill (Hitchcock et al., 2008). Studies by Knudsen and<br />
others (2000) show that about 50 percent of historical occurrences of liquefaction in the San<br />
Francisco Bay area occurred in artificial fill placed over estuarine deposits (Bay Mud). Areas of<br />
the greatest settlement and number of sand boils strongly correlate with hydraulically emplaced<br />
sand fills; likely emplaced in the 1930s and 1940s.<br />
3.0 SCOPE AND METHODOLOGY<br />
This assessment was performed to support <strong>ABAG</strong> in its performance of an earthquake-induced<br />
liquefaction susceptibility assessment of five major and regional San Francisco Bay Area<br />
airports under a grant issued by CalTrans. This work was authorized by <strong>ABAG</strong> on December<br />
12, 2011.<br />
3.1 Project Scope<br />
Subsequent to the 1999 <strong>ABAG</strong> liquefaction susceptibility assessment for San Francisco and<br />
Oakland International airports (WLA, 1999), additional subsurface data were collected as part of<br />
airport expansion project studies. Using these recently collected data in combination with<br />
existing data and the updated ground motion data of Petersen and others (2008) , Wald and<br />
others (2005), and the USGS (2013c), the liquefaction susceptibility of materials underlying<br />
these airports were re-evaluated and the liquefaction susceptibility and settlement maps were<br />
updated. New liquefaction susceptibility assessments were performed for Moffett, Buchanan,<br />
and Livermore airports, which were identified by <strong>ABAG</strong> as General Aviation (GA) airports that<br />
could provide emergency relief, could temporarily accommodate increased air traffic, or could<br />
serve as a back up for certain airport functions in the event that the major commercial airports<br />
suffer severe damage from an earthquake.<br />
For each of the five airports, existing geotechnical, geologic, geomorphic, and groundwater data<br />
were obtained from airport authorities, <strong>ABAG</strong>, or public sources. The data were compiled for<br />
each site, and used to develop geologic maps and cross-sections. Following compilation of<br />
subsurface data, a quantitative analysis was performed for San Francisco, Oakland, Moffett,<br />
and Buchanan airports to determine the liquefaction potential of each geologic unit. The<br />
quantitative analysis was not performed for the Livermore airport due to insufficient data (please<br />
refer to Section 5.0 for more information). The liquefaction analysis for Moffett and Buchanan<br />
was originally slated to be performed by <strong>ABAG</strong>, however these analyses were performed by<br />
FCL. The results of the analyses and geologic maps were integrated to generate liquefaction<br />
susceptibility maps and potential settlement maps.<br />
4<br />
May 31, 2013
Fugro Consultants, Inc.<br />
Project No. 04.79221200<br />
3.2 Methodology<br />
Our assessment follows the general liquefaction susceptibility hazard analyses and mapping<br />
approach of the California Geological Survey, and also relies on state of practice techniques<br />
including recent research studies performed and developed by FCL and former WLA in<br />
California. In general, our characterization of liquefaction susceptibility involves four main tasks:<br />
• Data compilation and review<br />
• Development of a geologic map and model<br />
• <strong>Liquefaction</strong> susceptibility analysis<br />
• Preparation of settlement maps<br />
3.2.1 Data Compilation and Review<br />
To characterize the geologic and geomorphic environments of the airports, a compilation of<br />
available near-surface geologic, historical, and geotechnical data from published and<br />
unpublished sources was created. Published maps of Quaternary geology and geomorphology<br />
include liquefaction maps from Witter and others (2006), liquefaction-potential maps from<br />
previous <strong>ABAG</strong> collaborative efforts (WLA, 1999; <strong>ABAG</strong>, 2001), and maps developed by the<br />
San Francisco Estuary Institute (SFEI) of the San Francisco Bay environment (1998). In<br />
addition, geotechnical, environmental, and engineering geologic reports were provided by<br />
<strong>ABAG</strong> or airport authorities, obtained from archived previous FCL investigations, or reviewed<br />
from public sources. A full list of reviewed reports can be found in Appendix A.<br />
3.2.2 Development of a Geologic Map and Model<br />
Geologic units were delineated and described using subsurface data, the results from previous<br />
studies, existing Quaternary geologic mapping, mapping by SFEI, and our understanding of the<br />
late Quaternary evolution of San Francisco Bay region. The subsurface data were also used to<br />
delineate and characterize subunits within the artificial fill at Livermore and Buchanan.<br />
Descriptions and engineering properties of subsurface materials were extracted from available<br />
geotechnical, environmental, and engineering geologic reports and then reconciled with surficial<br />
geologic units and integrated to formulate a geologic model for each airport site. A more<br />
detailed discussion of geologic units identified at each airport is included in Appendix B, and a<br />
complete list reports and subsurface data sources can be found in Appendix C.<br />
The subsurface data for each airport includes borehole and CPT data acquired from several<br />
sources. A total of 245 borehole and CPT exploration points were evaluated: 62 points for<br />
Buchanan; 8 for Livermore; 14 for Moffett; 48 for Oakland; and 113 for San Francisco. A<br />
complete list of boring and CPT exploration points is included in Appendix C.<br />
5<br />
May 31, 2013
Fugro Consultants, Inc.<br />
Project No. 04.79221200<br />
3.2.3 <strong>Liquefaction</strong> <strong>Susceptibility</strong> <strong>Analysis</strong><br />
Geologic deposits were evaluated for susceptibility to liquefaction based on historical<br />
occurrence of liquefaction, geologic and geomorphic indicators, and based on the results of the<br />
quantitative Simplified Procedure liquefaction analysis. Near-surface groundwater data was<br />
compiled from CPT and borehole logs and published historical high ground water levels (CGS,<br />
2006 and 2008).<br />
These data were analyzed using three deterministic (1906 San Francisco earthquake scenario,<br />
Hayward-Rogers Creek fault earthquake scenario, Concord-Green Valley fault earthquake<br />
scenario) and two probabilistic scenarios (10% Probability of exceedance in 50-Years scenario,<br />
2% Probability of exceedance in 50-Years scenario). For a more detailed discussion of the<br />
approach and methodology applied to the liquefaction analyses, please refer to Section 5.0 and<br />
Appendix D.<br />
Geologic and Geomorphic Indicators of <strong>Liquefaction</strong> <strong>Susceptibility</strong><br />
Previous studies of liquefaction hazards within the San Francisco Bay region identify several<br />
geologic and hydrologic factors that influence the susceptibility of a deposit to liquefaction (e.g.<br />
Knudsen et al., 1997a, 1997b; Sowers et al., 1998; Knudsen et al., 2000, Witter et al., 2006).<br />
These factors include the age and depositional environment of the deposit; the relative<br />
consolidation of sands and silts; and the local depth to groundwater (Youd et al., 1973; Youd et<br />
al., 1975; Youd and Perkins, 1978; Tinsley et al., 1985). As a deposit ages, soil formation,<br />
weathering, diagenetic processes, and earthquake shaking lead to consolidation and<br />
cementation, resulting in a reduced susceptibility to liquefaction (e.g. Witter et al., 2006; Leon et<br />
al. 2006; Hayati et al., 2008). For this study, we evaluated the most recent regional-scale<br />
liquefaction evaluation performed for the San Francisco Bay region (Witter at al., 2006). At<br />
Moffett, Livermore, and Buchanan, we also compared mapped surficial deposits with subsurface<br />
data to assess the potential for liquefaction.<br />
Simplified Procedure<br />
The Simplified Procedure is an analysis method developed to estimate a geologic unit’s<br />
resistance to liquefaction based on observations and empirical case histories. The analysis<br />
relates the soil’s capacity to resist liquefaction (cyclic resistance ratio or CRR), to the seismic<br />
demand on a soil (cyclic stress ratio or CSR) as a factor of safety. The CSR is determined<br />
based on the tectonic setting and empirical physical conditions, while the CRR is determined by<br />
individual soil sample characteristics as determined from laboratory testing or in-situ testing.<br />
The factor of safety against liquefaction is calculated as a ratio of CRR and CSR (a more<br />
detailed discussion of the Simplified Procedure is included in section 5.0).<br />
Since CRR is determined based on the characteristics of a soil, a number of tests are employed<br />
to measure the properties of soils, including: the Standard Penetration Test (SPT), and Cone<br />
Penetration Test (CPT). The SPT is an in-situ test typically performed in conjunction with a<br />
borehole exploration program. Boreholes can be advanced using a variety of techniques, but<br />
6<br />
May 31, 2013
Fugro Consultants, Inc.<br />
Project No. 04.79221200<br />
generally advance samplers that extract materials for visual inspection and laboratory testing.<br />
One type of samples is the SPT and it is designed to measure of the resistance of soil under a<br />
set of controlled conditions; a soil sampler of a known diameter is driven into the ground using a<br />
140 pound hammer that is dropped from a known height. The number of blows required to<br />
advance the sampler a total of 12 inches into the ground is recorded and is known as the<br />
standard penetration resistance, or the N-value. High N-values correspond to high consistency<br />
(fine grained) or high density (coarse grained) soils, while low N-values correspond to low<br />
consistency, or low density soils. The CPT is another in-situ test that measures a soil’s<br />
response to an instrumented cone that is pushed into the subsurface. The test measures the<br />
friction and penetration resistance as the cone is advanced into the soil at a controlled rate. One<br />
advantage of the CPT method is that a continuous measure of the soil column is possible<br />
(conversely, SPT’s have spacing in-between test intervals – typically 2.5 to 5 feet). Other types<br />
of tests can be used to estimate liquefaction susceptibility and include: shear wave velocity (e.g.<br />
Andrus and Stokoe, 1999, Andrus, 2000; Andrus et al., 2004), or dynamic laboratory testing of<br />
undisturbed soil samples. These alternative testing techniques area comparably expensive; as<br />
a result, the SPT and CPT techniques are the predominant testing method employed when<br />
collecting data for liquefaction susceptibility hazard analyses.<br />
Because the Simplified Procedure has been extensively used and studied, the method has<br />
benefited from revisions and refinements that have improved the level of overall analysis (e.g.<br />
Seed et al., 1982, 1983, 1985; Robertson and Wride, 1997; Youd et al., 2001; Idriss and<br />
Boulanger, 2004, Cetin et al., 2004b). For this study, the 2001 NCEER recommendations for<br />
employing the Simplified Procedure are used to analyze liquefaction potential at San Francisco,<br />
Oakland, Moffett, and Buchanan airports.<br />
3.2.4 Preparation of Settlement Maps<br />
In addition to calculating factor of safety against liquefaction, our assessment also includes<br />
evaluation of liquefaction-induced reconsolidation settlements. <strong>Liquefaction</strong> induced<br />
settlements were calculated using the recommendations of Ishihara and Yoshimine (1992).<br />
Settlement maps were developed for San Francisco, Oakland, Moffett, and Buchanan airports.<br />
It should be noted that many of the borings at each airport are relatively shallow, with depths of<br />
penetration as low as 5 to 10 feet below ground surface. Because liquefaction induced<br />
settlements can occur at depths up to 50 or 80 feet, we only calculate estimates of settlement<br />
for borings that exceed 30 feet penetration. The shallower borings are omitted because the<br />
analytical results could be misinterpreted and promote underestimation of the settlement<br />
hazard. A discussion of these results is included in Section 5.0.<br />
7<br />
May 31, 2013
Fugro Consultants, Inc.<br />
Project No. 04.79221200<br />
4.0 GEOLOGIC SETTING<br />
The San Francisco Bay region is located within the Coast Range geomorphic province. The<br />
Coast Ranges are structurally controlled north- to northwest-trending mountain ranges that rise<br />
2,000 to 4,000 feet above sea level (with peaks up to 6,000 feet), and have intervening valleys<br />
that trend subparallel to the San Andreas fault system (Figure 1). The northeastern and<br />
southwestern ranges, composed primarily of Mesozoic and Cenozoic sedimentary strata, are<br />
separated by a structural depression containing the San Francisco Bay (California Geological<br />
Survey, 2002). San Francisco Bay is a northwest-trending basin within the Bay Block, a terrane<br />
bounded on the west by the San Andreas fault and on the east by the Hayward and Calaveras<br />
fault systems (Figure 1). The Bay Block is underlain by late Mesozoic rocks of the Franciscan<br />
Complex.<br />
San Francisco Bay is filled with as much as 600 feet of Quaternary sedimentary deposits; the<br />
sediments are shed from the surrounding hills, transported by the Sacramento River, and have<br />
accumulated in the bedrock basin that is San Francisco Bay (Lajoie and Helley, 1975; Helley<br />
and Lajoie, 1979; Witter et al., 2006; Rogers and Figuers, 1991). During the last glacial period,<br />
when sea level was significantly lower (about 425 feet below current sea level), fluvial and<br />
eolian sediment covered valleys that occupied the San Francisco basin. These non-marine<br />
deposits experienced a sustained period of sub-aerial exposure, weathering, and consolidation<br />
(Helley and Lajoie, 1979). Subsequent melting and retreat of glacial ice at the end of the<br />
Pleistocene caused global sea level to rise and invade the valleys now occupied by the San<br />
Francisco Bay (Helley and Lajoie, 1979), and Atwater and others (1977) suggest that the water<br />
re-entered the Golden Gate around 10,000 years ago reached near-current water levels<br />
approximately 5,000 years ago. Above the non-marine Pleistocene sediment are accumulations<br />
of poorly consolidated Holocene deposits. Sea level fluctuations at the end of the Pleistocene<br />
and beginning of the Holocene, are caused the interfingering of marine and terrestrial sediment<br />
facies at the San Francisco Bay margins (WLA, 1999). By comparing the historical occurrence<br />
of liquefaction in the San Francisco Bay area to geologic and geomorphic mapping, Knudsen<br />
and others (2000) found that Holocene estuarine deposits, Holocene stream and alluvial fan<br />
deposits, Holocene and Pleistocene eolian deposits, and artificial fill are the geologic materials<br />
most susceptible to liquefaction.<br />
The geologic deposits underlying each of the five airports are shown on Quaternary geologic<br />
maps developed by Witter and others (2006), and by Rogers and Figuers (1991) (Figures 3A,<br />
4A, 5A, 6A, 7A). These maps emphasize the areal extent of the Quaternary aged surficial<br />
deposits within the San Francisco Bay region.<br />
Development along the bay margins began in the mid-1800s and accelerated during the<br />
population boom following World War II. Lowlands including tidal marshes, tidal flats, and<br />
shallow portions of the bay were developed by the placement of artificial fill. Most of this fill was<br />
8<br />
May 31, 2013
Fugro Consultants, Inc.<br />
Project No. 04.79221200<br />
placed directly on young Bay mud and Holocene fluvial deposits around the bay margins. A<br />
variety of techniques were used to place and compact the fills, including emplacement of fill via<br />
large-scale hydraulic pumping (pumping or sluicing of water sand and silt slurry, typically<br />
dredged from the bay). Sandy and silty hydraulic fills along the bay margins are particularly<br />
susceptible to liquefaction. Much of the hydraulic fill was placed prior to 1965, before the effects<br />
of strong ground motions on non-engineered fill were well understood. Since 1969, engineering<br />
design and review of proposed Bay fills has been required (Hitchcock and others, 2008).<br />
In the following sections, we describe the geologic setting and present a geologic model for<br />
each site based on subsurface information, regional geologic and geomorphic maps, historical<br />
aerial photography, and maps of fill placement through time. The geologic units found at each<br />
airport are described in detail in Appendix A.<br />
4.1 San Francisco International <strong>Airport</strong> (SFO)<br />
San Francisco International <strong>Airport</strong> is located on the west shore of the San Francisco Bay in<br />
northern San Mateo County. The airport is built entirely on artificial fill overlying estuarine<br />
deposits (Figure 3A). Maps of the historical extent of bay environments based on 1800s US<br />
Coast Survey mapping, show that the airport property encompasses former tidal marsh, tidal<br />
flat, shell flat, and shallow bay environments (Figure 3B; SFEI, 2000). The estuarine deposits<br />
are collectively referred to as Bay Mud on Figure 3A and Young Bay Mud (YBM) on Figure 3C.<br />
Borehole and CPT data show that the stratigraphy underlying San Francisco International<br />
<strong>Airport</strong> generally consists of artificial fill, underlain Young Bay Mud (YBM) alluvium, Old Bay<br />
Mud (OBM), and Pleistocene alluvium (Figure 3C). These sediments are underlain at depth by<br />
Franciscan Complex bedrock.<br />
Development of the SFO property began with the construction of a perimeter levee around the<br />
tidal marsh lands in 1880 (Figure 3D, photo A). The construction of the first airfield in 1927<br />
involved the import and placement of fill inboard of the levee (URS, 2006). By 1938 the fill had<br />
extended beyond the original perimeter to add new runways (Figure 3D, photo B). Later<br />
expansions of the airport involved subsequent episodes of fill placement on at least ten different<br />
occasions (URS, 2006). WLA (1999) identified three distinct units (Fills A, B, and C) at SFO:<br />
• Fill A: lean clay with fine gravel and fine to medium sand<br />
• Fill B: loose to medium dense, poorly graded sand with minor clay and silt<br />
• Fill C: brown to gray to black, granular, poorly graded gravel with rounded to subangular<br />
fine to coarse gravel and minor clay and sand<br />
The borehole data reviewed by WLA (1999) indicate that artificial fill at the airport ranges from 5<br />
to 25 feet in thickness, with an average thickness throughout most of the site of 10 to 15 feet.<br />
The thickest sections of fill are located along the northern, eastern, and southern margins of the<br />
airport (WLA, 1999; URS, 2006; Figure 3C).<br />
9<br />
May 31, 2013
Fugro Consultants, Inc.<br />
Project No. 04.79221200<br />
Young Bay Mud underlies the artificial fill and consists of unconsolidated clay to silty clay with a<br />
few lenses of well sorted sand shelly layers and peat (WLA, 1999). The thickness of the YBM<br />
ranges from 20 to 70 feet across the airfield and varies abruptly over short distances, reflecting<br />
the ground surface topography prior to deposition of the Bay Mud (URS, 2006). The YBM is<br />
formed in marshlands and tidal mud flats of the San Francisco Bay and interfingers landward<br />
with distal alluvial fan deposits shed eastward from the hills west of SFO (WLA, 1999).<br />
The YMB unconformably overlies OBM and Late Pleistocene alluvium. OBM deposits consist of<br />
sandy clay to clayey sand with some sandy and shelly horizons that represent an ancestral bay<br />
that occupied today’s San Francisco Bay about 110,000 years ago. OBM interfingers with late<br />
Pleistocene alluvial material that originated in the hills located west of SFO and consists of<br />
moderately dense clay, silt, and sand with minor gravel. These deposits were laid down during a<br />
sea level lowstand when streams flowed farther out onto the Bay plain before meeting the Bay<br />
along the paleo-Bay margin. The Old Bay Mud and alluvial material range in thickness from 50<br />
to 160 feet near the airport terminal (WLA, 1999).<br />
4.2 Oakland International <strong>Airport</strong> (OAK)<br />
Oakland International <strong>Airport</strong> is located on the eastern shore of the San Francisco Bay in<br />
western Alameda County. Similar to the San Francisco airport, it is built entirely on fill over<br />
estuarine deposits (Figure 4A). Maps of the historical extent of bay environments based on<br />
1800s US Coast Survey mapping, show that the airport property encompasses former tidal<br />
marsh, tidal flat, and shallow bay environments (Figure 4B; SFEI, 2000). The major geologic<br />
units underlying the fill include Holocene estuarine deposits, and Holocene and Pleistocene<br />
alluvial deposits, and the late Pleistocene to early Holocene Merritt Sand (Lajoie and Helley,<br />
1975; Helley and Lajoie, 1979, Witter et al., 2006;Figure 4A and 4C). The Holocene estuarine<br />
deposits are collectively referred to as Bay Mud (Qhbm) on Figure 4A, and Young Bay Mud<br />
(YBM) on Figure 4C.<br />
The northeastern half of the airport property is located on former tidal marsh where deltaic and<br />
stream channel deposits of San Leandro Creek interfinger with the fine-grained marsh deposits.<br />
The historical (1850s) San Leandro Creek channel is shown on Figure 4B, the 1939 channel in<br />
Figure 4D, and its present-day engineered course in Figure 4A. The northeastern half of the<br />
airport, now known as North Field, comprised the original Oakland airport built in 1927 (Port of<br />
Oakland, 2013). The USDA aerial photograph taken in 1939 (Figure 4D) shows meandering<br />
tidal marsh sloughs in-between the runways.<br />
The southwestern half of the property is built on fill over tidal flats and shallow bay. Its terminal<br />
and south runway opened in 1962 (Port of Oakland, 2013). The southwestern shoreline is<br />
bordered by a perimeter dike that encompasses fill emplaced in the 1950s and 1960s (URS,<br />
2011). The dike was constructed in three phases. The south and southwest perimeter was the<br />
first phase of construction in the late 1950s and fill materials consist of dredged Bay Mud (the<br />
“clay dike”; URS, 2011). The second and third phases of construction took place in the 1960s<br />
10<br />
May 31, 2013
Fugro Consultants, Inc.<br />
Project No. 04.79221200<br />
and 1970s and extended the dike to the northwest using hydraulically-placed dredged sand and<br />
gravel (the “sand and gravel dike”; URS, 2011). WLA (1999) identified at least four different<br />
episodes of fill placement and three distinct fill units:<br />
• Fill A: cohesive fill<br />
• Fill B: loose to medium dense granular fills typically derived from dredged Merritt Sand<br />
(identified as the primary liquefiable zone)<br />
• Fill C: dense to very dense granular fills<br />
The thickness of fill varies across the site inboard of the dike from roughly 8.5 to 13.5 feet in the<br />
south to between 1 and 7 feet in the north (AGS, 2008). The fill material generally consists of<br />
loose to dense sand, silty sand, medium stiff to stiff silt and clay, with variable amounts of<br />
gravel. The thickness of the clay dike fill, composed of shelly Bay Mud, ranges between 10 and<br />
20 feet. The thickness of the sand and gravel dike fill, composed of loose to medium dense<br />
sand and gravel, ranges between 15 and 30 feet. The fill bodies typically thicken to the west<br />
(WLA, 1999; URS, 2011).<br />
The dike and artificial fill are underlain by YBM, which consists of soft, sandy clay to silty clay<br />
with thin peat layers locally present. The thickness of YBM ranges from 0 to 25 feet (WLA,<br />
1999). The YBM rests unconformably on late Pleistocene to early Holocene Merritt Sand and<br />
OBM. The Merritt Sand consists of well sorted eolian sand that interfingers landward with<br />
Pleistocene alluvial fan deposits that consist of silty and sandy clay with gravely lenses. The<br />
Merritt Sand and Pleistocene alluvial fan deposits unconformably overlie OBM (Yerba Buena<br />
mud), which consists of gray marine mud (low to high plasticity clay) with some sandy and<br />
shelly horizons (WLA, 1999).<br />
4.3 Buchanan Field <strong>Airport</strong> (CCR)<br />
Buchanan Field <strong>Airport</strong> is located near the margin of Suisun Bay and the mouth of Walnut Creek<br />
in northern Contra Costa County. The airport is built on a layer of artificial fill placed over alluvial<br />
fan and estuarine sediments. The airport property is located on the distal portion of the<br />
interfingering alluvial fans of Walnut Creek and Grayson Creek where they grade into the<br />
estuarine environment of the San Francisco Bay margin. The major geologic units in the area<br />
include Holocene and Pleistocene alluvial deposits, and Holocene estuarine deposits (Figure<br />
5A; Lajoie and Helley, 1975; Helley and Lajoie, 1979, Witter et al., 2006). Maps of the historical<br />
ecology of the area show that the airport property encompasses former estuarine, moist<br />
grassland, and willow grove habitats (Figure 5B; SFEI, 2000). These habitats are characterized<br />
by tidal or shallow groundwater conditions.<br />
Aerial photography taken in 1939 (Figure 5D) shows the future airport property as farm land.<br />
The already straightened channel of Walnut Creek and the winding channel of Grayson Creek<br />
pass to the west and east, respectively, of the property. Topographic contours from show that<br />
the land slopes gently to the north, underlain by the alluvial fan deposits of Walnut Creek, and to<br />
11<br />
May 31, 2013
Fugro Consultants, Inc.<br />
Project No. 04.79221200<br />
a lesser degree from the smaller Grayson Creek. The estuarine deposits shown on Figure 5B<br />
(tidal marsh) at the north end of the property are drained and farmed, thus do not have a distinct<br />
appearance from the alluvial fan deposits. Alluvial fan and estuarine deposits are expected to<br />
interfinger in this area.<br />
Site development began in 1942 with the purchase by Contra Costa County of over 400 acres of<br />
land to build an airport. In 1943, the United States Army expropriated the site, added more than<br />
100 additional acres to the site, and named the new development the Concord Army Air Base.<br />
In 1947, the War Assets Administration returned the airport to the County for public use and the<br />
County renamed the airport after County Supervisor William J. Buchanan. Additional structures<br />
were built on the site in 1949, 1961, and 1992 (Contra Costa County <strong>Airport</strong>, 2013). A recent<br />
aerial photograph (Figure 5E) shows the airport in its present urban setting.<br />
Borehole and other subsurface data show that the stratigraphy underlying Buchanan Field<br />
<strong>Airport</strong> consists of artificial fill over Holocene alluvial fan deposits and, at the north end of the<br />
property, artificial fill over estuarine deposits (Figure 5C). The thickness of fill ranges from 4 to<br />
10 feet (Parikh, 2011; EBA Engineering, 2008). According to borehole data reviewed, the fill can<br />
be subdivided into four distinct units (Fill A, B, C, and D (Figure 5C)). Fill A generally consists of<br />
aggregate baserock of sandy gravel with minor amounts of clay. Fill B generally consists of well<br />
graded sand with varying amounts of gravel. Fill C generally consists of clayey fine sand with<br />
trace amounts of gravel. Fill D generally consists of clay with silt and fine to medium sand. The<br />
Holocene alluvial deposits consist of silty clay interbedded with silty sand and gravel (Parikh,<br />
2010; EBA Engineering, 2008; Witter et al., 2006). The estuarine deposits consist of very soft to<br />
stiff silt and clay with interbedded fine to coarse grained sand and gravel lenses. These deposits<br />
become very stiff below a depth of 40 feet.<br />
4.4 Livermore Municipal <strong>Airport</strong> (LVK)<br />
Livermore Municipal <strong>Airport</strong> is located on the floor of the Livermore basin, an east-west trending<br />
syncline or synclinorium (CGS, 2008). The basin floor is underlain in the near-surface by<br />
Holocene and Pleistocene alluvial deposits, and at depth by the Plio-Pleistocene Livermore<br />
Gravels (Witter et al, 2006; CGS, 2008) (Figure 6A). The airport property is located on the distal<br />
portions of the Arroyo Mocho alluvial fan (mapped as Qhfy) and Las Positas alluvial fan<br />
(mapped as Qhff). The more clay-rich deposits of Arroyo Las Positas are expected to interfinger<br />
across the property with the sands and silts of Arroyo Mocho. Subsurface data suggest that the<br />
stratigraphy underlying the Livermore Municipal <strong>Airport</strong> consists of artificial fill thickening<br />
downslope over Holocene alluvial fan deposits of varying texture (Figure 6B).<br />
Aerial photography taken in 1949 (Figure 6C) shows the airport property before development as<br />
grazing and farm lands. Arroyo Las Positas winds along the north boundary. Arroyo Mocho, a<br />
relatively larger stream draining the Diablo Range, enters from the southeast corner of the map<br />
and distributes into multiple channels, building a large alluvial fan, mapped as Qhfy on Figure<br />
6A, that slopes southwest through the airport area to meet the deposits of Arroyo Las Positas.<br />
12<br />
May 31, 2013
Fugro Consultants, Inc.<br />
Project No. 04.79221200<br />
The recency of the Arroyo Mocho deposits is indicated by the presence of fresh distributary<br />
channels, mapped in blue dots on Figure 6C.<br />
Site development began in the early 1960s and airport construction was completed in<br />
December 1965. The new airport encompassed 257 acres, a 4,000-foot asphalt runway with a<br />
parallel taxiway, an aircraft parking apron with 100 tie-downs, a beacon, a lighted wind cone and<br />
segmented circle, and 50 based aircraft. Additional structures were built on the site in 1970,<br />
1973, and 1979, 1985, and 1987. A second 2,699-foot parallel runway was built in 1985 and an<br />
extension of the main runway to 5,255 feet followed in 1989. Today, the Livermore Municipal<br />
<strong>Airport</strong> encompasses 644 acres (City of Livermore, 2013). A recent aerial photograph (Figure<br />
6D) shows the airport in its present urban setting.<br />
Borehole data indicate that artificial fill at the airport is present on the western 3/4 of the property<br />
and ranges in thickness from 4.5 to 10 feet, thickening westward or downslope (Figure 6B;<br />
Cornerstone Earth Group, 2010). Due to the limits of data, it is possible (but unlikely) that fill<br />
extends below depths of 10 feet. No significant fill thickness is found at the upslope, or eastern,<br />
end of the property. The fill can be subdivided into two distinct units (Fill A and Fill B). Fill A<br />
generally consists of very stiff to hard lean clay with fine sand. Fill B generally consists of<br />
medium dense, clayey, fine to coarse sand with fine to coarse gravel.<br />
Underlying the artificial fill are Holocene medial and distal alluvial fans deposits. These deposits<br />
consist of lean clay with sand, sandy lean clay, sandy silty clay, and silty clay interbedded with<br />
silty sand, clayey sand, and poorly graded sand with gravel (CGS, 2008).<br />
4.5 Moffett Federal Airfield (NUQ)<br />
Moffett Federal Airfield is located at the southern margin of San Francisco Bay in Santa Clara<br />
County. The airport is built over Holocene fine-grained alluvial fan deposits (Qhff) and Holocene<br />
estuarine deposits or Bay Mud (Qhbm; Figure 7A). Most of the airport property is located on the<br />
distal end of the Stevens Creek alluvial fan, derived from the Santa Cruz Mountains to the south<br />
of the site. Maps of the historical extent of bay environments based on 1800s US Coast Survey<br />
mapping, show that the north end of the airport property encompasses former tidal marsh and<br />
salt panne environments (Figure 7B; SFEI, 2000). The estuarine deposits are collectively<br />
referred to as San Francisco Bay Mud (Qhbm) on Figure 7A and Young Bay Mud (YBM) on<br />
Figure 7C.<br />
Aerial photography taken in 1939 (Figure 7D) shows the airport property before construction of<br />
the runways. Some facilities, including Hangar One, are already in place. The historical bay<br />
shoreline shown in Figure 7B is still visible, running parallel to an east-west dike that separates<br />
the uplands from the tidal marsh lands. The grasslands on which the airport runways are to be<br />
built are visible in the photograph. Topographic contours from the USGS Mountain View 7.5-<br />
minute quadrangle (1991) show a northward sloping alluvial fan surface, decreasing in gradient<br />
as it approaches the estuary. The airport is on the gently sloping north end of this alluvial fan.<br />
13<br />
May 31, 2013
Fugro Consultants, Inc.<br />
Project No. 04.79221200<br />
The jog in the contours as they cross the runways reflects the presence of artificial fill on which<br />
the runways are now built.<br />
Development of this area began in 1933 with the construction of the Sunnyvale Naval Air<br />
Station, which was later renamed Moffett Federal Airfield. Construction involved the import and<br />
placement of fill along the northern edge of the property (NASA, 2013; Atchley and Dobbs,<br />
1959), and beneath the runways.<br />
CPT and other subsurface data suggest that the stratigraphy underlying Moffett Federal Airfield<br />
consists of artificial fill over Holocene alluvial fan deposits and, at the north end of the property,<br />
artificial fill over estuarine deposits, Old Bay Mud (OBM), and Pleistocene alluvial deposits<br />
(Figure 7C). These sediments are underlain at depth by the Santa Clara Formation.<br />
Holocene alluvial fan deposits and YBM underlie the artificial fill and consists of unconsolidated<br />
clay, silty clay, silt, sand, and gravel (CH2MHill, 2011; Atchley and Dobbs, 1959). The YBM<br />
formed in marshlands and tidal mud flats of the San Francisco Bay and interfingers landward<br />
with the distal Holocene alluvial fan deposits shed eastward from the hills west and south of<br />
NUQ (Atchley and Dobbs, 1959). Drainage ditches and cuts north of the hangars expose<br />
gravelly clay alluvium near the surface, while adjacent areas show black humus-rich soil<br />
(Atchley and Dobbs, 1959).<br />
The YMB and Holocene alluvial fan deposits unconformably overlie older alluvium and estuarine<br />
deposits. OBM deposits consist of firm to very stiff silty and sandy clays and loose to dense silty<br />
and gravelly sands that represent an ancestral bay that occupied today’s San Francisco Bay<br />
about 110,000 years ago (Peter Kaldveer and Associates, Inc., 1980). OBM interfingers with<br />
late Pleistocene alluvial material that originated in the Santa Cruz mountains west and south of<br />
NUQ and consist of moderately dense clay, silt, and sand with minor gravel. These deposits<br />
were laid down during a sea level lowstand when streams flowed farther out onto the Bay plain<br />
before meeting the Bay along the paleo-Bay margin.<br />
5.0 LIQUEFACTION HAZARD ASSESSMENT<br />
5.1 Methodology<br />
<strong>Liquefaction</strong> is typically defined as the loss of strength in saturated, loose, sandy, or low<br />
plasticity fine-grained soils resulting from strong shaking during earthquakes. The loose sandy<br />
soils have a tendency to contract (compress) during shaking, resulting in the development of<br />
increased pore pressures between the soil particles. If the intensity or duration of the shaking is<br />
great enough, the build-up of excess pressure can lead to a significant loss of strength in the<br />
14<br />
May 31, 2013
Fugro Consultants, Inc.<br />
Project No. 04.79221200<br />
soils. Additionally, even if the soil does not fully liquefy, dissipation of excess pore pressure<br />
following the earthquake can result in soil compression and settlement.<br />
The susceptibility of soil to liquefaction is a function of gradation, density, fines content, and<br />
plasticity of fines. Increases in grain size distribution, soil density, fines content, and plasticity<br />
index decreases the susceptibility of soils to liquefaction. In addition, the liquefaction<br />
susceptibility of soils also decreases with respect to the age of the deposit and effective<br />
overburden stress.<br />
The liquefaction susceptibility of the soils was assessed following state of practice analysis<br />
methodology using simplified empirical SPT and CPT based procedures (e.g. the Simplified<br />
Procedure). Due to its widespread application, multiple revisions of these Simplified Procedures<br />
have been developed and reported over time (e.g. Seed et al., 1982, 1983, 1985; Robertson<br />
and Wride, 1997; Youd et al., 2001; Idriss and Boulanger, 2004, Cetin et al., 2004b). The<br />
approach recommended by Youd et al. (2001) is currently one of the predominant approaches<br />
adopted in the state of practice and has been selected for this study as it provides<br />
recommendations for both the SPT and CPT based liquefaction susceptibility approaches.<br />
In order to perform the liquefaction assessment, two variables need to be estimated: cyclic<br />
stress ratio (CSR), which characterizes the seismic demand on the soil, and the cyclic<br />
resistance ratio (CRR), which characterizes the soil capacity in resisting liquefaction. A factor of<br />
safety against liquefaction is then calculated as a ratio of CRR and CSR.<br />
CSR is estimated using input ground motion characteristics, peak ground acceleration (PGA)<br />
and earthquake magnitude (M). The selection of PGA and M values is discussed in the following<br />
section. CRR is calculated using SPT blow count values or CPT cone tip resistance corrected<br />
for overburden stress and fines content. The relationships between CRR and corrected SPT<br />
blow count or CPT tip resistance have been developed by Youd and others (2001) through a<br />
review of historical cases of liquefaction occurrence.<br />
In addition to calculating a factor of safety against liquefaction, our assessment also includes<br />
evaluation of liquefaction-induced reconsolidation settlements. <strong>Liquefaction</strong>-induced settlements<br />
were calculated using Ishihara and Yoshimine (1992) recommendations. It should be noted that<br />
the soil above the groundwater can also settle due to dynamic compaction, however, we have<br />
not included dynamic compaction settlements as part of this study.<br />
5.1.1 Ground Motion Parameters<br />
<strong>Liquefaction</strong> susceptibility analyses were performed for five sets of ground motion parameters<br />
corresponding to the following deterministic and probabilistic scenarios:<br />
• 1906 San Francisco Earthquake Scenario (Deterministic median)<br />
15<br />
May 31, 2013
Fugro Consultants, Inc.<br />
Project No. 04.79221200<br />
• Hayward-Rodgers Creek Scenario (Deterministic median)<br />
• Concord-Green Valley Scenario (Deterministic median)<br />
• 10% Probability of Exceedance in 50 Years Scenario (Probabilistic)<br />
• 2% Probability of Exceedance in 50 Years Scenario (Probabilistic)<br />
For each ground motion scenario, a single set of PGA and M values was selected for the<br />
analyses. The selected values are summarized in Table 1. For the deterministic scenarios, the<br />
M value was defined by the earthquake magnitude of each source and the PGA value was<br />
selected based on the review of the PGA grid maps developed for each scenario (Petersen et<br />
al., 2008; USGS, 2013c, Wald et al., 2005). Multiple grid points with varying PGAs were<br />
available within the area of each analyzed airport and are presented on Figures DA-1 through<br />
DA-5 in Appendix D. The selected value is generally between the average and the maximum of<br />
the individual data points and was based on the review of data point locations and variability.<br />
For the probabilistic scenarios, PGA and M values were selected by using the USGS online<br />
interactive deaggregation calculator (USGS, 2013). The calculations using the online USGS<br />
calculator were performed for several points within each airport footprint to evaluate possible<br />
variability in ground motions, and representative values were selected. Site conditions<br />
characterized by shear wave velocity in the upper 30 meters (V s30 ) below ground surface were<br />
assessed using USGS V s30 maps for California (USGS, 2013b). Because multiple data points<br />
for V s30 are available within the airports' footprint, an averaged value spanning the entire airport<br />
area was selected and is reported in Table 1.<br />
In addition to summarizing the PGA and M values applied for our analyses, Table 1 also<br />
presents the PGA normalized to a 7.5 magnitude earthquake (PGA 7.5 ). The PGA 7.5 normalized<br />
value can be used to compare seismic intensity with respect to liquefaction triggering between<br />
earthquakes of different magnitudes. For example, an initial comparison of PGA values of 0.32g<br />
and 0.49g for the 1906 San Francisco earthquake scenario and 10% probability of exceedance<br />
in 50-year scenario, respectively, for the Oakland International <strong>Airport</strong> differ significantly; once<br />
adjusted for earthquake magnitude, the two scenarios have similar PGA 7.5 values at 0.35g and<br />
0.37g, respectively (i.e., a comparable level of liquefaction hazard and impact would be<br />
expected for both scenarios).<br />
16<br />
May 31, 2013
Fugro Consultants, Inc.<br />
Project No. 04.79221200<br />
Table 1. Ground Motion Parameters for <strong>Liquefaction</strong> Assessment<br />
Peak Ground Acceleration (PGA) / Moment Magnitude (M)<br />
(PGA 7.5)<br />
<strong>Airport</strong> Location<br />
(V s30) 3 1906 San Hayward-<br />
10% Probability 2% Probability of<br />
Concord-<br />
Francisco Rodgers<br />
of Exceedance in Exceedance in<br />
Green Valley<br />
Earthquake Creek<br />
Scenario 1 Scenario 1 Scenario 1 50-Years<br />
50-Years<br />
Scenario 2 Scenario 2<br />
San Francisco<br />
International<br />
<strong>Airport</strong> (200 m/s)<br />
0.48 / 7.8<br />
(0.53)<br />
0.27 / 7.26<br />
(0.25)<br />
0.15 / 6.71<br />
(0.11)<br />
0.48 / 8.0<br />
(0.57)<br />
0.75 / 8.0<br />
(0.89)<br />
Oakland<br />
International<br />
<strong>Airport</strong> (210 m/s)<br />
0.32 / 7.8<br />
(0.35)<br />
0.35 / 7.26<br />
(0.32)<br />
0.20 / 6.71<br />
(0.15)<br />
0.49 / 6.7<br />
(0.37)<br />
0.73 / 6.7<br />
(0.55)<br />
Buchanan Field<br />
<strong>Airport</strong> (250 m/s)<br />
0.15 / 7.8<br />
(0.17)<br />
0.24 / 7.26<br />
(0.22)<br />
0.53 / 6.71<br />
(0.40)<br />
0.54 / 6.6<br />
(0.39)<br />
0.87 / 6.6<br />
(0.63)<br />
Livermore<br />
Municipal <strong>Airport</strong><br />
(330 m/s)<br />
0.18 / 7.8<br />
(0.20)<br />
0.25 / 7.26<br />
(0.23)<br />
0.17 / 6.71<br />
(0.13)<br />
0.53 / 6.7<br />
(0.40)<br />
0.84 / 6.7<br />
(0.63)<br />
Moffett Federal<br />
Airfield (290 m/s)<br />
0.31 / 7.8<br />
(0.34)<br />
0.32 / 7.26<br />
(0.29)<br />
0.10 / 6.71<br />
(0.07)<br />
0.49 / 6.7<br />
(0.37)<br />
0.75 / 6.7<br />
(0.56)<br />
Notes:<br />
1 Based on the PGA data points provided by USGS<br />
2 Based on USGS deaggregation calculator (2013)<br />
3 Based on USGS V s30 maps (2013)<br />
5.1.2 Groundwater<br />
Depth-to-groundwater (DTW) is an important variable in the assessment of liquefaction<br />
susceptibility since saturated soil conditions are required for liquefaction to occur. Saturation<br />
reduces the effective normal stress of near-surface sediment, increasing the likelihood of<br />
earthquake-induced liquefaction (Youd, 1973). DTW can vary daily, seasonally, and annually,<br />
as well as locally and regionally.<br />
For this assessment, only near-surface groundwater (i.e., groundwater levels at depths less<br />
than 40 feet) was considered and applied. The DTW data was compiled from CPT and borehole<br />
logs, and historical high ground water levels published by the California Geological Survey<br />
(2006 and 2008).<br />
17<br />
May 31, 2013
Fugro Consultants, Inc.<br />
Project No. 04.79221200<br />
5.1.3 Quality of Available Subsurface Data<br />
Quality and quantity of available subsurface data varied greatly by airport location. Subsurface<br />
data coverage (provided by large number of CPTs performed as part of past Fugro projects) for<br />
the San Francisco International <strong>Airport</strong> is very high in terms of both areal coverage, penetration<br />
depth, and data quality.<br />
For the Oakland International <strong>Airport</strong>, subsurface data is available in the form of borings, with<br />
relatively good aerial coverage, but with variable penetration depth. Shallow borings do not<br />
provide any insight into potentially liquefiable soil layers at deeper depths. Additionally, the<br />
available boring data provide limited information regarding soil fines content, which is an<br />
important characteristic for liquefaction triggering evaluation. Where fines content was not<br />
available, it was assumed based on soil description. The same approach to the interpretation of<br />
the fines content was applied for the other airports where liquefaction susceptibility was<br />
analyzed using boring data.<br />
Subsurface data coverage for the Buchanan Field <strong>Airport</strong> and Moffett Federal Airfield is limited.<br />
While the available data does provide an insight into the level of liquefaction susceptibility, the<br />
areal coverage is not sufficient to develop a robust understanding of the liquefaction hazard.<br />
Finally, for the Livermore Municipal <strong>Airport</strong>, the limited available subsurface data made a<br />
quantitative assessment of liquefaction susceptibility not possible.<br />
5.2 Results<br />
<strong>Liquefaction</strong> assessment results are developed in terms of factors of safety against liquefaction<br />
and liquefaction-induced settlements. The factor of safety can be used to determine the<br />
susceptibly to liquefaction of individual soil units, while liquefaction-induced settlements are a<br />
measure of the severity of the impact of liquefaction at the ground surface. Table 2 summarizes<br />
the number of borings and CPTs reviewed for this study and for which liquefaction analyses was<br />
performed. A complete list of CPT and borehole data analyzed can be found in Appendix C.<br />
18<br />
May 31, 2013
Fugro Consultants, Inc.<br />
Project No. 04.79221200<br />
Table 2. Summary of Subsurface Explorations Analyzed for <strong>Liquefaction</strong> <strong>Susceptibility</strong><br />
Borings<br />
Data Type<br />
San<br />
Francisco<br />
International<br />
<strong>Airport</strong><br />
Oakland<br />
International<br />
<strong>Airport</strong><br />
Location<br />
Buchanan<br />
Field <strong>Airport</strong><br />
Livermore<br />
Municipal<br />
<strong>Airport</strong><br />
- total - 1 48 2 62 8 -<br />
- greater than 30 feet depth - 12 10 0 -<br />
- 10 to 30 feet depth - 32 21 1 -<br />
- less than 10 feet depth - 4 31 7 -<br />
Moffett<br />
Federal<br />
Airfield<br />
Cone Penetration Test (CPT) 86 - - - 14 3<br />
Notes:<br />
1 Boring data was available for San Francisco <strong>Airport</strong> but was not reviewed because of the high quantity and area<br />
coverage of available CPT soundings.<br />
2 Additional borings were identified for Oakland <strong>Airport</strong> but were not included because of their limited depth.<br />
3 Seven out of fourteen CPTs were analyzed using partial data records because electronic data was not available.<br />
Many of the available borehole logs are relatively shallow, with depths of penetration as low as<br />
5 to 10 feet. The shallow explorations may be too shallow to capture deeper liquefiable soil<br />
layers. Accordingly, the liquefaction-induced settlement, which is a cumulative measure of the<br />
liquefaction impact on the ground surface, may be underestimated by shallow explorations.<br />
Occurrence of liquefaction as deep as 50 to 80 feet can contribute to total settlement.<br />
Therefore, data points presented in liquefaction settlement plots differentiate between borings<br />
with penetration exceeding 30 feet and borings with penetration depths between 10 and 30 feet.<br />
Borings that have a penetration depth of less than 10 feet were not included in the settlement<br />
analysis. Interpretation of settlement potential using shallower borings should be done with<br />
caution as they may underestimate liquefaction-induced settlements (i.e., layers of liquefiable<br />
soils may be present below the bottom of the boring). The number of borings and individual<br />
penetration depths categories are summarized in Table 2.<br />
A summary of the liquefaction assessment results are presented in the following sections.<br />
Figures 8 through 11 present the liquefaction settlement maps for the 2% probability of<br />
exceedance in 50 years scenario for four out of five airports. This scenario has the highest<br />
normalized PGA values for each of the evaluated airports (Table 1). A settlement map was not<br />
developed for the Livermore Municipal <strong>Airport</strong> because the available borings were too shallow to<br />
penetrate the historically high groundwater levels for the area (e.g. total borehole depths did not<br />
exceed 11 feet below ground surface), making an assessment of liquefaction susceptibility<br />
unfeasible. Appendix D presents a more thorough discussion of the liquefaction assessments<br />
performed and presents additional data for each analyzed airport location, including:<br />
19<br />
May 31, 2013
Fugro Consultants, Inc.<br />
Project No. 04.79221200<br />
• Site map showing the locations of analyzed borings or CPTs and cross section locations<br />
• Geotechnical cross sections showing subsurface conditions along airport runways<br />
• <strong>Liquefaction</strong> settlement maps, one for each of the five earthquake scenarios (no<br />
liquefaction assessment results provided for the Livermore Municipal <strong>Airport</strong>)<br />
• <strong>Liquefaction</strong> cross sections showing soil types, liquefaction susceptibility and zones<br />
contributing to liquefaction settlements for the five earthquake scenarios (no liquefaction<br />
assessment results provided for the Livermore Municipal <strong>Airport</strong>)<br />
5.2.1 San Francisco International <strong>Airport</strong><br />
The liquefaction assessment performed for San Francisco International <strong>Airport</strong> indicates that<br />
both coarse-grained fill and Holocene alluvium could be susceptible to liquefaction under the<br />
different earthquake scenarios evaluated (Figure 8, Appendix D). For the 2% probability of<br />
exceedance in 50 years scenario, calculated total liquefaction-induced settlements vary<br />
between about 1 and 4 inches across the site (Figure 8), with differential settlements between<br />
adjacent data points between 1 and 3 inches. As the result of the variable thickness and depth<br />
of the coarse-grained soils, the liquefaction induced total and differential settlements may vary<br />
across the site and between the exploration locations. For cases where closely spaced<br />
exploration points are not available to assess differential settlements, Martin and Lew (1999)<br />
suggests that differential settlements could be estimated on the order of one-half to two-thirds of<br />
the total settlements.<br />
The calculated settlement values for the 2% probability of exceedance in 50 years scenario<br />
account for liquefaction in the top 80 feet of soil. Deeper soil was neglected because of the<br />
limitations of simplified liquefaction triggering method and relatively smaller surface<br />
manifestations of possible liquefaction at depth.<br />
5.2.2 Oakland International <strong>Airport</strong><br />
The liquefaction assessment performed for Oakland indicates that both coarse-grained fill and<br />
Merritt Sand could be susceptible to liquefaction under any of the considered earthquake<br />
scenarios (Figure 9, Appendix D). For the 2% probability of exceedance in 50 years scenario,<br />
total liquefaction-induced settlements were calculated to vary from about 2 to 9 inches, with the<br />
higher values located under the main runway area where thicker deposits of artificial fill are<br />
present. However, high settlement values were also calculated in the eastern half of the site<br />
where deposits of artificial fill are thinner (Figure 9).<br />
The calculation of differential settlement cannot be reliably assessed based on the existing data.<br />
Comparing adjacent data points that have different penetration depths can be misleading.<br />
Differential settlement approximations may be on the order of one-half to two-thirds of the total<br />
20<br />
May 31, 2013
Fugro Consultants, Inc.<br />
Project No. 04.79221200<br />
settlements (Martin and Lew, 1999). Based on the calculated values of total settlement,<br />
differential settlements could be as high as 4 to 6 inches at OAK.<br />
5.2.3 Buchanan Field <strong>Airport</strong><br />
The data available for analysis at Buchanan Field <strong>Airport</strong> is limited in extent and depth of<br />
penetration. The deeper subsurface data is generally clustered at the northwest end of the site.<br />
Data under the runway footprints are shallow in penetration, and do not provide much<br />
subsurface information.<br />
Figure 10 presents the liquefaction settlement maps for the 2% probability of exceedance in 50<br />
years scenario. Figures DD-1 through DD-8 present a complete set of liquefaction assessment<br />
results.<br />
The results of the settlement calculations are included in Figure 11. The magnitude of<br />
settlement is generally less than 3 inches, with the exception of one location. Because of the<br />
limited subsurface data, no conclusions can be made about potential liquefaction settlement<br />
along the airport runways, but the results in adjacent areas suggest it is possible.<br />
5.2.4 Livermore Municipal <strong>Airport</strong><br />
It was not possible to perform a quantitative assessment of liquefaction potential at Livermore<br />
Municipal <strong>Airport</strong>. The available subsurface data did not reach the historical high water table<br />
and thus it was not possible to assess the liquefaction potential. The available geotechnical data<br />
are presented in cross sections in Figures DE-1 through DE-2.<br />
5.2.5 Moffett Federal Airfield<br />
The liquefaction assessment performed for Moffett Federal Airfield indicates that coarse-grained<br />
lenses within the Young Bay Mud could be susceptible to liquefaction under certain earthquake<br />
scenarios (Figure 11, Appendix D). The density of the coarse-grained lenses as well as their<br />
liquefaction susceptibility varies laterally and with depth. For the 2% probability of exceedance<br />
in 50 years scenario, total calculated liquefaction-induced settlements vary between about less<br />
than 1 inch to about 3 inches along the runway, with differential settlements between adjacent<br />
data points between 1 and 2 inches along the airfield runway. However, because of the large<br />
spacing between adjacent exploration points, settlements between points could vary<br />
significantly from the calculated values, depending on the localized variations in subsurface<br />
conditions.<br />
Settlements as high as 4 to 5 inches were calculated using CPT data concentrated on the<br />
western side of the property and along the main runway. The CPT data here, however, were<br />
collected less frequently with depth (i.e., one data point at one foot depth intervals compared to<br />
one data point every 2 inches for a typical CPT) and higher settlements might be an artifact of<br />
21<br />
May 31, 2013
Fugro Consultants, Inc.<br />
Project No. 04.79221200<br />
the incomplete dataset. It should also be noted that the coverage of subsurface data available to<br />
assess liquefaction potential was limited, with CPT locations spaced 1,000 to 3,000 feet apart.<br />
6.0 CONCLUSIONS<br />
This assessment updates and revises the earthquake-induced liquefaction susceptibility<br />
assessments conducted in WLA (1999) for San Francisco and Oakland International airports.<br />
The evaluation utilizes the updated ground motion data of Petersen and others (2008) and uses<br />
the updated procedures outlined by Youd and others (2001) to make the analysis consistent<br />
with accepted state of practice methodology. Additionally, the settlement estimate methodology<br />
employed in this study is comparably more quantitative and consistent with updated state of<br />
practice methodologies.<br />
The purpose of this assessment is to identify areas that may be susceptible to earthquakeinduced<br />
liquefaction and related settlement at San Francisco, Oakland, Moffett, Buchanan, and<br />
Livermore airports. A summary of the calculated liquefaction settlements is presented in Table<br />
3. The findings presented herein are based on available and existing geologic, geomorphic, and<br />
geotechnical data and should be considered preliminary and provisional.<br />
22<br />
May 31, 2013
Fugro Consultants, Inc.<br />
Project No. 04.79221200<br />
Table 3. Calculated <strong>Liquefaction</strong> Settlement Summary<br />
Calculated <strong>Liquefaction</strong> Induced Settlements Range (inches)<br />
<strong>Airport</strong> Location<br />
San Francisco<br />
International<br />
<strong>Airport</strong><br />
Oakland<br />
International<br />
<strong>Airport</strong><br />
1906 San<br />
Francisco<br />
Earthquake<br />
Scenario 1<br />
Hayward-<br />
Rodgers<br />
Creek<br />
Scenario 1<br />
Concord-<br />
Green Valley<br />
Scenario 1<br />
10% Probability<br />
of Exceedance in<br />
50-Years<br />
Scenario 2<br />
2% Probability of<br />
Exceedance in<br />
50-Years<br />
Scenario 2<br />
1 to 4 1 to 3 0 to 2 1 to 4 1 to 4<br />
2 to 9 2 to 9 2 to 8 2 to 9 2 to 9<br />
Buchanan Field<br />
<strong>Airport</strong> 1 1 to 4 1 to 4 1 to 4 1 to 4 1 to 4<br />
Livermore<br />
Municipal <strong>Airport</strong> 2 N/A N/A N/A N/A N/A<br />
Moffett Federal<br />
Airfield 3 1 to 3 1 to 3 below 1 2 to 3 2 to 3<br />
Notes:<br />
1 Based on limited number of data points. No data points available along the runways.<br />
2 Available borings to shallow to evaluate liquefaction induced settlements.<br />
3 Based on seven CPTs along the runway (USC-01 to USC-07). Seven CPTs located adjacent to the airport and<br />
analyzed using partial data not considered for this summary.<br />
6.1 <strong>Liquefaction</strong> Hazards<br />
6.1.1 San Francisco International <strong>Airport</strong><br />
The liquefaction analyses performed for San Francisco used data available from 86 CPT<br />
locations, representing the largest number of data locations used for analysis at any of the five<br />
airport locations. The CPT data used are well-distributed across the property and mostly exceed<br />
30 feet in depth. The CPT data indicate that the surficial deposits at the airport are primarily<br />
composed of artificial fill and are underlain by Young and Old Bay Mud.<br />
The analyses performed for each of the five scenarios results in a calculated settlement of<br />
between 0 and 4 inches (Table 3), and suggest that both coarse grained artificial fill and<br />
Holocene alluvium have the highest susceptibility to liquefaction. The range of settlement values<br />
calculated for the assessment are significantly lower than the range of settlement values of 12<br />
inches to 30 inches calculated during the study performed by WLA in 1999. A number of factors<br />
could be responsible for the different settlement values, including:<br />
23<br />
May 31, 2013
Fugro Consultants, Inc.<br />
Project No. 04.79221200<br />
• Data distribution: the data locations used in the WLA study were concentrated in the<br />
main terminal area and the northern end of the property. The data used in this study are<br />
more equally distributed across the site, and may be more representative of the site<br />
conditions.<br />
• Data extent: of the approximately 230 boreholes evaluated as part of the WLA study,<br />
approximately 130 of the boreholes were shallower than 30 feet, with approximately 80<br />
of those boreholes shallower than 10 feet.<br />
• Sampling intervals: the number and spacing of sampling intervals using borehole data<br />
can be limited, where as CPT data locations contain more sampling intervals for better<br />
resolution of liquefiable materials thicknesses.<br />
• Updated liquefaction procedures: the updated ground motion data of Petersen and<br />
others (2008) and procedures outlined by Youd and others (2001) applied during this<br />
study are different than those applied during the WLA (1999) study.<br />
6.1.2 Oakland International <strong>Airport</strong><br />
The liquefaction analyses performed for Oakland used data available from 48 borehole<br />
locations. The borings analyzed were concentrated within the southwestern and northeastern<br />
edges of the property. Additional data is available, but it was either 1) in a format that was<br />
difficult to analyze, or 2) not provided before the analysis was completed. As a result of the data<br />
limitations, no subsurface data was analyzed in the main terminal area located in the center of<br />
the property. The borehole data indicates that the surficial deposits at the airport are primarily<br />
composed of artificial fill and are underlain by Young and Old Bay Mud and Merritt Sand.<br />
The analyses performed for each of the five scenarios results in a calculated settlement of<br />
between 2 and 9 inches (Table 3). This settlement range is lower than the settlement range of 4<br />
to 12 inches calculated during the initial study performed by WLA in 1999. A number of factors<br />
could be responsible for the different settlement values, including:<br />
• Data distribution: The data locations used in the WLA study are located throughout the<br />
property, but are located in smaller clusters and widely spaced. The data used in this<br />
study are clustered along the western and northeastern portions of the property. No<br />
subsurface data was available or analyzed for the main terminal area for this study.<br />
• Data extent: Of the approximately 180 boreholes evaluated as part of the WLA study,<br />
approximately 70 of the boreholes were shallower than 30 feet, with approximately 4 of<br />
those boreholes shallower than 10 feet. Liquefiable material may be present below the<br />
maximum depth achieved by the borings.<br />
• Updated liquefaction procedures: the updated ground motion data of Petersen and<br />
others (2008) and procedures outlined by Youd and others (2001) during this study are<br />
different than those applied during the WLA (1999) study.<br />
24<br />
May 31, 2013
Fugro Consultants, Inc.<br />
Project No. 04.79221200<br />
The liquefaction analyses performed generally calculated the highest settlement values along<br />
the perimeter levees and dike along the western edge of the property. The levees and dike are<br />
primarily composed of two distinct fill units: medium stiff Bay Mud fill, approximately 10 to 20<br />
feet thick between stations 0+00 to 168+00; and loose to medium dense sand and gravel<br />
approximately15 to 30 feet between stations 168+00 to 250+00 (URS, 2011; Figure 4A). The<br />
foundation materials underlying the levees and dikes are composed of soft to medium stiff silty<br />
clay (likely to be Young Bay Mud) along most of the alignment, with the exception of the<br />
northern end of the alignment, where it is underlain by predominantly clayey sand and silty<br />
sand. Of the levee and dike fill materials, the sand and gravel fill was calculated to be liquefiable<br />
in all 5 scenarios while the Bay Mud fill yielded varying results.<br />
In addition to the levee and dike fill, coarse grained layers within the Young Bay Mud and the<br />
Merritt Sand were found to be liquefiable. Along the western portion of the property, the Merritt<br />
Sand is located approximately 10 to 40 feet below ground surface. Along the eastern and<br />
northern portions of the property, the borings suggest the presence of Merritt Sand, however the<br />
deepest boring analyzed (36.5 feet below ground surface) does not fully penetrate through the<br />
sand, leaving the thickness of the Merrit Sand in this portion of the property unknown. It is also<br />
unclear what the nature, extent, and thickness of the Merritt Sand is below the main airport<br />
terminals, where no subsurface data was evaluated.<br />
6.1.3 Buchanan Field <strong>Airport</strong><br />
The liquefaction analyses performed for each of the five scenarios results in a calculated<br />
settlement of between 1 and 4 inches (Table 3). The analyses used data available from 62<br />
borings. Of the borings analyzed, only 10 were deeper than 30 feet and 31 were drilled to a total<br />
depth of less than 10 feet (Table 2). The borings analyzed were concentrated within the<br />
northern half of the property and outside of the property along the western property boundary.<br />
No subsurface data was available for the southern half of the property.<br />
Borehole data indicates that the surficial deposits at the airport are primarily composed of<br />
artificial fill (subdivided into four distinct units; Fills A, B, C, and D), underlain by estuarine mud<br />
in the northern portion of the property, and Holocene medial and distal alluvial fans deposits in<br />
the southern portion of the property. Due to the sparse data available below 30 feet and<br />
absence of subsurface borehole data for the southern half of the property, the nature and extent<br />
of the contact between the estuarine mud and Holocene alluvial fan deposits is poorly<br />
constrained.<br />
Based on geologic and geomorphic mapping, Witter and others (2006) characterize Quaternary<br />
deposits at Buchanan as having a moderate susceptibility to liquefaction, with a small cluster of<br />
deposits at the north end having a very high susceptibility to liquefaction. These deposits likely<br />
correspond to areas of mapped artificial fill over estuarine mud deposits. Given the relative<br />
ages, densities, and textures of these deposits, Fill A (aggregate baserock composed of sandy<br />
gravel with minor amounts of fill), Fill B (well graded sand with varying amounts of gravel), Fill C<br />
25<br />
May 31, 2013
Fugro Consultants, Inc.<br />
Project No. 04.79221200<br />
(clayey fine sand with trace amounts of gravel), and the coarse-grained layers within the<br />
estuarine mud and Holocene alluvial fan deposits may have the highest potential for<br />
liquefaction.<br />
6.1.4 Livermore Municipal <strong>Airport</strong><br />
A liquefaction analysis was not performed at Livermore due to the shallow total depths of the<br />
limited number of boreholes available for analysis. Logs for eight boreholes were reviewed for<br />
the site, extending to a maximum total depth of 11 feet below ground surface. Groundwater was<br />
not encountered in any of the borings and the total depth of these borings is shallower than the<br />
historical high groundwater range of 15 to 25 feet below ground surface anticipated for the site<br />
(CGS, 2008).<br />
Based on geologic and geomorphic mapping, Witter and others (2006) characterize Quaternary<br />
deposits at Livermore as having a moderate to high susceptibility to liquefaction. A small cluster<br />
of deposits with a very high susceptibility to liquefaction mapped along the northern property<br />
boundary, correspond to former channels of the Arroyo Mocho fluvial system.<br />
Borehole data indicates that the surficial deposits at the airport are primarily composed of<br />
artificial fill and are underlain by Holocene medial and distal alluvial fans deposits composed of<br />
lean clay with sand, sandy lean clay, sandy silty clay, and silty clay interbedded with silty sand,<br />
clayey sand, and poorly graded sand with gravel. The fill can be subdivided into two distinct<br />
units: a very stiff to hard lean clay with fine sand (Fill A), and medium dense, clayey, fine to<br />
coarse sand with fine to coarse gravel (Fill B). Given the relative ages, densities, and textures of<br />
these deposits, Fill B and the coarse-grained layers within the Holocene alluvial fan deposits<br />
may have the highest liquefaction potential.<br />
6.1.5 Moffett Federal Airfield<br />
A liquefaction analysis was performed for the Moffett Federal airport using data available from<br />
14 CPT locations. The CPT data used are concentrated on the western side of the property and<br />
along the main runway, with the runway locations spaced 1,000 to 3,000 feet apart. The CPT<br />
data indicate that the surficial deposits at the airport are primarily composed of artificial fill<br />
underlain by fine-grained alluvial and estuarine deposits. Due to the relatively low density of<br />
CPT data points throughout the property, the nature and thickness of these deposits are poorly<br />
constrained.<br />
Based on geologic and geomorphic mapping, Witter and others (2006) characterize Quaternary<br />
deposits at Moffett as having a moderate susceptibility to liquefaction, with a small cluster of<br />
deposits at the north end having a very high susceptibility to liquefaction. These deposits<br />
correspond to areas of mapped artificial fill over estuarine mud deposits. Given the relative<br />
ages, densities, and textures of these deposits, the coarse-grained layers within the deposits<br />
may have the highest potential for liquefaction.<br />
26<br />
May 31, 2013
Fugro Consultants, Inc.<br />
Project No. 04.79221200<br />
6.2 Recommendations<br />
6.2.1 <strong>Liquefaction</strong> Investigations<br />
<strong>Liquefaction</strong> investigations are necessary for Buchanan and Livermore to more fully<br />
characterize the potential aerial extent and amount of liquefaction-related deformation. Those<br />
investigations should include a review of all available subsurface data, the collection of both<br />
CPT and soil boring data and samples, geotechnical laboratory analyses that would include, at<br />
a minimum, grain size analysis and Atterberg limits, aerial photographic analysis of site<br />
development and fill placement history, and the construction of geologic cross sections across<br />
the site showing the lateral extent and thickness of fill.<br />
6.2.2 Additional Site Studies<br />
Additional site studies are necessary at Moffett and Oakland to address the gaps in subsurface<br />
data coverage across these properties. All available geotechnical and engineering geologic<br />
reports for these airports should be obtained and reviewed to identify any data suitable for<br />
liquefaction analysis and to identify areas with gaps in data coverage. Where significant<br />
coverage gaps occur, a subsurface investigation should be developed in order to collect the<br />
additional data.<br />
A more comprehensive evaluation of fill thickness and character is recommended at Moffett,<br />
Oakland, and San Francisco to address differential settlement potential and identify areas with a<br />
higher susceptibility to liquefaction. This evaluation should include a review of all available<br />
subsurface data, aerial photographic analysis of fill placement history, and the construction of<br />
geologic cross sections across the site showing the lateral extent and thickness of both fill and,<br />
specifically at Oakland, the Merritt Sand.<br />
This evaluation should also include a review of all perimeter dikes and levees at San Francisco<br />
and Oakland to assess the potential for slope stability and seepage that may result from<br />
earthquake-induced liquefaction (it should be acknowledged that OAK is currently making<br />
improvements to their dikes and levees to meet the FEMA recommendations and<br />
requirements). The borings analyzed along the perimeter levees and dikes at Oakland do not<br />
cover the first 80 feet and the last 30 feet of the alignment, resulting in the liquefaction<br />
susceptibility of fill materials in these locations poorly constrained. In addition, evidence for<br />
seepage was documented by URS (2011) along the Oakland levees and dikes between stations<br />
168+00 and 188+00 and stations 193+00 to 220+00 that should be further evaluated.<br />
6.2.3 Mitigation<br />
Various methods have been used to mitigate liquefaction hazards within the San Francisco Bay<br />
Area. Some of the most commonly used and effective techniques suggested by Martin and Lew<br />
(1999) include:<br />
27<br />
May 31, 2013
Fugro Consultants, Inc.<br />
Project No. 04.79221200<br />
• Densification (e.g. vibrocompaction, vibro-replacement or vibro-stone columns, deep<br />
dynamic compaction, compaction or pressure grouting)<br />
• Drainage and dewatering<br />
• Reinforcement<br />
• Mixing (e.g. permeation grouting, soil mixing, or jet grouting)<br />
• Materials replacement<br />
• Structural mitigation<br />
Factors that need to be considered when selecting the appropriate mitigation strategy include<br />
cost, disruption to operations/facilities, subsurface and groundwater conditions, depth and<br />
lateral extent of liquefiable layers, accessibility and staging requirements, and changes in<br />
foundation response between treated and untreated areas. A site study should be performed to<br />
evaluate and select the technique best suited for the local site conditions.<br />
28<br />
May 31, 2013
Fugro Consultants, Inc.<br />
Project No. 04.79221200<br />
7.0 REFERENCES<br />
2007 Working Group on California Earthquake Probabilities (WGCEP), 2008, The Uniform<br />
California Earthquake Rupture Forecast, Version 2 (UCERF 2): U.S. Geological Survey<br />
Open-File <strong>Report</strong> 2007-1437 and California Geological Survey Special <strong>Report</strong> 203.<br />
Association of Bay Area Governments (<strong>ABAG</strong>), 2001, The REAL Dirt on <strong>Liquefaction</strong>: A Guide<br />
to the <strong>Liquefaction</strong> Hazard in Future Earthquakes Affecting the San Francisco Bay Area.<br />
AGS, 2008, Technical Memorandum No. 2: Geotechnical Study for Runway Safety Areas,<br />
Oakland International <strong>Airport</strong>.<br />
Andrus, R.D., and Stokoe, K.H., 1999, A liquefaction Evaluation Procedure Based on Shear<br />
Wave Velocity: U.S./Japan Natural Resources Development Program, 31st Joint<br />
Meeting Proceedings, May 11 – 14, Japan, p. 71-78.<br />
Andrus, R.D., Stokoe II, K.H., and Juang, C.H., 2004, Guide for Shear-Wave-Based<br />
<strong>Liquefaction</strong> Potential Evaluation, Earthquake Spectra, v. 20, no. 2, p. 285-308.<br />
Atchley, F. W., & Dobbs, R. O., 1959, Engineering Geology of Moffett Field and Coyote Hills,<br />
Santa Clara and Alameda Counties, California: Prepared for John Blume & Associates.<br />
Atchley.<br />
Atwater, B.F., Hedel, C.W., and Helley, E.J., 1977, Late Quaternary depositional history,<br />
Holocene sea-level changes, and vertical crustal movement, southern San Francisco<br />
Bay, California: U.S. Geological Survey Professional Paper 1014, 15p.<br />
California Geological Survey (CGS), 2002, California Geomorphic Provinces Note 36.<br />
California Geological Survey (CGS), 2006, Seismic Hazard Zone <strong>Report</strong> for the Mountain View<br />
7.5-Minute Quadrangle, Santa Clara, Alameda, and San Mateo Counties, California, 64<br />
p.<br />
California Geological Survey (CGS), 2008, Seismic Hazard Zone <strong>Report</strong> for the Livermore 7.5-<br />
Minute Quadrangle, Alameda County, California, 66 p.<br />
Cetin, K. O., Youd, T. L., Seed, R. B., Bray, J. D., Stewart, J. P., Durgunoglu, H. T., & Yilmaz,<br />
M. T., 2004a, <strong>Liquefaction</strong>-induced lateral spreading at Izmit Bay during the Kocaeli<br />
(Izmit)-Turkey earthquake: Journal of geotechnical and geoenvironmental engineering,<br />
130(12), 1300-1313.<br />
Cetin, K.O, Seed, R.B., Kiureghian, A.D., Tokimatsu, K., Harder, L.F. Jr., Kayen, R.E., and<br />
Moss, R.E.S., 2004b, Standard penetration test-based probabilistic and deterministic<br />
assessment of seismic soil liquefaction potential: Journal of Geotechnical and<br />
Geoenvironmental Engineering, v. 12, p. 1314-1340.<br />
29<br />
May 31, 2013
Fugro Consultants, Inc.<br />
Project No. 04.79221200<br />
CH2M Hill, 2011, Condition Assessment and Rehabilitation Plan, Hangar One, for NASA<br />
Headquarters and Ames Research Center, California, Volume 1 Condition Assessment.<br />
City of Livermore, 2013, The History of Livermore Municipal <strong>Airport</strong>: http://www.cityoflivermore<br />
.net/civicax/filebank/documents/5727/ (Accessed March 2013).<br />
Contra Costa County <strong>Airport</strong>, 2013, The History of Contra Costa County <strong>Airport</strong>s: http://cacontracostacounty.civicplus.com/static/depart/airport/TheHistoryofContraCostaCountyAir<br />
ports.htm (accessed March 2013).<br />
Cornerstone Earth Group, 2010, Livermore Municipal <strong>Airport</strong>, Geotechnical Investigation<br />
<strong>Report</strong>.<br />
Cubrinovski, M., Bradley, B., Wotherspoon, L., Green, R., Bray, J., Wood, C., Pender, M., Allen,<br />
J., Bradshaw, A., Rix, G., Taylor, M., Robinson, K., Henderson, D., Giorgini, S., Ma, K.,<br />
Winkley, A., Zupan, J., O'Rourke, T., DePascale, G., Wells, D., 2011, Geotechnical<br />
Aspects of the 22 February 2011 Christchurch earthquake: Bulletin of the New Zealand<br />
Society of Earthquake Engineering, 44(4), pp. 205-226.<br />
EBA Engineering, 2008, <strong>Report</strong> of Subsurface Investigation, Apex Aviation, Buchanan Field<br />
<strong>Airport</strong>, 1450 Sally Ride Drive, Concord, California.<br />
Fugro West, 1999, Airfield Development Program, Preliminary <strong>Report</strong> No. 2A (Task B1),<br />
Preliminary (Phase 1) Geotechnical Site Characterization, Volume 1-Main Text, Figures<br />
& Maps.<br />
Fugro West, 1999, Airfield Development Program, Preliminary <strong>Report</strong> No. 2, Conditions<br />
Assessment.<br />
Fugro West, 1999, Airfield Development Program, Preliminary <strong>Report</strong> No. 2C (Task 3B),<br />
Reconnaissance Sand Search Investigation.<br />
Fugro West, 2000, Preliminary <strong>Report</strong> No. 3D (Task D–Partial Submittal), Preliminary (Phase 1)<br />
Geotechnical Analyses, Volume 1-Main text & Figures.<br />
Helley, E. J. and K. R. Lajoie, 1979, Flatland deposits of the San Francisco Bay region,<br />
California: their geology and engineering properties, and their importance to<br />
comprehensive planning, U. S. Geological Survey Professional Paper. 943, 88 pp.<br />
Hitchcock, C., Givler, R., De Pascale, G., & Dulberg, R., 2008, Detailed Mapping of Artificial<br />
Fills, San Francisco Bay Area, California, National Earthquake Hazards Reduction<br />
Program, U.S. Geological Survey Award Number 07HQGR0078<br />
Holzer, T.L., 1998, The Loma Prieta, California, Earthquake of October 17, 1989 - <strong>Liquefaction</strong>:<br />
U.S. Geological Survey Professional Paper 1551-B, 314 p.<br />
Holzer, T.L., 1999, Extensive research on Loma Prieta improves understanding of earthquakes:<br />
Transactions, American Geophysical Union, Eos, v. 80, no. 41, p. 482-483.<br />
30<br />
May 31, 2013
Fugro Consultants, Inc.<br />
Project No. 04.79221200<br />
Holzer, T. L., Noce, T. E., and Bennett, M. J., 2010, Maps and documentation of seismic CPT<br />
soundings in the central, eastern, and western United States: U.S. Geological Survey<br />
Open-File <strong>Report</strong> 2010-1136, 80 p. and 3 data tables.<br />
Hossein, H., Andrus, R.D., Gassman, S.L., Hasek, M., Camp, W.M., Talwani, P., 2008,<br />
Characterizing the <strong>Liquefaction</strong> Resistance of Aged Soils (Abs.), Geotechnical<br />
Earthquake Engineering and Soil Dynamics IV, ASCE.<br />
Idriss, I.M., and Boulanger, R.W., 2004, Semi-empirical procedures for evaluating liquefaction<br />
potential during earthquakes: Invited Paper to the 11th SDEE and 3rd ICEGE<br />
conferences, University of California, Berkeley.<br />
Ishihara, K. and Yoshimine, M., 1992, Evaluation of Settlements in Sand Deposits Following<br />
<strong>Liquefaction</strong> during Earthquakes, Soils and Foundations, Vol. 32, No. 1, pp. 173-188.<br />
Knudsen, K.L., and Lettis, W.R., 1997a, Preliminary maps showing Quaternary geology of<br />
twenty 7.5-minute quadrangles, eastern Stockton, California, 1:100,000 quadrangle:<br />
National Earthquake Hazards Reduction Program, U.S. Geological Survey, Final<br />
Technical <strong>Report</strong> , Award #1434-94-G-2499.<br />
Knudsen, K.L., Noller, J.S., Sowers, J.M., Lettis, W.R., Graham, S.E., Randolph, C.E., and May,<br />
T.E., 1997b, Quaternary geology and liquefaction susceptibility, San Francisco,<br />
California 1:100,000 quadrangle: a digital database: U.S. Geological Survey Open-File<br />
<strong>Report</strong> 97-715, scale 1:100,000..<br />
Knudsen, K.L., J.M. Sowers, R.C. Witter, C.M. Wentworth, and E.J. Helley, 2000, Preliminary<br />
Maps of Quaternary Deposits and <strong>Liquefaction</strong> <strong>Susceptibility</strong>, Nine-County San<br />
Francisco Bay Region, California: A Digital Database, U.S. Geological Survey Open-File<br />
<strong>Report</strong> 00-444. Digital Database by Wentworth, C.M., Nicholson, R.S., Wright, H.M., and<br />
Brown, K.H. Online Version 1.0.<br />
Lajoie, K. R., & Helley, E. J., 1975, Differentiation of sedimentary deposits for purposes of<br />
seismic zonation. Studies for seismic zonation of the San Francisco Bay region: US<br />
Geological Survey Professional Paper, A39-A51.<br />
Leon, E., Gassman, S.L., and Talwani, P., 2006, Accounting for Soil Aging When Assessing<br />
<strong>Liquefaction</strong> Potential, Journal of Geotechnical and Geoenvironmental Engineering, 363-<br />
377.<br />
Martin, G. R., & Lew, M., 1999. Recommended Procedures for Implementation of DMG Special<br />
Publication 117, Guidelines for Analyzing and Mitigating <strong>Liquefaction</strong> Hazards in<br />
California. Southern California Earthquake Center (SCEC), University of Southern<br />
California<br />
National Aeronautics and Space Administration (NASA), 2013, Moffett Field History:<br />
http://history.arc.nasa.gov/moffett.htm (Accessed March 2013).<br />
Parikh Consultants, Inc. 2011, Geotechnical Engineering Investigation <strong>Report</strong>, Buchanan Field<br />
<strong>Airport</strong>, Runway Rehabilitation Project<br />
31<br />
May 31, 2013
Fugro Consultants, Inc.<br />
Project No. 04.79221200<br />
Peter Kaldveer and Associates, Inc., 1980, Foundation Investigation, Proposed Locker And<br />
Exercise Facility, Moffett Field, California.<br />
Petersen, Mark D., Frankel, Arthur D., Harmsen, Stephen C., Mueller, Charles S., Haller,<br />
Kathleen M., Wheeler, Russell L., Wesson, Robert L., Zeng, Yuehua, Boyd, Oliver S.,<br />
Perkins, David M., Luco, Nicolas, Field, Edward H., Wills, Chris J., and Rukstales,<br />
Kenneth S., 2008, Documentation for the 2008 Update of the United States National<br />
Seismic Hazard Maps: U.S. Geological Survey Open-File <strong>Report</strong> 2008–1128, 61 p.<br />
Port of Oakland, 2013, A History of Aviation Excellence and Importance to the Community,<br />
http://www.oaklandairport.com/media_backgrounder.shtml, accessed March 15, 2013.<br />
Robertson, P.K., and Wride, C.E., 1997, Cyclic liquefaction and its evaluation based on SPT<br />
and CPT: Seismic Short Course on Evaluation and Mitigation of Earthquake Induced<br />
<strong>Liquefaction</strong> Hazards, NCEER Workshop, San Francisco, CA, March, 1997.<br />
Rogers, A. M., and S. H. Figures, 1991, Engineering geologic site characterization of the greater<br />
Oakland-Alameda area, Alameda and San Francisco Counties, California: Final <strong>Report</strong><br />
to the National Science Foundation, Grant no. BCS –9003785.<br />
San Francisco Bay Conservation and Development Commission (SFBCDC), 1969, San<br />
Francisco Bay Plan, approved by the California State Legislature in 1969.<br />
San Francisco Estuary Institute (SFEI). 1998. San Francisco Bay Area EcoAtlas Geographic<br />
Information System, version 1.50b4.<br />
Seed, H.B., and Idriss, I.M., 1982, Ground motions and soil liquefaction during earthquakes:<br />
Earthquake Engineering Research Institute, Engineering Monograph volume 5, 134 p.<br />
Seed, H.B., Idriss, I.M., and Arango, I., 1983, Evaluation of liquefaction potential using field<br />
performance data: American Society of Civil Engineers, Journal of Geotechnical<br />
Engineering, v. 109, no. 3, p. 458-482.<br />
Seed, H. B., Tokimatsu, K., Harder, L. F., and Chung, R. M., 1985, Influence of SPT procedures<br />
in soil liquefaction resistance evaluations: Journal of Geotechnical Engineering, ASCE,<br />
v. 111, no. 12, p. 1425-1445.<br />
Sowers, J.M., Noller, J.S., and Lettis, W.R., 1998, Quaternary geology and liquefaction<br />
susceptibility, Napa, California 1:100,000 quadrangle: a digital database: U.S.<br />
Geological Survey Open-File <strong>Report</strong> 98-460.<br />
Tinsley, J.C., Youd, T.L., Perkins, D.M., and Chen, A.T.F, 1985, Evaluating <strong>Liquefaction</strong><br />
Potential, in Ziony, J.I., ed., Evaluating earthquake hazards in the Los Angeles Region -<br />
an earth-science perspective: U.S. Geological Survey Professional Paper 1360, p. 263-<br />
316.<br />
Tinsley, J.C., and Holzer, T.L., 1990, <strong>Liquefaction</strong> in the Monterey Bay region: U.S. Geological<br />
Survey Open-File <strong>Report</strong> 90-334, p. 642-643.<br />
32<br />
May 31, 2013
Fugro Consultants, Inc.<br />
Project No. 04.79221200<br />
URS Corporation, 2006, San Francisco International <strong>Airport</strong>, Airfield Seismic Stabilization and<br />
Realignment, Phase A Engineering <strong>Report</strong>, Volumes 1 and 2.<br />
URS Corporation, 2011, Geotechnical Data and Coastal Conditions <strong>Report</strong> for Perimeter Dike,<br />
Oakland International <strong>Airport</strong>, Oakland, California.<br />
U. S. Department of Agriculture (USDA), 1939, Black and white aerial photography, 1:20,000<br />
scale, frame BUT-289.<br />
U.S. Geological Survey (USGS), 2013a, 2008 Interactive Deaggregations (Beta):<br />
https://geohazards.usgs.gov/deaggint/2008/ (Accessed March 2013).<br />
U.S. Geological Survey (USGS), 2013b, Predefined Vs30 Mapping: http://earthquake.usgs.<br />
gov/hazards/apps/vs30/predefined.php (Accessed March 2013).<br />
U.S. Geological Survey (USGS), 2013c, Scenario Shake Maps:<br />
http://earthquake.usgs.gov/eqcenter/shakemap , (Released Scenarios “HaywardRC_se”,<br />
“ConcordGV_se”, “1906_se”) publication in progress.<br />
Wald, D. J., B. C. Worden, K. Lin, and K. Pankow (2005). "ShakeMap manual: technical<br />
manual, user's guide, and software guide." U. S. Geological Survey, Techniques and<br />
Methods 12-A1, 132 pp.<br />
William Lettis & Associates, Inc. (WLA), 1999, Evaluation of earthquake-induced liquefaction<br />
hazards at San Francisco Bay Area commercial airports, report prepared for the<br />
Association of Bay Area Governments, 37 p.<br />
Witter, R.C., Knudsen, K.L, Sowers, J.M., Wentworth, C.M., Koehler, R.D., Randolph, C.E.,<br />
Brooks, S.K., and Gans, K.D., 2006, Maps of Quaternary deposits and liquefaction<br />
susceptibility in the central San Francisco Bay region, California: U.S. Geological Survey<br />
Open-File <strong>Report</strong> 2006-1037, scale 1:100,000.<br />
Youd, T.L., 1973, <strong>Liquefaction</strong>, flow, and associated ground failure: U.S. Geological Survey<br />
Circular 688, 12 p.<br />
Youd, T.L., Nichols, D.R., Helley, E.J., and Lajoie, K.R., 1975, <strong>Liquefaction</strong> potential, in Studies<br />
for seismic zonation of the San Francisco Bay region: U.S. Geological Survey Prof<br />
Paper 941-A, p. 68-74. Youd, T.L., and Idriss, I.M., 1997, editors, Proceedings of the<br />
NCEER workshop on evaluation of liquefaction resistance of soils: Nation Center for<br />
Earthquake Engineering Research Technical <strong>Report</strong> NCEER-97-0022, 276 p.<br />
Youd, T.L., and Hoose, S.N., 1978, Historic ground failures in Northern California triggered by<br />
earthquakes: United States Geological Survey Professional Paper 993.<br />
Youd, T.L., and Perkins, J.B., 1987, Map showing liquefaction susceptibility of San Mateo<br />
County, California: United States Geological Survey Miscellaneous Investigations Map<br />
I-1257-G.<br />
33<br />
May 31, 2013
Fugro Consultants, Inc.<br />
Project No. 04.79221200<br />
Youd, T. L.; Idriss, I. M., 2001, "<strong>Liquefaction</strong> Resistance of Soils: Summary <strong>Report</strong> from the<br />
1996 NCEER and 1998 NCEER/NSF Workshops on Evaluation of <strong>Liquefaction</strong><br />
Resistance of Soils," Journal of Geotechnical and Geoenvironmental Engineering, Vol.<br />
127(10), 817-833.<br />
34<br />
May 31, 2013
Fugro Consultants, Inc.<br />
Project No. 04.79221200<br />
Figures
Fugro Consultants, Inc.<br />
Project No. 04.79221200 <strong>ABAG</strong><br />
CCR<br />
OAK<br />
LVK<br />
SFO<br />
79.221200 F01 <strong>Airport</strong> and Fault Location Map.ai Monday, March 11 2013 13:38:20<br />
SFO<br />
OAK<br />
NUQ<br />
LVK<br />
CCR<br />
Explanation<br />
Faults used in <strong>ABAG</strong> earthquake scenarios<br />
Other significant Bay Area faults<br />
Fault segment boundaries used in <strong>ABAG</strong> scenario<br />
San Francisco International <strong>Airport</strong><br />
Oakland International <strong>Airport</strong><br />
Moffett Federal Airfield<br />
Livermore Municipal <strong>Airport</strong><br />
Buchanan Field <strong>Airport</strong><br />
NUQ<br />
<strong>Airport</strong> and Fault Location Map<br />
Map from Association of Bay Area Governments, 2003.<br />
FIGURE 1
Fugro Consultants, Inc.<br />
Project No. 04.79221200 <strong>ABAG</strong><br />
A) Northwest end of main runway (bottom) and adjacent taxiway (top) at Oakland<br />
International <strong>Airport</strong>. Photo source: Holzer (1998).<br />
79.221200 F2A Photographs 1.ai Tuesday, March 12 2013 13:47:49<br />
B) Large sand boil near north end of main runway at Oakland International <strong>Airport</strong>.<br />
Photo source: Holzer (1998).<br />
Photographs of <strong>Liquefaction</strong> Features at Oakland International <strong>Airport</strong><br />
Following the October 17, 1989 Loma Prieta Earthquake<br />
FIGURE 2A
Fugro Consultants, Inc.<br />
Project No. 04.79221200 <strong>ABAG</strong><br />
A) Fissures, sand boils, and grabens associated with lateral spreading near northwest<br />
end of main runway at Oakland International <strong>Airport</strong>. Photo source: Holzer (1998).<br />
79.221200 F2B Photographs 2.ai Tuesday, March 12 2013 13:47:23<br />
B) Below-grade tramway, filled with as much as 1.8 m of<br />
extruded sand, at Oakland International <strong>Airport</strong> Terminal<br />
Building. Photo source: Holzer (1998).<br />
Photographs of <strong>Liquefaction</strong> Features at Oakland International <strong>Airport</strong><br />
Following the October 17, 1989 Loma Prieta Earthquake<br />
FIGURE 2B
Fugro Consultants, Inc.<br />
Project No. 04.79221200 <strong>ABAG</strong><br />
122°24'0"W<br />
122°23'0"W<br />
122°22'0"W<br />
122°21'0"W<br />
afem<br />
afem<br />
0 2,000 4,000 feet<br />
0 500 1,000 meters<br />
afem<br />
SAN FRANCISCO BAY<br />
37°38'0"N<br />
Qhbm<br />
Qha<br />
Qhbm<br />
Qoa<br />
See Figure 5C<br />
afem<br />
AA AA'<br />
00LC-29<br />
99LC-23<br />
San Francisco<br />
International <strong>Airport</strong><br />
afem<br />
00LC-30<br />
00LC-31<br />
00LC-32<br />
99LC-17<br />
00LC-34<br />
99LC-18<br />
99LC-19<br />
00LC-88<br />
00LC-92<br />
37°37'0"N<br />
afem<br />
Qoa<br />
79.221200 F03A SFO Geology.ai Thursday, March 21 2013 10:31:08<br />
Qha<br />
MILLBRAE<br />
br<br />
Qoa<br />
Source: Witter et al., 2006; USGS OFR 06-1037.<br />
af<br />
afem<br />
USC-02<br />
Qhbm<br />
Qha<br />
Qoa<br />
Qhbm<br />
Explanation<br />
afem<br />
Quaternary Geologic Map, San Francisco International <strong>Airport</strong><br />
NAD83 UTM Zone 10N<br />
Artificial fill Qhbm San Francisco Bay mud Qoa Early to late Pleistocene<br />
alluvial deposits<br />
Artificial fill over estuarine mud Qha Holocene alluvial deposits br Bedrock<br />
Borehole location<br />
Water<br />
37°36'0"N<br />
FIGURE 3A
Fugro Consultants, Inc.<br />
Project No. 04.79221200 <strong>ABAG</strong><br />
122°24'0"W<br />
122°23'0"W<br />
122°22'0"W<br />
122°21'0"W<br />
Tidal marsh<br />
Tidal flat<br />
0 2,000 4,000 feet<br />
Island<br />
0 500 1,000 meters<br />
SAN FRANCISCO BAY<br />
37°38'0"N<br />
Shallow bay<br />
Tidal marsh<br />
San Francisco<br />
International <strong>Airport</strong><br />
Shell flat<br />
37°37'0"N<br />
Tidal flat<br />
79.221200 F03B SFO Ecoatlas.ai Monday, March 18 2013 10:29:26<br />
MILLBRAE<br />
Source: SFEI EcoAtlas version 15002 (2000).<br />
Island<br />
Shallow bay/channel<br />
Shell flat<br />
Tidal marsh<br />
Explanation<br />
Tidal flat<br />
Tidal marsh<br />
Historical Bay Environments Map, San Francisco International <strong>Airport</strong><br />
NAD83 UTM Zone 10N<br />
37°36'0"N<br />
FIGURE 3B
79.221200 F03C Cross Section AA-AA'.ai Thursday, March 21 2013 10:31:52<br />
AA'<br />
West<br />
25<br />
0<br />
CPT FE00C029<br />
(52' north)<br />
CPT FE99C023<br />
(85' north)<br />
CPT FE00C030<br />
(85' north)<br />
CPT FE00C031<br />
(17' north)<br />
CPT FE00C032<br />
(58' north)<br />
Artificial fill<br />
CPT FE99C017<br />
(86' north)<br />
CPT FE00C034<br />
(58' north)<br />
CPT FE99C018<br />
(24' north)<br />
CPT FE99C019<br />
(24' north)<br />
CPT FE00C088<br />
(27' north)<br />
CPT FE00C092<br />
(36' north)<br />
AA'<br />
East<br />
25<br />
0<br />
Fugro Consultants, Inc.<br />
Project No. 04.79221200 <strong>ABAG</strong><br />
Elevation (feet, amsl)<br />
-25<br />
-50<br />
-75<br />
-100<br />
-125<br />
?<br />
?<br />
?<br />
?<br />
?<br />
Young bay mud<br />
Alluvium<br />
Old bay mud<br />
-25<br />
-50<br />
-75<br />
-100<br />
-125<br />
Elevation (feet, amsl)<br />
-150<br />
?<br />
Pleistocene alluvium<br />
?<br />
?<br />
?<br />
-150<br />
-175<br />
CPT data provided by Fugro Consultants, Inc. 25'<br />
-175<br />
Explanation<br />
0<br />
0 3000'<br />
FIGURE 3C<br />
Artificial fill: loose to medium dense poorly<br />
graded sand with silt, clay, and gravel<br />
Young bay mud: unconsolidated clay to silty<br />
clay<br />
Holocene alluvium: interbedded sand, silt,<br />
and clay<br />
?<br />
?<br />
Old bay mud: sandy clay to clayey sand<br />
Pleistocene alluvium: moderate dense clay, silt,<br />
and sand with gravel<br />
Coarse-grained lens, composed mainly of sand and gravel<br />
Vertical exaggeration = 120X<br />
Geologic Cross Section AA-AA', San Francisco International <strong>Airport</strong>, San Francisco, California
Fugro Consultants, Inc.<br />
Project No. 04.79221200 <strong>ABAG</strong><br />
Bayshore Highway<br />
SAN FRANCISCO BAY<br />
A) View looking north-northwest at airport site prior to construction (1927).<br />
79.221200 F03D Historical Aerial View of San Francisco International <strong>Airport</strong>.ai Monday, March 18 2013 10:36:02<br />
Bayshore Highway<br />
B) View looking north-northwest at airport site during construction (1938).<br />
SAN FRANCISCO BAY<br />
Historical Aerial Views of San Francisco International <strong>Airport</strong><br />
FIGURE 3D
Fugro Consultants, Inc.<br />
Project No. 04.79221200 <strong>ABAG</strong><br />
SAN FRANCISCO BAY<br />
Explanation<br />
Bay Margin from Air Photos<br />
Present shoreline<br />
79.221200 F03E Extent of Dry Land SFO.ai Friday, March 22 2013 10:33:13<br />
0 2000 4000 feet<br />
Modified from: William Lettis & Associates, Inc. (1999).<br />
1974<br />
1973<br />
1968<br />
1956<br />
1943<br />
Circa 1850 bay margin<br />
(SFEI, 2000)<br />
Approximate Extent of Developed Land in 1943, 1956, 1968, 1973, 1974<br />
and Circa 1850 Bay Margin, San Francisco International <strong>Airport</strong><br />
FIGURE 3E
Fugro Consultants, Inc.<br />
Project No. 04.79221200 <strong>ABAG</strong><br />
122°15'0"W<br />
122°14'0"W<br />
122°13'0"W<br />
122°12'0"W<br />
ac<br />
Qhff<br />
afem<br />
Qhbm<br />
afem<br />
Qds<br />
afem<br />
alf<br />
OAKLAND<br />
37°44'0"N<br />
240+00<br />
afem<br />
Qhfy<br />
220+00<br />
BB<br />
Qhbm<br />
Qhbm<br />
Qhbm<br />
200+00 180+00<br />
220+00 200+00<br />
11GMB-22<br />
11GMB-10<br />
Oakland<br />
International <strong>Airport</strong><br />
Qhbm<br />
37°43'0"N<br />
180+00 160+00<br />
SAN FRANCISCO BAY<br />
11GMB-8<br />
UB-9<br />
160+00 140+00<br />
See Figure 6C<br />
alf<br />
40+00<br />
20+00<br />
140+00<br />
UB-8<br />
60+00<br />
79.221200 F04A OAK_Geology.ai Thursday, March 21 2013 10:32:18<br />
0 2,000 4,000 feet<br />
0 500 1,000 meters<br />
Source: Witter et al., 2006; USGS OFR 06-1037.<br />
Levee stations from URS (2011).<br />
afem<br />
alf<br />
ac<br />
Artificial fill over estuarine mud<br />
Artificial levee fill<br />
Artificial stream channel<br />
Qhfy<br />
Qhbm<br />
Qhff<br />
alf<br />
Explanation<br />
UB-7<br />
120+00 100+00<br />
100+00<br />
BB'<br />
Latest Holocene alluvial<br />
fan deposits<br />
San Francisco Bay mud<br />
Holocene alluvial fan deposits,<br />
fine facies<br />
80+00<br />
Qds<br />
USC-02<br />
140+00<br />
Quaternary Geologic Map, Oakland International <strong>Airport</strong><br />
NAD83 UTM Zone 10N<br />
Merritt Sand<br />
37°42'0"N<br />
Water<br />
Borehole location<br />
Station location and number<br />
FIGURE 4A
Fugro Consultants, Inc.<br />
Project No. 04.79221200 <strong>ABAG</strong><br />
122°15'0"W<br />
122°14'0"W<br />
122°13'0"W<br />
122°12'0"W<br />
Tidal flat<br />
Tidal marsh<br />
Tidal marsh<br />
Tidal flat<br />
Island<br />
Bay<br />
Farm<br />
Island<br />
Tidal marsh<br />
OAKLAND<br />
37°44'0"N<br />
Tidal flat<br />
Oakland<br />
International <strong>Airport</strong><br />
37°43'0"N<br />
SAN FRANCISCO BAY<br />
Shallow bay<br />
79.221200 F04B OAK_Ecoatlas.ai Monday, March 18 2013 15:41:45<br />
Tidal flat<br />
0 2,000 4,000 feet<br />
0 500 1,000 meters<br />
Source: SFEI EcoAtlas version 15002 (2000).<br />
NAD83 UTM Zone 10N<br />
Explanation<br />
Island<br />
Tidal flat<br />
Shallow bay/channel Tidal marsh<br />
Historical Bay Environments Map, Oakland International <strong>Airport</strong> FIGURE 4B<br />
37°42'0"N
Fugro Consultants, Inc.<br />
Project No. 04.79221200 <strong>ABAG</strong><br />
?<br />
Elevation (feet, amsl)<br />
?<br />
?<br />
?<br />
?<br />
?<br />
79.221200 F04C Section BB-BB'.ai Thursday, March 21 2013 10:32:44<br />
BB BB'<br />
North South<br />
20<br />
Boring UB-4<br />
Projected 10' south<br />
Boring UB-10<br />
Projected 10' north<br />
20<br />
10<br />
Boring UB-7<br />
Projected 78' south<br />
Boring UB-8<br />
Projected 172' south<br />
Boring UB-9<br />
Projected 121' north<br />
Boring 11GMB-8<br />
Projected 250' north<br />
Boring 11GMB-10<br />
Projected 239' north<br />
Boring 11GMB-22<br />
Projected 125' north<br />
10<br />
Levee<br />
Levee<br />
0<br />
0<br />
?<br />
Artificial fill<br />
Young bay mud<br />
-10<br />
? ? ?<br />
? ?<br />
?<br />
-10<br />
? ?<br />
?<br />
?<br />
?<br />
?<br />
? ?<br />
-20<br />
Merritt Sand<br />
-20<br />
Elevation (feet, amsl)<br />
?<br />
? ?<br />
? ?<br />
?<br />
? ?<br />
?<br />
-30<br />
?<br />
-30<br />
?<br />
?<br />
?<br />
? ?<br />
?<br />
? ?<br />
?<br />
-40<br />
?<br />
?<br />
Old bay mud<br />
-40<br />
?<br />
?<br />
?<br />
? ?<br />
?<br />
? ?<br />
?<br />
?<br />
-50<br />
? ?<br />
?<br />
-50<br />
?<br />
-60<br />
-60<br />
10'<br />
Explanation<br />
Borehole data compiled from URS (2008) and Geomatrix (1995)<br />
Merritt Sand: very well sorted<br />
eolian sand<br />
Artificial fill: includes levee fill,<br />
aggregate base, silty sand, clayey<br />
sand, gravelly sand, and clay<br />
0<br />
Old bay mud: silty and sandy clays<br />
with silty and gravelly sands<br />
0 1000'<br />
Vertical exaggeration = 100X<br />
?<br />
Young bay mud: clay, silty clay,<br />
silt, sand, and gravel<br />
Coarse-grained lens, composed mainly<br />
of sand and gravel<br />
?<br />
FIGURE 4C<br />
Geologic Cross Section BB-BB', Oakland International <strong>Airport</strong>, Oakland, California
Fugro Consultants, Inc.<br />
Project No. 04.79221200 <strong>ABAG</strong><br />
122°15'0"W<br />
122°14'0"W<br />
122°13'0"W<br />
122°12'0"W<br />
San Leandro Bay<br />
Bay Farm<br />
Island<br />
North<br />
Field<br />
San Leandro Creek<br />
37°44'0"N<br />
SAN FRANCISCO BAY<br />
Oakland<br />
International <strong>Airport</strong><br />
37°43'0"N<br />
Present airport<br />
property boundary<br />
79.221200 F04D Aerial Photograph.ai Thursday, March 21 2013 12:18:11<br />
0 2,000 4,000 feet<br />
0 500 1,000 meters<br />
USDA aerial photograph BUT-289, 8-2-1939.<br />
NAD83 UTM Zone 10N<br />
Historical Aerial View of Oakland International <strong>Airport</strong>, 1939 FIGURE 4D<br />
37°42'0"N
Fugro Consultants, Inc.<br />
Project No. 04.79221200 <strong>ABAG</strong><br />
<strong>Airport</strong> runways<br />
Pond<br />
SAN FRANCISCO BAY<br />
Explanation<br />
Bay Margin from Air Photos<br />
Present shoreline<br />
79.221200 F04E Extent of Dry Land OAK.ai Friday, March 22 2013 10:33:22<br />
0 2000 4000 feet<br />
Modified from: William Lettis & Associates, Inc. (1999).<br />
1968<br />
1959<br />
1958<br />
1939<br />
Circa 1850 bay margin<br />
(SFEI, 2000)<br />
Approximate Extent of Developed Land in 1939, 1958, 1959, 1968, 1999,<br />
and Circa 1850 Bay Margin, Oakland International <strong>Airport</strong><br />
FIGURE 4E
Fugro Consultants, Inc.<br />
Project No. 04.79221200 <strong>ABAG</strong><br />
122°4'0"W<br />
122°3'0"W<br />
br<br />
br<br />
Qha<br />
br<br />
Qpf<br />
Qha<br />
br<br />
Qpa<br />
br<br />
Qha<br />
Qoa<br />
Qhbm<br />
Grayson Creek<br />
ac<br />
Qhbm<br />
CC'<br />
KA81-1<br />
KA81-3<br />
KA81-2<br />
KA83-103<br />
alf<br />
afem<br />
KL87-30<br />
alf<br />
Qhff<br />
KL87-45<br />
KL87-29<br />
KL87-87<br />
Walnut Creek<br />
alf<br />
Qhff<br />
Qhff<br />
Qhff<br />
alf<br />
alf<br />
Qoa<br />
Qpf<br />
Qha<br />
38°0'0"N<br />
alf<br />
alf<br />
ac<br />
Qhff<br />
CC' CC<br />
KL87-88<br />
See Figure 7C<br />
KL87-16<br />
CC<br />
Buchanan<br />
Field <strong>Airport</strong><br />
ac<br />
alf<br />
Qhff<br />
af<br />
Qpf<br />
37°59'0"N<br />
79.221200 F7A Buchanan_Geo.ai Tuesday, March 12 2013 12:07:05<br />
af<br />
afem<br />
alf<br />
ac<br />
Qhc<br />
br<br />
Qha<br />
0 2,000 feet<br />
0 500 meters<br />
Qhc<br />
Source: Witter et al., 2006; USGS OFR 06-1037.<br />
Explanation<br />
Artificial fill<br />
Qhbm San Francisco Bay mud<br />
Artificial fill over estuarine mud Qhf Holocene alluvial fan deposits<br />
Artificial levee fill<br />
Qhff Holocene alluvial fan deposits,<br />
fine facies<br />
Artificial stream channel<br />
Qha Holocene alluvial deposits,<br />
Historical stream channel deposits undifferentiated<br />
Qpf<br />
af<br />
alf<br />
CONCORD<br />
af<br />
Latest Pleistocene alluvial<br />
fan deposits<br />
af<br />
alf<br />
Qpa<br />
Qoa<br />
br<br />
KL87-16<br />
Quaternary Geologic Map, Buchanan Field <strong>Airport</strong><br />
af<br />
Qhf<br />
NAD83 UTM Zone 10N<br />
Latest Pleistocene alluvial<br />
deposits, undifferentiated<br />
Early to late Pleistocene alluvial<br />
deposits, undifferentiated<br />
Bedrock<br />
Water<br />
Borehole<br />
Qoa<br />
FIGURE 5A
Fugro Consultants, Inc.<br />
Project No. 04.79221200 <strong>ABAG</strong><br />
122°4'0"W<br />
122°3'0"W<br />
Tidal marsh<br />
38°0'0"N<br />
Willow groves<br />
Buchanan<br />
Field <strong>Airport</strong><br />
Moist grassland<br />
79.221200 F7B <strong>ABAG</strong>_Buchanan_EcoAtlas.ai Tuesday, March 12 2013 15:16:47<br />
37°59'0"N<br />
0 2,000 feet<br />
0 500 meters<br />
Source: SFEI EcoAtlas version 15002 (2000).<br />
Explanation<br />
Tidal marsh<br />
Willow groves<br />
Moist grassland<br />
NAD83 UTM Zone 10N<br />
Historical Bay Environments Map, Buchanan Field <strong>Airport</strong><br />
FIGURE 5B
79.221200 F05C Section CC-CC'.ai Thursday, March 21 2013 10:33:36<br />
Elevation (feet, amsl)<br />
CC<br />
South<br />
25<br />
15<br />
5<br />
-5<br />
Boring KL87-B016<br />
2' east<br />
A<br />
? ? ? ?<br />
?<br />
? ?<br />
?<br />
?<br />
?<br />
?<br />
D<br />
?<br />
Boring KL87-B088<br />
69' west<br />
B<br />
Artificial fill<br />
Boring KL87-B029<br />
78' west<br />
? ?<br />
1<br />
?<br />
C<br />
Boring KL87-B087<br />
1' east<br />
Boring KL87-B030<br />
60' west<br />
Concrete<br />
?<br />
?<br />
Boring KL87-B044<br />
18' west<br />
? ?<br />
? ? ?<br />
?<br />
A<br />
B<br />
Boring KA83-B103<br />
192' west<br />
Boring KL87-B045<br />
22' west<br />
?<br />
Boring KA81-B003<br />
84' west<br />
D<br />
Boring KA81-B002<br />
120' west<br />
Artificial fill<br />
? ?<br />
? ?<br />
Boring KA81-B001<br />
2' east<br />
? ?<br />
? ?<br />
?<br />
? ?<br />
CC'<br />
North<br />
25<br />
15<br />
5<br />
-5<br />
Elevation (feet, amsl)<br />
Fugro Consultants, Inc.<br />
Project No. 04.79221200 <strong>ABAG</strong><br />
-15<br />
?<br />
Estuarine mud<br />
-15<br />
?<br />
?<br />
?<br />
-25<br />
?<br />
-25<br />
?<br />
FIGURE 5C<br />
-35<br />
Borehole data compiled from Peter Kaldveer and Associates (1981 and 1983) and J.H. Kleinfelder and Associates (1987).<br />
A<br />
B<br />
C<br />
D<br />
Concrete<br />
Artificial fill: aggregate base, consisting of<br />
sandy gravel with minor amounts of clay<br />
Artificial fill: well graded sand with<br />
varying amounts of gravel<br />
Artificial fill: clayey fine sand with trace<br />
amounts of gravel<br />
Artificial fill: clay with silt and fine to<br />
medium sand<br />
Explanation<br />
?<br />
?<br />
1<br />
Estuarine mud: silt and clay with interbedded fine<br />
to coarse-grained sand<br />
Holocene alluvial fan deposits: interbedded sand,<br />
silt, and clay<br />
Coarse-grained lens, composed mainly of<br />
sand and gravel<br />
Geologic Cross Section CC-CC', Buchanan Field <strong>Airport</strong>, Concord, California<br />
10'<br />
-35<br />
0<br />
0 400'<br />
Vertical exaggeration = 40X
10'<br />
Fugro Consultants, Inc.<br />
Project No. 04.79221200 <strong>ABAG</strong><br />
122°4'0"W<br />
122°3'0"W<br />
122°2'0"W<br />
37°59'0"N<br />
38°0'0"N<br />
Grayson Creek<br />
Buchanan<br />
Field <strong>Airport</strong><br />
20'<br />
Walnut Creek<br />
79.221200 F5D Buchanan_Aerial_Figure_1939.ai Friday, March 22 2013 13:34:31<br />
Photograph BUU-280-67, 1939.<br />
30'<br />
40'<br />
Explanation<br />
Contour line (10-foot interval)<br />
0 2,000 feet<br />
Historical Aerial Photograph, 1939, Buchanan Field<br />
0 1,000 meters<br />
Topographic contours from USGS<br />
37°58'0"N<br />
FIGURE 5D
Fugro Consultants, Inc.<br />
Project No. 04.79221200 <strong>ABAG</strong><br />
122°4'0"W<br />
122°3'0"W<br />
122°2'0"W<br />
0 2,000 feet<br />
0 1,000 meters<br />
37°59'0"N<br />
79.221200 F5E Buchanan_Aerial_Figure_2009.ai Friday, March 22 2013 13:33:42<br />
38°0'0"N<br />
Buchanan<br />
Field <strong>Airport</strong><br />
Buchanan - Aerial Photo from NAIP 2009<br />
37°58'0"N<br />
FIGURE 5E
Fugro Consultants, Inc.<br />
Project No. 04.79221200 <strong>ABAG</strong><br />
121°50'0"W<br />
121°49'0"W<br />
121°48'0"W<br />
Qhf<br />
Qht<br />
Qhf<br />
Qht<br />
br<br />
Qhc<br />
Qha<br />
Qha<br />
37°43'0"N<br />
Qha<br />
br<br />
Qha<br />
Qha<br />
Qa<br />
br<br />
Qpf<br />
br<br />
Qhf<br />
Qhff<br />
Qhc<br />
ac<br />
Qhf<br />
Qf<br />
Qpf<br />
Qhc<br />
Qhff<br />
br<br />
ac<br />
Qhc<br />
Qhf<br />
Qf<br />
Qht<br />
Qpf<br />
Qt<br />
Qhty<br />
Arroyo Las Positas<br />
Qha<br />
Qt<br />
37°42'0"N<br />
DD DD'<br />
Qhff<br />
Qhff<br />
See Figure 8B<br />
EB-1<br />
EB-2<br />
EB-3<br />
EB-4<br />
Livermore<br />
Municipal <strong>Airport</strong><br />
EB-5<br />
Qhc<br />
Qhf<br />
79.221200 F06A <strong>ABAG</strong>_Livermore_Geo.ai Monday, March 18 2013 14:31:11<br />
Qhf<br />
gq<br />
alf<br />
gq<br />
Qhfy<br />
af<br />
gq<br />
Source: Witter et al., 2006; USGS OFR 06-1037.<br />
EB-2<br />
af<br />
alf<br />
gq<br />
ac<br />
Qhc<br />
Qhfy<br />
Artificial fill<br />
Artificial levee fill<br />
Gravel quarries and percolation ponds<br />
Artificial stream channel<br />
Historical stream channel deposits<br />
Latest Holocene alluvial fan deposits<br />
Borehole location<br />
af<br />
alf<br />
Qhf<br />
Explanation<br />
Qhty<br />
Qhf<br />
Qhff<br />
Qht<br />
Qha<br />
Qf<br />
Qhfy<br />
ac<br />
alf<br />
gq<br />
af<br />
alf<br />
Latest Holocene stream<br />
terrace deposits<br />
Holocene alluvial fan deposits<br />
Holocene alluvial fan deposits,<br />
fine facies<br />
Holocene stream terrace deposits<br />
Holocene alluvial deposits,<br />
undifferentiated<br />
Holocene to latest Pleistocene<br />
alluvial fan deposits<br />
gq<br />
Qt<br />
Qa<br />
Qpf<br />
br<br />
Qhty<br />
Qhf<br />
Water<br />
Qhc<br />
br<br />
af<br />
Qhty<br />
0 2,000 feet<br />
0 500 meters<br />
NAD83 UTM Zone 10N<br />
Bedrock<br />
Quaternary Geologic Map of Livermore Municipal <strong>Airport</strong><br />
37°41'0"N<br />
Holocene to latest Pleistocene<br />
stream terrace deposits<br />
Holocene to latest Pleistocene<br />
alluvial deposits, undifferentiated<br />
Latest Pleistocene alluvial<br />
fan deposits<br />
FIGURE 6A
79.221200 F06B Section DD-DD'.ai Thursday, March 21 2013 10:41:50<br />
Elevation (feet, amsl)<br />
400<br />
390<br />
380<br />
DD<br />
West<br />
Boring EB-1<br />
(projected 1' south)<br />
Aggregate base<br />
Boring EB-2<br />
(projected 20' south)<br />
Concrete<br />
?<br />
?<br />
?<br />
B<br />
Boring EB-3<br />
(projected 24' south)<br />
? ? ? ?<br />
Boring EB-4<br />
(projected 36' south)<br />
1<br />
3<br />
4<br />
5<br />
?<br />
10'<br />
6<br />
Boring EB-5<br />
(projected 4' south)<br />
2<br />
? ?<br />
DD'<br />
East<br />
400<br />
390<br />
380<br />
Elevation (feet, amsl)<br />
Fugro Consultants, Inc.<br />
Project No. 04.79221200 <strong>ABAG</strong><br />
370<br />
360<br />
?<br />
?<br />
?<br />
A<br />
Artificial fill<br />
Borehole data compiled from Cornerstone EarthGroup (2012).<br />
?<br />
??<br />
?<br />
0<br />
0 400'<br />
Vertical exaggeration = 40X<br />
370<br />
360<br />
Explanation<br />
FIGURE 6B<br />
?<br />
?<br />
A<br />
B<br />
Concrete<br />
Aggregate base (artificial fill)<br />
Artificial fill: very stiff to hard lean<br />
clay with sand<br />
Artificial fill: medium dense<br />
clayey sand with gravel<br />
Coarse-grained lens, composed<br />
mainly of sand and gravel<br />
Holocene alluvial fan deposits: interbedded silt,<br />
clay, and sand with varying amounts of gravel<br />
1<br />
2<br />
3<br />
4<br />
5<br />
6<br />
Silty clayey sand<br />
Sandy silt<br />
Silty clay<br />
Lean clay with sand<br />
Sandy silty clay<br />
Clayey sand gravel<br />
Geologic Cross Section DD-DD', Livermore Municipal <strong>Airport</strong>, Livermore, California
360<br />
Fugro Consultants, Inc.<br />
Project No. 04.79221200 <strong>ABAG</strong><br />
0 2,000 feet<br />
0 1,000 meters<br />
520<br />
560<br />
740<br />
620<br />
440<br />
460<br />
560<br />
520<br />
600<br />
440'<br />
420'<br />
400'<br />
Arroyo Las Positas<br />
420'<br />
Livermore<br />
Municipal <strong>Airport</strong><br />
Arroyo Mocho Channel<br />
79.221200 F06C <strong>ABAG</strong>_Livermore_Aerial Photo 1949.ai Friday, March 22 2013 15:52:49<br />
340'<br />
320'<br />
340'<br />
380'<br />
Photograph GS-JL-2-31, 1949.<br />
380'<br />
380'<br />
Explanation<br />
Contour line (10-foot interval)<br />
Stream channel<br />
Artificial channel<br />
Former channel with distributary point<br />
Historical Aerial Photograph, 1949, Livermore<br />
Arroyo Mocho<br />
460'<br />
Topographic contours from USGS<br />
FIGURE 6C
Fugro Consultants, Inc.<br />
Project No. 04.79221200 <strong>ABAG</strong><br />
0 2,000 feet<br />
0 1,000 meters<br />
Livermore<br />
Municipal <strong>Airport</strong><br />
79.221200 F07C Moffett_Air Photo and Contours.ai Friday, March 22 2013 12:02:40<br />
Livermore - Aerial Photograph from NAIP 2009<br />
FIGURE 6D
Fugro Consultants, Inc.<br />
Project No. 04.79221200 <strong>ABAG</strong><br />
122°4'0"W<br />
122°3'0"W<br />
122°2'0"W<br />
alf<br />
Qhbm<br />
alf<br />
Qhbm<br />
Qhbm<br />
alf<br />
Qhbm<br />
Qhbm<br />
Qhbm<br />
afem<br />
Qhbm<br />
afem<br />
Qhbm<br />
EE<br />
afem<br />
afem<br />
Qhbm<br />
alf<br />
Qhbm<br />
37°26'0"N<br />
alf<br />
alf<br />
USC-05<br />
USC-04<br />
afem<br />
afem<br />
alf<br />
alf<br />
Qhff<br />
USC-03<br />
See Figure 9C<br />
alf<br />
37°25'0"N<br />
Moffett Federal Airfield<br />
USC-02<br />
Qhff<br />
ac<br />
USC-06<br />
USC-01<br />
EE'<br />
79.221200 F07A <strong>ABAG</strong>_Moffett_Geo.ai Monday, March 18 2013 13:32:57<br />
Qhf<br />
Qhf<br />
gq<br />
Qhc<br />
Source: Witter et al. 2006. USGS OFR 06-1037.<br />
afem Artificial fill over estuarine mud<br />
alf Artificial levee fill<br />
USC-02<br />
Explanation<br />
Qhc<br />
Qhbm<br />
gq Gravel quarries and percolation ponds<br />
Qhf<br />
ac Artificial stream channel<br />
Qhff<br />
Borehole location<br />
Quaternary Geologic Map, Moffett Federal Airfield<br />
0 2,000 4,000<br />
feet<br />
0 500<br />
1,000 meters<br />
37°24'0"N<br />
NAD83 UTM Zone 10N<br />
Historical stream channel deposits<br />
San Francisco Bay mud<br />
Qhf: Holocene alluvial fan deposits<br />
Holocene alluvial fan deposits, fine facies<br />
Water<br />
FIGURE 7A
Fugro Consultants, Inc.<br />
Project No. 04.79221200 <strong>ABAG</strong><br />
122°4'0"W<br />
122°3'0"W<br />
122°2'0"W<br />
Tidal flat<br />
Tidal marsh<br />
37°26'0"N<br />
Salt pannes<br />
37°25'0"N<br />
Moffett Federal Airfield<br />
79.221200 F07B Moffett_EcoAtlas.ai Monday, March 18 2013 11:53:02<br />
Source: SFEI EcoAtlas version 15002 (2000).<br />
Shallow bay/channel<br />
Tidal flat<br />
Explanation<br />
Tidal marsh<br />
Salt pannes<br />
0 2,000 4,000 feet<br />
0 500 1,000 meters<br />
NAD83 UTM Zone 10N<br />
37°24'0"N<br />
Historical Bay Environments Map, Moffett Federal Airfield<br />
FIGURE 7B
79.221200 F07C Cross Section EE-EE'.ai Friday, March 22 2013 12:50:51<br />
Elevation (feet, amsl)<br />
20<br />
0<br />
-20<br />
EE<br />
North<br />
40<br />
Young bay<br />
mud<br />
?<br />
?<br />
?<br />
CPT USC-05<br />
(projected 466' west)<br />
?<br />
?<br />
?<br />
?<br />
?<br />
?<br />
?<br />
CPT USC-04<br />
(projected 389' east)<br />
? ?<br />
?<br />
? ? ?<br />
?<br />
?<br />
?<br />
?<br />
? ?<br />
?<br />
CPT USC-03<br />
(projected 239' east)<br />
Artificial fill<br />
?<br />
?<br />
?<br />
Older alluvial fan and estuarine<br />
deposits, undifferentiated<br />
?<br />
?<br />
?<br />
Holocene alluvial<br />
fan deposits<br />
?<br />
? ?<br />
? ?<br />
?<br />
CPT USC-02<br />
(projected 39' east)<br />
? ?<br />
?<br />
?<br />
?<br />
?<br />
?<br />
CPT USC-06<br />
(projected 1340' west)<br />
??<br />
? ?<br />
?<br />
CPT USC-01<br />
(projected 107' west)<br />
?<br />
?<br />
?<br />
?<br />
?<br />
EE'<br />
South<br />
?<br />
40<br />
20<br />
0<br />
-20<br />
Elevation (feet, amsl)<br />
Fugro Consultants, Inc.<br />
Project No. 04.79221200 <strong>ABAG</strong><br />
-40<br />
?<br />
?<br />
? ?<br />
?<br />
?<br />
?<br />
? ?<br />
?<br />
-40<br />
-60<br />
CPT data provided by <strong>ABAG</strong><br />
Explanation<br />
Artificial fill: includes concrete, aggregate base and<br />
other artificial and modified materials<br />
20'<br />
-60<br />
FIGURE 7C<br />
?<br />
?<br />
Holocene alluvial fan deposits: interbedded sand,<br />
silt, and clay<br />
Young bay mud: clay, silty clay, silt, sand, and gravel<br />
Older alluvial fan and estuarine deposits: silty and sandy clays<br />
with silty and gravelly sands<br />
Coarse-grained lens, composed mainly of sand and gravel<br />
Geologic Cross Section EE-EE', Moffett Federal Airfield, Mountain View, CA<br />
0<br />
0 1000'<br />
Vertical exaggeration = 50X
30 '<br />
Fugro Consultants, Inc.<br />
Project No. 04.79221200 <strong>ABAG</strong><br />
122°3'W<br />
122°2'W<br />
122°1'W<br />
0 2,000 feet<br />
0 1,000 meters<br />
37°26'N<br />
0 '<br />
0 '<br />
0 '<br />
Moffett Federal Airfield<br />
10 '<br />
5 '<br />
10 '<br />
0 '<br />
0 '<br />
0 '<br />
5 '<br />
37°25'N<br />
20 '<br />
79.221200 F07D Moffett_Air Photo 1939.ai Friday, March 22 2013 15:48:00<br />
80 '<br />
70 '<br />
60 '<br />
Photograph BUT-282-13, 1939.<br />
50 '<br />
40 '<br />
Explanation<br />
Contour line (5-foot interval)<br />
Historical Aerial Photograph, 1939, Moffett Field<br />
30 '<br />
20 '<br />
Topographic contours from USGS<br />
37°24'N<br />
FIGURE 7D
Fugro Consultants, Inc.<br />
Project No. 04.79221200 <strong>ABAG</strong><br />
122°3'W<br />
122°2'W<br />
122°1'W<br />
0 2,000 feet<br />
0 1,000 meters<br />
37°25'N<br />
37°26'N<br />
Moffett Federal Airfield<br />
79.221200 F16 <strong>ABAG</strong>_Moffett_Air Photo 2009.ai Friday, March 22 2013 13:20:58<br />
Moffett Field - Aerial Photograph from NAIP 2009<br />
37°24'N<br />
FIGURE 7E
Fugro Consultants, Inc.<br />
Project No. 04.79221200 <strong>ABAG</strong><br />
6010000<br />
6015000<br />
6020000<br />
6025000<br />
Legend<br />
99LC-27<br />
Settlement (Inches)<br />
2060000<br />
99LC-22<br />
2060000<br />
0 - 1<br />
1 - 2<br />
2 - 3<br />
3 - 4<br />
N:\Projects\04_2012\04_7922_1200_Caltrans<strong>Airport</strong>Recov\Outputs\2013_03_05_<strong>Report</strong>\mxd\Fig_08_SFO_LiquSettl_M8_00_a075_2008USGS_2Perc_50Yrs_to80Ft.mxd, 03/14/13, dpollard<br />
2055000<br />
2050000<br />
6010000<br />
99LC-02<br />
00LC-50<br />
00LC-28<br />
99LC-26<br />
99LC-01<br />
99LC-12<br />
00LC-54<br />
00LC-51<br />
99LC-25<br />
99LC-03<br />
99LC-14<br />
00LC-40<br />
00LC-65<br />
00LC-60<br />
99LC-04<br />
99LC-08 99LC-24<br />
00LC-61<br />
00LC-29<br />
99LC-13 00LC-77<br />
00LC-53<br />
99LC-23 99LC-09<br />
99LC-11 00LC-64 00LC-78<br />
00LC-59<br />
00LC-76<br />
00LC-33<br />
00LC-52<br />
00LC-58<br />
00LC-56<br />
99LC-10<br />
99LC-15<br />
00LC-75<br />
00LC-55<br />
00LC-30<br />
00LC-74<br />
00LC-31<br />
00LC-63<br />
00LC-94<br />
99LC-16<br />
00LC-57<br />
00LC-32<br />
00LC-83<br />
00LC-35<br />
00LC-79<br />
00LC-82<br />
00LC-39<br />
99LC-05<br />
00LC-62<br />
99LC-17<br />
00LC-72<br />
00LC-85<br />
00LC-73<br />
99LC-06<br />
00LC-34<br />
00LC-69<br />
00LC-90<br />
00LC-37<br />
00LC-41<br />
00LC-71<br />
99LC-18<br />
00LC-89<br />
00LC-68<br />
99LC-20<br />
00LC-81<br />
99LC-19<br />
00LC-36<br />
00LC-93<br />
00LC-70 00LC-80<br />
00LC-88 00LC-92<br />
00LC-67 00LC-38<br />
99LC-07<br />
00LC-87<br />
00LC-84<br />
00LC-86<br />
00LC-91<br />
99LC-21<br />
00LC-66<br />
6015000<br />
6020000<br />
6025000<br />
2055000<br />
2050000<br />
4 - 5<br />
> 5<br />
Magnitude= 8.0; P. G. A. = 0.75 g<br />
Settlements from top 80 feet only<br />
Coordinate Grid: CA State Plane, Zone 3,<br />
NAD83, Feet<br />
Ü1:18,000<br />
0 750 1,500 3,000<br />
Feet<br />
<strong>Liquefaction</strong> Settlement Map<br />
(2% Probability of Exceedance<br />
in 50-Years Scenario)<br />
San Francisco International <strong>Airport</strong><br />
San Francisco, California<br />
FIGURE 8
Fugro Consultants, Inc.<br />
Project No. 04.79221200 <strong>ABAG</strong><br />
6055000<br />
6060000<br />
6065000<br />
6070000<br />
Legend<br />
08B-10<br />
(9)<br />
08B-11<br />
08B-14<br />
08B-12<br />
08B-13<br />
08B-15<br />
08B-16<br />
08B-18<br />
Settlement (Inches)<br />
From borings ≥ 30 feet depth<br />
0 - 1<br />
1 - 2<br />
2 - 3<br />
3 - 4<br />
Settlement (Inches)<br />
From borings 10 to 30 feet depth<br />
0 - 1<br />
1 - 2<br />
2 - 3<br />
3 - 4<br />
N:\Projects\04_2012\04_7922_1200_Caltrans<strong>Airport</strong>Recov\Outputs\2013_03_05_<strong>Report</strong>\mxd\Fig_09_OAK_LiquSettl_M6_70_a073_2475Yr.mxd, 03/14/13, dpollard<br />
2090000<br />
2085000<br />
6055000<br />
11WL-2<br />
UB-10<br />
(8)<br />
11GB-20<br />
11GB-19<br />
11B-9<br />
11GMB-14<br />
08B-9<br />
00GB-4<br />
08B-8<br />
11GMB-22<br />
11GMB-12<br />
11GMB-9<br />
11GMB-11<br />
(6)<br />
11GMB-10<br />
08B-7<br />
11B-7<br />
11GMB-8<br />
(5)<br />
UB-9<br />
6060000<br />
08B-6<br />
08B-5<br />
UB-8<br />
11B-5<br />
(5) 08B-4<br />
UB-7<br />
(6)<br />
11B-3<br />
08B-3<br />
08B-2<br />
UB-4<br />
6065000<br />
08B-17<br />
UB-3<br />
(9)<br />
08B-1<br />
11B-1<br />
11WL-4<br />
11WL-3<br />
UB-5<br />
(6)<br />
08B-20<br />
08B-19<br />
08B-21<br />
6070000<br />
2090000<br />
2085000<br />
4 - 5<br />
> 5<br />
(9) - Calculated<br />
Settlement<br />
Magnitude= 6.7; P. G. A. = 0.73 g<br />
Coordinate Grid: CA State Plane, Zone 3,<br />
NAD83, Feet<br />
Ü1:18,000<br />
4 - 5<br />
> 5<br />
(9) - Calculated<br />
Settlement<br />
0 750 1,500 3,000<br />
Feet<br />
<strong>Liquefaction</strong> Settlement Map<br />
(2% Probability of Exceedance<br />
in 50-Years Scenario)<br />
Oakland International <strong>Airport</strong><br />
Oakland, California<br />
FIGURE 9
Fugro Consultants, Inc.<br />
Project No. 04.79221200 <strong>ABAG</strong><br />
6108000<br />
6110000<br />
6112000<br />
6114000<br />
6116000<br />
6118000<br />
Legend<br />
Settlement (Inches)<br />
From borings ≥ 30 feet depth<br />
Settlement (Inches)<br />
From borings 10 to 30 feet depth<br />
0 - 1<br />
0 - 1<br />
2190000<br />
KA81-105<br />
KA81-104<br />
2190000<br />
1 - 2<br />
2 - 3<br />
1 - 2<br />
2 - 3<br />
N:\Projects\04_2012\04_7922_1200_Caltrans<strong>Airport</strong>Recov\Outputs\2013_03_05_<strong>Report</strong>\mxd\Fig_10_BUC_LiquSettl_M6_60_a087_2475Yr.mxd, 03/14/13, dpollard<br />
2188000<br />
2186000<br />
2184000<br />
6108000<br />
KA83-2<br />
KA83-PP1<br />
KA83-1<br />
KA83-PB5<br />
KA83-PP4<br />
6110000<br />
KA81-5<br />
KA81-8<br />
KA81-6<br />
KA81-9<br />
KA81-7<br />
KA83-A1<br />
KA83-A3<br />
KA83-A2<br />
KA90-3<br />
KA83-3<br />
KA83-PB2<br />
KA83-PP3<br />
KA83-PB4<br />
KA81-1<br />
KA81-4<br />
KA81-2<br />
KA90-2<br />
KA83-102<br />
6112000<br />
KA81-3<br />
KA81-103<br />
KA81-101<br />
KA81-102<br />
KA90-1<br />
KA83-103<br />
KA83-101<br />
6114000<br />
6116000<br />
6118000<br />
2188000<br />
2186000<br />
2184000<br />
3 - 4<br />
4 - 5<br />
> 5<br />
KA = Kaldveer Associates<br />
KL = Kleinfelder Associates<br />
PRK = Parikh Consultants<br />
Magnitude= 6.6; P. G. A. = 0.87 g<br />
Only borings with > 30 feet total depth<br />
are shown<br />
Coordinate Grid: CA State Plane, Zone 3,<br />
NAD83, Feet<br />
Ü1:12,000<br />
3 - 4<br />
4 - 5<br />
> 5<br />
0 500 1,000 2,000<br />
Feet<br />
<strong>Liquefaction</strong> Settlement Map<br />
(2% Probability of Exceedance<br />
in 50-Years Scenario)<br />
Buchanan <strong>Airport</strong><br />
Concord, California<br />
FIGURE 10
Fugro Consultants, Inc.<br />
Project No. 04.79221200 <strong>ABAG</strong><br />
6105000<br />
6110000<br />
6115000<br />
6120000<br />
Legend<br />
Settlement (Inches)<br />
0 - 1<br />
1 - 2<br />
USC-05<br />
2 - 3<br />
USC-04<br />
3 - 4<br />
1980000<br />
1980000<br />
4 - 5<br />
> 5<br />
N:\Projects\04_2012\04_7922_1200_Caltrans<strong>Airport</strong>Recov\Outputs\2013_03_05_<strong>Report</strong>\mxd\Fig_11_MOF_LiquSettl_M6_70_a075_2475Yr.mxd, 03/14/13, dpollard<br />
1975000<br />
6105000<br />
USC-03<br />
TTC-02<br />
TTC-01<br />
TTC-05<br />
TTC-07<br />
USC-02<br />
TTC-04<br />
TTC-06<br />
TTC-03<br />
USC-06<br />
USC-01<br />
6110000<br />
USC-07<br />
6115000<br />
6120000<br />
1975000<br />
Magnitude= 6.7; P. G. A. = 0.75 g<br />
Only borings with > 30 feet total depth<br />
are shown<br />
Coordinate Grid: CA State Plane, Zone 3,<br />
NAD83, Feet<br />
Ü1:18,000<br />
0 750 1,500 3,000<br />
Feet<br />
<strong>Liquefaction</strong> Settlement Map<br />
2% Probability of Exceedance<br />
in 50-Years Scenario<br />
Moffett Federal Airfield<br />
Mountain View, California<br />
FIGURE 11
Fugro Consultants, Inc.<br />
Project No. 04.79221200 <strong>ABAG</strong><br />
79.221200 F12 <strong>Liquefaction</strong> Hazard Map SFO.ai Monday, March 18 2013 12:22:09<br />
Source: William Lettis & Associates, Inc. (1999).<br />
Explanation<br />
Preliminary <strong>Liquefaction</strong> Hazard Map,<br />
San Francisco International <strong>Airport</strong><br />
FIGURE 12
Fugro Consultants, Inc.<br />
Project No. 04.79221200 <strong>ABAG</strong><br />
79.221200 F13 <strong>Liquefaction</strong> Hazard Map Oakland.ai Monday, March 18 2013 12:24:18<br />
Source: William Lettis & Associates, Inc. (1999).<br />
Explanation<br />
Preliminary <strong>Liquefaction</strong> Hazard Map, Oakland International <strong>Airport</strong><br />
FIGURE 13
Fugro Consultants, Inc.<br />
Project No. 04.79221200 <strong>ABAG</strong><br />
122°4'0"W<br />
122°3'0"W<br />
VL<br />
M<br />
VL<br />
L<br />
VL<br />
38°0'0"N<br />
L<br />
M<br />
VH<br />
VL<br />
M<br />
L<br />
Buchanan<br />
Field <strong>Airport</strong><br />
L<br />
37°59'0"N<br />
M<br />
79.221200 F14 Buchanan_<strong>Liquefaction</strong>.ai Monday, March 18 2013 12:25:21<br />
VL<br />
Source: Witter et al., 2006; USGS OFR 06-1037.<br />
Explanation<br />
<strong>Liquefaction</strong> <strong>Susceptibility</strong><br />
VH<br />
H<br />
M<br />
L<br />
Very high<br />
High<br />
Medium<br />
Low<br />
VL<br />
Very low<br />
Water<br />
0 2,000 feet<br />
0 500 meters<br />
NAD83 UTM Zone 10N<br />
Regional <strong>Liquefaction</strong> <strong>Susceptibility</strong>, Buchanan Field <strong>Airport</strong> FIGURE 14
Fugro Consultants, Inc.<br />
Project No. 04.79221200 <strong>ABAG</strong><br />
121°50'0"W<br />
121°49'0"W<br />
121°48'0"W<br />
VL<br />
VL<br />
VL<br />
M<br />
L<br />
L<br />
VH<br />
Arroyo Las Positas<br />
37°42'0"N<br />
VH<br />
M<br />
M<br />
Livermore<br />
Municipal <strong>Airport</strong><br />
H<br />
VH<br />
37°41'0"N<br />
H<br />
VH<br />
79.221200 F15 <strong>ABAG</strong>_Livermore_<strong>Liquefaction</strong>.ai Monday, March 18 2013 12:28:13<br />
Source: Witter et al., 2006; USGS OFR 06-1037.<br />
M<br />
Explanation<br />
<strong>Liquefaction</strong> <strong>Susceptibility</strong><br />
VH Very high VL Very low<br />
H<br />
M<br />
L<br />
High<br />
Medium<br />
Low<br />
Water<br />
M<br />
0 2,000 feet<br />
0 500 meters<br />
NAD83 UTM Zone 10N<br />
Regional <strong>Liquefaction</strong> <strong>Susceptibility</strong>, Livermore Municipal <strong>Airport</strong> FIGURE 15
Fugro Consultants, Inc.<br />
Project No. 04.79221200 <strong>ABAG</strong><br />
122°4'0"W<br />
122°3'0"W<br />
122°2'0"W<br />
M<br />
VH<br />
37°26'0"N<br />
VH<br />
#*(<br />
146<br />
M<br />
÷<br />
#*(<br />
147<br />
37°25'0"N<br />
Moffett Federal Airfield<br />
M<br />
79.221200 F16 <strong>ABAG</strong>_Moffett_<strong>Liquefaction</strong>.ai Thursday, March 21 2013 10:11:55<br />
M<br />
0 2,000 feet<br />
0 500 meters<br />
Source: Witter et al. 2006; USGS OFR 06-1037.<br />
NAD83 UTM Zone 10N<br />
Explanation<br />
<strong>Liquefaction</strong> <strong>Susceptibility</strong><br />
<strong>Liquefaction</strong> Effects of 1906 Earthquake<br />
(Youd and Hoose, 1978)<br />
VH Very high VL Very low<br />
High<br />
146<br />
H<br />
Water #*(<br />
Disturbed well, approximate location<br />
M Medium<br />
Ground settlement, approximate location<br />
L Low<br />
÷<br />
Regional <strong>Liquefaction</strong> <strong>Susceptibility</strong>, Moffett Federal Airfield FIGURE 16<br />
37°24'0"N
Fugro Consultants, Inc.<br />
Project No. 04.79221200<br />
Appendix A<br />
<strong>Report</strong>s Reviewed as Part of this Study
Fugro Consultants, Inc.<br />
Project No. 04.79221200<br />
<strong>Airport</strong> <strong>Report</strong> Name <strong>Report</strong> Preparer <strong>Report</strong> Date<br />
CCR<br />
CCR<br />
CCR<br />
CCR<br />
CCR<br />
CCR<br />
CCR<br />
CCR<br />
CCR<br />
CCR<br />
CCR<br />
CCR<br />
CCR<br />
Foundation Investigation for Federal Express Building; Pacheco, CA (K199 - 35) Peter Kaldveer and Associates, Inc. November 1983<br />
Geotechnical Investigation for Bedford Aviation Hangar Buchanan Field<br />
Concord, California (K199 - 99 - 107) Kaldveer and Associates, Inc. May 1990<br />
Foundation Investigation for Proposed "T" Hangars Buchanan Field Concord,<br />
California (K403 - 16) Peter Kaldveer and Associates, Inc. May 1981<br />
Feasibility Foundation Investigation and Fault Location Study for Buchanan Field<br />
Heliport; Concord, California (K403 - 17) Peter Kaldveer and Associates, Inc. June 1981<br />
Foundation Investigation for Proposed Corporate Hangar; Concord, California<br />
(K431 - 68) Peter Kaldveer and Associates, Inc. March 1983<br />
Supplemental Foundation Investigation Proposed Corporate Hanger; Concord,<br />
California (K431 - 68A) Peter Kaldveer and Associates, Inc. August 1983<br />
Foundation Investigation for Undeveloped Property; Pacheco, California (K566 -<br />
3) Peter Kaldveer and Associates, Inc. August 1978<br />
Foundation Investigation for Concord Office Park; Concord, California (K566 - 9) Peter Kaldveer and Associates, Inc. August 1980<br />
Feasibility Foundation Investigation for <strong>Airport</strong> Center Office Park; Concord,<br />
California (K566 - 11) Peter Kaldveer and Associates, Inc. July 1985<br />
Updated Feasibility Foundation Investigation for Pace Membership Warehouse;<br />
Concord, California (K566 - 22 - 732) Kaldveer and Associates, Inc. May 1991<br />
Geotechnical Investigation for Pace Membership Warehouse; Concord,<br />
California (K566 - 22A - 1075) Kaldveer and Associates, Inc. December 1991<br />
Foundation Investigation for Micropump Building; Pacheco, California (K689 - 1) Peter Kaldveer and Associates, Inc. December 1981<br />
Foundation Investigation for Wendy's Restaurant; Pacheco, California (K845 - 1) Peter Kaldveer and Associates, Inc. October 1984<br />
CCR Geotechnical Investigation for Improvements to Taxiways E and J Kleinfelder and Associates, Inc. June 1987<br />
CCR<br />
CCR<br />
Geotechnical and Testing Services for Pavement Rehabilitation and Desgin of<br />
Taxiway E and Apron Construction Geotecnica August 1998<br />
Geotechnical Engineering Investigation <strong>Report</strong>, Buchanan Field <strong>Airport</strong>, Runway<br />
Rehabilitation Project Parikh Consultants, Inc. March 2011<br />
CCR Soils Engineering and Nondestructive Pavement Testing Kleinfelder and Associates, Inc. March 1986
Fugro Consultants, Inc.<br />
Project No. 04.79221200<br />
<strong>Airport</strong> <strong>Report</strong> Name <strong>Report</strong> Preparer <strong>Report</strong> Date<br />
CCR Soil and Pavement Investigation for Pavement Improvements Kleinfelder and Associates, Inc. August 1986<br />
LVK Livermore Municipal <strong>Airport</strong> Cornerstone Earth Group May 2010<br />
NUQ<br />
NUQ<br />
NUQ<br />
Foundation Investigation for Proposed Locker and Exercise Facility Moffett<br />
Field, California (K215 - 14) Peter Kaldveer and Associates, Inc. January 1980<br />
Foundation Investigation for Proposed Two-Story Locker and Exercise Facility<br />
Moffett Field, California (K215 -14A) Peter Kaldveer and Associates, Inc. April 1980<br />
Foundation Investigation for Building 191 Addition; Sunnyvale, California (K609<br />
- 2) Peter Kaldveer and Associates, Inc. July 1980<br />
NUQ Addition to Building N206; Moffett Field, California (K649 - 1) Peter Kaldveer and Associates, Inc. October 1980<br />
NUQ Earthquake Hazards Program U.S. Geological Survey June 2000<br />
NUQ<br />
Condition Assessment and Rehabilitation Plan, Hangar One, Volume 1,<br />
Conditional Assessment CH2M Hill November 2011<br />
OAK<br />
Maps and documentation of seismic CPT soundings in the central, eastern, and<br />
western United States U.S. Geological Survey 2010<br />
OAK<br />
Geotechnical Data and Coastal Conditions <strong>Report</strong> for Perimeter Dike, Oakland<br />
International <strong>Airport</strong>, Oakland, California URS Corporation May 2011<br />
OAK<br />
Technical Memorandum No. 2: Geotechnical Study Geotechnical Study for<br />
Runway Safety Areas, Oakland International <strong>Airport</strong> AGS April 2008<br />
OAK<br />
RSA Improvements, Oakland International<br />
<strong>Airport</strong>, South Field, Oakland, California URS Corporation December 2012<br />
OAK Geotechnical Data and Coastal Conditions <strong>Report</strong> URS Corporation November 2008<br />
OAK Draft Geotechnical Investigation and Site Characterization Data <strong>Report</strong> AGS October 2012<br />
SFO<br />
SFO<br />
Foundation Investigation Proposed Jet Engine Test Cell No. 5; San Francisco<br />
International <strong>Airport</strong>; For United Air Lines (San Francisco 196) Dames and Moore December 1974<br />
Foundation Investigation and Pavement Design Studies Proposed Trash<br />
Compactor Facility; San Francisco International <strong>Airport</strong>; For United Airlines (San<br />
Francisco 197) Brian, Kangas, Foulk, and Associates April 1980<br />
SFO<br />
Airfield Seismic Stabilization and Realignment, Phase A Engineering <strong>Report</strong> URS Corporation July 2006<br />
Notes:<br />
SFO: San Francisco International <strong>Airport</strong> OAK: Oakland International <strong>Airport</strong> CCR: Buchanan Field <strong>Airport</strong><br />
LVK: Livermore Municipal <strong>Airport</strong><br />
NUQ: Moffett Federal Airfield
Fugro Consultants, Inc.<br />
Project No. 04.79221200<br />
Descriptions modified from Witter et al. (2006)<br />
Appendix B<br />
Description of Geologic Units<br />
Artificial fill (historical)<br />
Map units: af, afem, alf, ads, acf, adf, gq<br />
Material deposited by humans. Additional types of artificial fill are mapped as separate geologic<br />
map units, including: artificial fill over estuarine mud (afem), artificial levee fill (alf), dredge spoils<br />
(ads), artificial channel fill (acf), artificial dam fill (adf), and gravel quarries and percolation ponds<br />
(gq). Fill may be engineered and/or non-engineered material; each may occur within the same<br />
area on the map. Fill whose thickness is less than the contour interval (typically 5 to 10 ft) and<br />
fill emplaced after the topographic base maps were surveyed are not shown. Small bodies of fill,<br />
such as small road embankments and earthen dams for farm ponds, are not shown. Included<br />
within this unit are small areas of Holocene alluvial deposits that are too small to be mapped at<br />
this scale.<br />
Artificial stream channel (historical)<br />
Map unit: ac<br />
Modified stream channels, including straightened or realigned channels, flood control channels,<br />
and concrete canals. Deposits within artificial channels can range from almost none in some<br />
concrete canals, to significant thicknesses of loose, unconsolidated sand, gravel and cobbles,<br />
similar to deposits of modern stream channel deposits (Qhc).<br />
Historical stream channel deposits<br />
Map unit; Qhc<br />
Fluvial deposits within active, natural stream channels. Materials consist of loose,<br />
unconsolidated, poorly to well sorted sand, gravel and cobbles, with minor silt and clay. These<br />
deposits are reworked by frequent flooding and exhibit no soil development. These deposits,<br />
like most other alluvial deposits, become finer grained downstream (i.e., sediment is coarser<br />
upstream).<br />
Latest Holocene alluvial fan deposits<br />
Map unit: Qhfy<br />
Alluvial fan sediment judged to be latest Holocene (
Fugro Consultants, Inc.<br />
Project No. 04.79221200<br />
moderately too poorly sorted and bedded, and may be composed of gravel, sand, silt and clay.<br />
Grain size generally fines down slope.<br />
Latest Holocene stream terrace deposits<br />
Map unit: Qhty<br />
Stream terrace deposits judged to be latest Holocene (
Fugro Consultants, Inc.<br />
Project No. 04.79221200<br />
(sand and occasional gravel). Deposits of coarse material within these fine-grained materials<br />
are elongated in the down fan or down valley direction. These lobes are potential conduits for<br />
groundwater flow.<br />
Holocene alluvial fan levee deposits<br />
Map unit: Qhl<br />
Natural levee deposits of alluvial fans are formed by streams that overtop their banks and<br />
deposit sediment adjacent to the channel. Levees are identified as long, low ridges oriented<br />
down fan. They contain coarser material than adjoining interlevee areas, especially adjacent to<br />
creek banks where the coarsest material is deposited during floods. Levee deposits are loose,<br />
moderately to well sorted sand, silt and clay.<br />
Holocene stream terrace deposits<br />
Map unit: Qht<br />
Stream terrace deposits that were deposited in point bar and overbank settings. Terrace<br />
deposits include sand, gravel, silt, and minor clay, and are moderately to well-sorted, and<br />
moderately to well bedded. This unit is mapped where relatively smooth, undissected terraces<br />
are less than 25 to thirty feet above the active channel.<br />
Holocene alluvial deposits, undifferentiated<br />
Map unit: Qha<br />
Alluvium deposited in fan, terrace, or basin environments. This unit is mapped where separate<br />
types of alluvial deposits could not be delineated either due to complex interfingering of<br />
depositional environments or the small size of the area. Typically, undifferentiated alluvial<br />
deposits are mapped in relatively flat, smooth valley bottoms along small- to medium-sized<br />
streams. The planar and smooth geomorphic surfaces, with little to no dissection, indicate that<br />
there has been little post-stabilization modification/dissection of the surface; thus, deposits with<br />
smooth surfaces are interpreted to be Holocene in age. Undifferentiated Holocene alluvial<br />
deposits probably are intercalated sand, silt, and gravel that are poorly to moderately sorted.<br />
Latest Pleistocene to Holocene dune sand<br />
Map Unit: Qds<br />
Very well sorted fine to medium grained eolian sand (
Fugro Consultants, Inc.<br />
Project No. 04.79221200<br />
Latest Pleistocene to Holocene alluvial fan deposits<br />
Map Unit: Qf<br />
This unit is mapped on gently sloping, fan-shaped, relatively undissected alluvial surfaces where<br />
the age of deposits is not known (either latest Pleistocene or Holocene in age) or where the<br />
deposits consist of thin patches of Holocene sediment overlying latest Pleistocene alluvial fan<br />
sediment. Fan sediment includes sand, gravel, silt, and clay, and is moderately to poorly sorted,<br />
and moderately to poorly bedded.<br />
Latest Pleistocene to Holocene stream terrace deposits<br />
Map Unit: Qt<br />
This unit is mapped on relatively flat, undissected stream terraces where deposit age is<br />
uncertain. Terrace deposits include sand, gravel, and silt, with minor clay, and are moderately to<br />
well sorted, and moderately to well bedded.<br />
Latest Pleistocene to Holocene alluvial deposits, undifferentiated<br />
Map Unit: Qa<br />
This unit is mapped in small valleys where separate fan, basin, and terrace units could not be<br />
delineated at the scale of this mapping, and where deposits might be of either latest Pleistocene<br />
or Holocene age. The unit includes flat, relatively undissected fan, terrace, and basin deposits,<br />
and small active stream channels.<br />
Latest Pleistocene alluvial fan deposits<br />
Map Unit: Qpf<br />
This unit is mapped on alluvial fans where latest Pleistocene age is indicated by greater<br />
dissection than is present on Holocene fans, and/or the development of alfisols. Latest<br />
Pleistocene alluvial fan sediment was deposited by streams emanating from mountain canyons<br />
onto alluvial valley floors or alluvial plains and includes debris flow, hyperconcentrated mudflow,<br />
and braided stream deposits. Alluvial fan sediment typically includes sand, gravel, silt, and clay,<br />
and is moderately to poorly sorted, and moderately to poorly bedded. Sediment clast size and<br />
general particle size decreases down slope from the fan apex. Latest Pleistocene alluvial fan<br />
sediment is approximately 10% denser than Holocene alluvial fan sediment and has penetration<br />
resistance values about 50% greater than values for Holocene alluvial fan sediment. Latest<br />
Pleistocene alluvial fans may be overlain by thin unmapped Holocene alluvial fan deposits.<br />
Where multiple alluvial fans are identified, the younger deposits (Qpf1) are distinguished from<br />
older deposits (Qpf2). Along the west-facing hills of Oakland and Berkeley, where the latest<br />
Pleistocene alluvial fan deposits are mapped, the age of these deposits is not well constrained<br />
and the deposits may actually be a combination of early to middle Pleistocene alluvial fan and<br />
thin pediment deposits, and latest Pleistocene alluvial fan deposits.<br />
Latest Pleistocene alluvial deposits, undifferentiated<br />
Map Unit: Qpa
Fugro Consultants, Inc.<br />
Project No. 04.79221200<br />
This unit is mapped on gently sloping to level alluvial fan or terrace surfaces where latest<br />
Pleistocene age is indicated by depth of stream incision, development of alfisols, and lack of<br />
historical flooding. Undifferentiated latest Pleistocene alluvial deposits are mapped in small<br />
valleys where separate fan, basin, and terrace units could not be delineated at the mapping<br />
scale of this project. These undifferentiated latest Pleistocene alluvial deposits probably are<br />
intercalated sand, silt, and gravel that are poorly to moderately sorted.<br />
Early to late Pleistocene alluvial deposits, undifferentiated<br />
Map unit: Qoa<br />
Moderately to deeply dissected alluvial deposits capped by alfisols, ultisols, or soils containing a<br />
silicic or calcic hardpan. Topography often consists of gently rolling hills with little or none of the<br />
original planar alluvial surface preserved.<br />
Early Quaternary and older (>1.4 Ma) deposits and bedrock, undifferentiated.<br />
Map unit: br<br />
Primarily Jurassic to Pliocene sedimentary, metamorphic, volcanic and plutonic rocks, and<br />
poorly consolidated Tertiary sediment. Also includes some Pliocene to Pleistocene sedimentary<br />
units such as the Glen Ellen Formation, Santa Clara Formation, Livermore gravels, and Merced<br />
Formations.
Fugro Consultants, Inc.<br />
Project No. 04.79221200<br />
Appendix C<br />
Subsurface Data Used in <strong>Liquefaction</strong> Analyses
Fugro Consultants, Inc.<br />
Project No. 04.79221200<br />
<strong>Airport</strong> 1 <strong>Report</strong> Preparer Exploration Year<br />
Borehole or<br />
CPT ID<br />
Total Depth<br />
(feet)<br />
Northing (UTM,<br />
meters)<br />
Easting (UTM,<br />
meters)<br />
Exploration<br />
Method 2<br />
OAK URS 2000 00GB-4 46.00 2088565.74 6058721.55 HSA<br />
OAK URS 2008 UB-3 60.00 2083113.20 6066571.78 HSA<br />
OAK URS 2008 UB-4 60.50 2081726.06 6065556.79 HSA<br />
OAK URS 2008 UB-5 40.00 2081997.28 6065859.80 HSA<br />
OAK URS 2008 UB-7 41.50 2083334.25 6063653.42 HSA<br />
OAK URS 2008 UB-8 40.00 2084690.49 6061991.56 HSA<br />
OAK URS 2008 UB-9 45.00 2086604.85 6060285.24 HSA<br />
OAK URS 2008 UB-10 60.50 2089311.94 6057083.82 HSA<br />
OAK URS 2011 11WL-2 41.50 2089744.07 6057080.88 HSA<br />
OAK URS 2011 11B-1 11.50 2082387.00 6066191.00 HSA<br />
OAK URS 2011 11B-3 19.00 2082816.82 6065070.88 HSA<br />
OAK URS 2011 11B-5 12.00 2084913.79 6062661.31 HSA<br />
OAK URS 2011 11B-7 12.00 2087010.77 6060264.77 HSA<br />
OAK URS 2011 11B-9 20.00 2089159.84 6057816.13 HSA<br />
OAK URS 2011 11GMB-10 10.50 2087424.08 6059544.45 HSA<br />
OAK URS 2011 11GMB-11 10.50 2087653.52 6059315.54 HSA<br />
OAK URS 2011 11GMB-12 10.50 2088022.22 6058911.53 HSA<br />
OAK URS 2011 11GMB-13 5.00 2088391.62 6058278.93 HSA<br />
OAK URS 2011 11GMB-14 13.50 2088781.06 6058055.66 HSA<br />
OAK URS 2011 11GMB-21 7.50 2088326.60 6058381.83 HSA<br />
OAK URS 2011 11GMB-22 16.50 2088253.96 6058443.56 HSA<br />
OAK URS 2011 11GMB-8 10.50 2086945.62 6060097.21 HSA
Fugro Consultants, Inc.<br />
Project No. 04.79221200<br />
<strong>Airport</strong> 1 <strong>Report</strong> Preparer Exploration Year<br />
Borehole or<br />
CPT ID<br />
Total Depth<br />
(feet)<br />
Northing (UTM,<br />
meters)<br />
Easting (UTM,<br />
meters)<br />
Exploration<br />
Method 2<br />
OAK URS 2011 11GMB-9 13.50 2087817.23 6059828.35 HSA<br />
OAK URS 2011 11GB-19 6.50 2089438.03 6057729.31 HSA<br />
OAK URS 2011 11GB-20 6.50 2089526.58 6057627.40 HSA<br />
OAK URS 2011 11WL-3 31.50 2082153.66 6066084.19 HSA<br />
OAK URS 2011 11WL-4 35.50 2082239.64 6066189.96 HSA<br />
OAK URS 2008 08B-1 11.50 2082390.00 6066103.00 HSA<br />
OAK URS 2008 08B-2 14.00 2082372.00 6065822.00 HSA<br />
OAK URS 2008 08B-3 19.00 2082814.00 6065015.00 HSA<br />
OAK URS 2008 08B-4 11.50 2084689.00 6063473.00 HSA<br />
OAK URS 2008 08B-5 12.00 2084913.00 6062608.00 HSA<br />
OAK URS 2008 08B-6 14.00 2086264.00 6061667.00 HSA<br />
OAK URS 2008 08B-7 12.00 2087014.00 6060201.00 HSA<br />
OAK URS 2008 08B-8 11.50 2088364.00 6059261.00 HSA<br />
OAK URS 2008 08B-9 20.00 2089115.00 6057797.00 HSA<br />
OAK URS 2008 08B-10 26.50 2092422.00 6062055.00 HSA<br />
OAK URS 2008 08B-11 11.50 2093040.00 6063137.00 HSA<br />
OAK URS 2008 08B-12 26.50 2092040.00 6063955.00 HSA<br />
OAK URS 2008 08B-13 11.50 2091439.00 6064349.00 HSA<br />
OAK URS 2008 08B-14 11.50 2093012.00 6064213.00 HSA<br />
OAK URS 2008 08B-15 13.35 2091822.00 6065979.00 HSA<br />
OAK URS 2008 08B-16 26.50 2091019.00 6066338.00 HSA<br />
OAK URS 2008 08B-17 11.50 2090339.00 6066914.00 HSA<br />
OAK URS 2008 08B-18 16.50 2091440.00 6067878.00 HSA
Fugro Consultants, Inc.<br />
Project No. 04.79221200<br />
<strong>Airport</strong> 1 <strong>Report</strong> Preparer Exploration Year<br />
Borehole or<br />
CPT ID<br />
Total Depth<br />
(feet)<br />
Northing (UTM,<br />
meters)<br />
Easting (UTM,<br />
meters)<br />
Exploration<br />
Method 2<br />
OAK URS 2008 08B-19 26.50 2090055.00 6068583.00 HSA<br />
OAK URS 2008 08B-20 16.50 2090407.00 6069279.00 HSA<br />
OAK URS 2008 08B-21 36.50 2089436.00 6068914.00 HSA<br />
SFO Fugro West 1999 99LB-01 242.00 2057196.00 6016704.00 RSB<br />
SFO Fugro West 1999 99LB-02 303.10 2056758.00 6021005.00 RSB<br />
SFO Fugro West 1999 99LB-03 227.00 2052496.00 6022797.00 RSB<br />
SFO Fugro West 1999 99LB-04 289.50 2050805.00 6021387.00 RSB<br />
SFO Fugro West 1999 99LB-05 287.00 2050741.00 6023834.00 RSB<br />
SFO Fugro West 1999 99LC-01 115.72 2056806.00 6016059.00 CPT<br />
SFO Fugro West 1999 99LC-02 130.00 2057417.00 6017334.00 CPT<br />
SFO Fugro West 1999 99LC-03 141.96 2056474.00 6020046.00 CPT<br />
SFO Fugro West 1999 99LC-04 116.00 2056121.00 6021567.00 CPT<br />
SFO Fugro West 1999 99LC-05 152.50 2052752.00 6022324.00 CPT<br />
SFO Fugro West 1999 99LC-06 125.40 2052223.00 6023284.00 CPT<br />
SFO Fugro West 1999 99LC-07 155.80 2050610.00 6021749.00 CPT<br />
SFO Fugro West 1999 99LC-08 144.30 2055992.00 6015855.00 CPT<br />
SFO Fugro West 1999 99LC-09 128.60 2055091.00 6017521.00 CPT<br />
SFO Fugro West 1999 99LC-10 150.90 2054404.00 6018771.00 CPT<br />
SFO Fugro West 1999 99LC-11 145.50 2055298.00 6019233.00 CPT<br />
SFO Fugro West 1999 99LC-12 150.75 2056578.00 6019596.00 CPT<br />
SFO Fugro West 1999 99LC-13 166.90 2055645.00 6020198.00 CPT<br />
SFO Fugro West 1999 99LC-14 172.00 2056506.00 6021477.00 CPT<br />
SFO Fugro West 1999 99LC-15 139.90 2054593.00 6020393.00 CPT
Fugro Consultants, Inc.<br />
Project No. 04.79221200<br />
<strong>Airport</strong> 1 <strong>Report</strong> Preparer Exploration Year<br />
Borehole or<br />
CPT ID<br />
Total Depth<br />
(feet)<br />
Northing (UTM,<br />
meters)<br />
Easting (UTM,<br />
meters)<br />
Exploration<br />
Method 2<br />
SFO Fugro West 1999 99LC-16 146.35 2053663.00 6021311.00 CPT<br />
SFO Fugro West 1999 99LC-17 147.80 2052715.00 6020259.00 CPT<br />
SFO Fugro West 1999 99LC-18 150.10 2051584.00 6022172.00 CPT<br />
SFO Fugro West 1999 99LC-19 152.00 2051214.00 6022839.00 CPT<br />
SFO Fugro West 1999 99LC-20 159.67 2051609.00 6024300.00 CPT<br />
SFO Fugro West 1999 99LC-21 134.40 2049749.00 6023289.00 CPT<br />
SFO Fugro West 1999 99LC-22 125.00 2059543.00 6016564.00 CPT<br />
SFO Fugro West 1999 99LC-23 131.70 2054987.00 6016158.00 CPT<br />
SFO Fugro West 1999 99LC-24 129.20 2055660.00 6016495.00 CPT<br />
SFO Fugro West 1999 99LC-25 144.80 2056504.00 6018959.00 CPT<br />
SFO Fugro West 1999 99LC-26 154.20 2056879.00 6018285.00 CPT<br />
SFO Fugro West 1999 99LC-27 134.00 2060991.00 6015852.00 CPT<br />
SFO Fugro West 2000 00LB-06 297.00 2057063.00 6017952.00 RSB<br />
SFO Fugro West 2000 00LB-07 280.00 2055884.00 6016648.00 RSB<br />
SFO Fugro West 2000 00LB-08 170.00 2053501.00 6021194.00 RSB<br />
SFO Fugro West 2000 00LB-09 256.00 2051433.00 6019113.00 RSB<br />
SFO Fugro West 2000 00LB-10 20.20 2056507.00 6018955.00 RSB<br />
SFO Fugro West 2000 00LB-11 19.50 2056876.00 6018290.00 RSB<br />
SFO Fugro West 2000 00LB-12 12.00 2056806.00 6015509.00 RSB<br />
SFO Fugro West 2000 00LB-13 253.00 2056228.00 6018691.00 RSB<br />
SFO Fugro West 2000 00LB-14 22.00 2056433.00 6021472.00 RSB<br />
SFO Fugro West 2000 00LB-15 222.50 2055775.00 6021418.00 RSB<br />
SFO Fugro West 2000 00LB-16 43.50 2055075.00 6021004.00 RSB
Fugro Consultants, Inc.<br />
Project No. 04.79221200<br />
<strong>Airport</strong> 1 <strong>Report</strong> Preparer Exploration Year<br />
Borehole or<br />
CPT ID<br />
Total Depth<br />
(feet)<br />
Northing (UTM,<br />
meters)<br />
Easting (UTM,<br />
meters)<br />
Exploration<br />
Method 2<br />
SFO Fugro West 2000 00LB-17 188.00 2053208.00 6019559.00 RSB<br />
SFO Fugro West 2000 00LB-18 25.50 2052710.00 6020260.00 RSB<br />
SFO Fugro West 2000 00LB-19 260.00 2049700.00 6018120.00 RSB<br />
SFO Fugro West 2000 00LB-20 19.50 2051470.00 6020240.00 RSB<br />
SFO Fugro West 2000 00LB-21 323.10 2051260.00 6020580.00 RSB<br />
SFO Fugro West 2000 00LB-22 252.50 2051911.00 6021767.00 RSB<br />
SFO Fugro West 2000 00LB-23 15.50 2052740.00 6022320.00 RSB<br />
SFO Fugro West 2000 00LB-24 280.00 2049920.00 6022890.00 RSB<br />
SFO Fugro West 2000 00LB-25 29.50 0.00 6020340.00 RSB<br />
SFO Fugro West 2000 00LB-26 24.50 0.00 6018650.00 RSB<br />
SFO Fugro West 2000 00LB-27 30.00 0.00 6018850.00 RSB<br />
SFO Fugro West 2000 00LC-28 104.80 2056855.00 6014245.00 CPT<br />
SFO Fugro West 2000 00LC-29 124.60 2055554.00 6015067.00 CPT<br />
SFO Fugro West 2000 00LC-30 157.80 2054249.00 6017437.00 CPT<br />
SFO Fugro West 2000 00LC-31 125.10 2053739.00 6018270.00 CPT<br />
SFO Fugro West 2000 00LC-32 157.10 2053406.00 6018955.00 CPT<br />
SFO Fugro West 2000 00LC-33 152.60 2054719.00 6019691.00 CPT<br />
SFO Fugro West 2000 00LC-34 164.80 2052178.00 6021171.00 CPT<br />
SFO Fugro West 2000 00LC-35 122.00 2053085.00 6017944.00 CPT<br />
SFO Fugro West 2000 00LC-36 91.30 2051449.00 6020207.00 CPT<br />
SFO Fugro West 2000 00LC-37 164.30 2051946.00 6017470.00 CPT<br />
SFO Fugro West 2000 00LC-38 121.80 2050453.00 6018537.00 CPT<br />
SFO Fugro West 2000 00LC-39 166.10 2052745.00 6018669.00 CPT
Fugro Consultants, Inc.<br />
Project No. 04.79221200<br />
<strong>Airport</strong> 1 <strong>Report</strong> Preparer Exploration Year<br />
Borehole or<br />
CPT ID<br />
Total Depth<br />
(feet)<br />
Northing (UTM,<br />
meters)<br />
Easting (UTM,<br />
meters)<br />
Exploration<br />
Method 2<br />
SFO Fugro West 2000 00LC-40 101.30 2056164.00 6015416.00 CPT<br />
SFO Fugro West 2000 00LC-41 165.80 2051916.00 6023021.00 CPT<br />
SFO Fugro West 2000 00LC-50 106.60 2056991.00 6014741.00 CPT<br />
SFO Fugro West 2000 00LC-51 96.10 2056299.10 6014858.80 CPT<br />
SFO Fugro West 2000 00LC-52 116.90 2054831.90 6015380.40 CPT<br />
SFO Fugro West 2000 00LC-53 145.10 2055557.00 6015667.80 CPT<br />
SFO Fugro West 2000 00LC-54 112.20 2056623.80 6017774.80 CPT<br />
SFO Fugro West 2000 00LC-55 138.30 2054109.70 6016681.50 CPT<br />
SFO Fugro West 2000 00LC-56 156.60 2054758.80 6016984.00 CPT<br />
SFO Fugro West 2000 00LC-57 134.10 2053420.70 6017391.70 CPT<br />
SFO Fugro West 2000 00LC-58 128.20 2054535.50 6018047.00 CPT<br />
SFO Fugro West 2000 00LC-59 142.00 2054992.60 6018751.70 CPT<br />
SFO Fugro West 2000 00LC-60 150.90 2056277.20 6019402.10 CPT<br />
SFO Fugro West 2000 00LC-61 157.70 2056009.90 6019840.70 CPT<br />
SFO Fugro West 2000 00LC-62 129.50 2052585.50 6017902.40 CPT<br />
SFO Fugro West 2000 00LC-63 135.80 2053802.90 6019447.90 CPT<br />
SFO Fugro West 2000 00LC-64 122.30 2055259.00 6020003.40 CPT<br />
SFO Fugro West 2000 00LC-65 132.80 2056217.60 6020626.00 CPT<br />
SFO Fugro West 2000 00LC-66 116.70 2048967.30 6017717.70 CPT<br />
SFO Fugro West 2000 00LC-67 134.70 2050552.10 6018170.40 CPT<br />
SFO Fugro West 2000 00LC-68 145.10 2051483.30 6018195.10 CPT<br />
SFO Fugro West 2000 00LC-69 121.60 2052078.50 6018524.20 CPT<br />
SFO Fugro West 2000 00LC-70 127.90 2050809.20 6018778.40 CPT
Fugro Consultants, Inc.<br />
Project No. 04.79221200<br />
<strong>Airport</strong> 1 <strong>Report</strong> Preparer Exploration Year<br />
Borehole or<br />
CPT ID<br />
Total Depth<br />
(feet)<br />
Northing (UTM,<br />
meters)<br />
Easting (UTM,<br />
meters)<br />
Exploration<br />
Method 2<br />
SFO Fugro West 2000 00LC-71 142.60 2051756.80 6019767.80 CPT<br />
SFO Fugro West 2000 00LC-72 158.30 2052260.70 6019463.50 CPT<br />
SFO Fugro West 2000 00LC-73 155.60 2052272.80 6019955.20 CPT<br />
SFO Fugro West 2000 00LC-74 150.30 2053894.40 6020453.30 CPT<br />
SFO Fugro West 2000 00LC-75 127.50 2054440.10 6020668.30 CPT<br />
SFO Fugro West 2000 00LC-76 128.20 2055074.20 6021001.40 CPT<br />
SFO Fugro West 2000 00LC-77 127.30 2055499.40 6020963.90 CPT<br />
SFO Fugro West 2000 00LC-78 158.30 2055376.10 6021179.80 CPT<br />
SFO Fugro West 2000 00LC-79 158.20 2052926.50 6020956.70 CPT<br />
SFO Fugro West 2000 00LC-80 157.90 2051019.60 6020923.10 CPT<br />
SFO Fugro West 2000 00LC-81 158.50 2051221.30 6021040.30 CPT<br />
SFO Fugro West 2000 00LC-82 158.60 2052845.40 6021497.80 CPT<br />
SFO Fugro West 2000 00LC-83 158.20 2053176.80 6021720.40 CPT<br />
SFO Fugro West 2000 00LC-84 131.50 2050328.60 6022113.10 CPT<br />
SFO Fugro West 2000 00LC-85 83.20 2052290.50 6022659.50 CPT<br />
SFO Fugro West 2000 00LC-86 126.00 2050126.50 6022484.20 CPT<br />
SFO Fugro West 2000 00LC-87 126.20 2050395.10 6023058.50 CPT<br />
SFO Fugro West 2000 00LC-88 154.90 2050976.40 6023273.50 CPT<br />
SFO Fugro West 2000 00LC-89 83.40 2051648.40 6023623.30 CPT<br />
SFO Fugro West 2000 00LC-90 151.20 2051982.00 6023843.30 CPT<br />
SFO Fugro West 2000 00LC-91 145.30 2050160.50 6023446.30 CPT<br />
SFO Fugro West 2000 00LC-92 155.30 2050796.20 6023617.70 CPT<br />
SFO Fugro West 2000 00LC-93 128.70 2051327.70 6024152.20 CPT
Fugro Consultants, Inc.<br />
Project No. 04.79221200<br />
<strong>Airport</strong> 1 <strong>Report</strong> Preparer Exploration Year<br />
Borehole or<br />
CPT ID<br />
Total Depth<br />
(feet)<br />
Northing (UTM,<br />
meters)<br />
Easting (UTM,<br />
meters)<br />
Exploration<br />
Method 2<br />
SFO Fugro West 2000 00LC-94 158.10 2053673.50 6020804.20 CPT<br />
NUQ USGS 2000 USC-01 42.98 1973719.09 6113257.49 CPT<br />
NUQ USGS 2000 USC-02 56.10 1975692.76 6112492.65 CPT<br />
NUQ USGS 2000 USC-03 59.55 1978442.74 6111423.49 CPT<br />
NUQ USGS 2000 USC-04 52.49 1980552.58 6110599.92 CPT<br />
NUQ USGS 2000 USC-05 49.54 1981223.01 6109340.75 CPT<br />
NUQ USGS 2000 USC-06 73.65 1973632.85 6111935.48 CPT<br />
NUQ USGS 2000 USC-07 52.00 1972649.71 6114827.75 CPT<br />
NUQ TetraTech 2005 TTC-01 61.00 1976530.08 6110055.58 CPT<br />
NUQ TetraTech 2005 TTC-02 61.00 1976700.85 6110072.11 CPT<br />
NUQ TetraTech 2005 TTC-03 61.00 1975962.65 6110452.22 CPT<br />
NUQ TetraTech 2005 TTC-04 61.00 1975937.86 6110642.28 CPT<br />
NUQ TetraTech 2005 TTC-05 61.00 1976249.12 6110361.33 CPT<br />
NUQ TetraTech 2005 TTC-06 61.00 1975915.83 6110336.54 CPT<br />
NUQ TetraTech 2005 TTC-07 61.00 1976059.06 6110427.43 CPT<br />
LVK Cornerstone Earth Group 2010 EB-1 10.00 2077874.00 6177354.00 HSA<br />
LVK Cornerstone Earth Group 2010 EB-2 10.00 2077828.00 6178562.00 HSA<br />
LVK Cornerstone Earth Group 2010 EB-3 10.00 2077846.00 6179690.00 HSA<br />
LVK Cornerstone Earth Group 2010 EB-4 10.00 2077755.00 6181112.00 HSA<br />
LVK Cornerstone Earth Group 2010 EB-5 11.00 2077765.00 6182100.00 HSA<br />
LVK Cornerstone Earth Group 2010 EB-6 10.00 2078213.00 6182291.00 HSA<br />
LVK Cornerstone Earth Group 2010 EB-7 10.00 2078176.00 6182047.00 HSA<br />
LVK Cornerstone Earth Group 2010 EB-8 10.00 2078186.00 6181776.00 HSA
Fugro Consultants, Inc.<br />
Project No. 04.79221200<br />
<strong>Airport</strong> 1 <strong>Report</strong> Preparer Exploration Year<br />
Borehole or<br />
CPT ID<br />
Total Depth<br />
(feet)<br />
Northing (UTM,<br />
meters)<br />
Easting (UTM,<br />
meters)<br />
Exploration<br />
Method 2<br />
CCR Kleinfelder and Associates, Inc. 1987 KL87-16 8.00 2185492.00 6113366.00 HSA<br />
CCR Kleinfelder and Associates, Inc. 1987 KL87-20 8.00 2184109.00 6111533.00 HSA<br />
CCR Kleinfelder and Associates, Inc. 1987 KL87-21 6.00 2184684.00 6111555.00 HSA<br />
CCR Kleinfelder and Associates, Inc. 1987 KL87-22 8.00 2185226.00 6111831.00 HSA<br />
CCR Kleinfelder and Associates, Inc. 1987 KL87-25 6.50 2185702.00 6112018.00 HSA<br />
CCR Kleinfelder and Associates, Inc. 1987 KL87-26 8.00 2186241.00 6112266.00 HSA<br />
CCR Kleinfelder and Associates, Inc. 1987 KL87-28 6.00 2186743.00 6112504.00 HSA<br />
CCR Kleinfelder and Associates, Inc. 1987 KL87-29 8.00 2186582.00 6112793.00 HSA<br />
CCR Kleinfelder and Associates, Inc. 1987 KL87-30 8.00 2187224.00 6112526.00 HSA<br />
CCR Kleinfelder and Associates, Inc. 1987 KL87-44 7.50 2187746.00 6112339.00 HSA<br />
CCR Kleinfelder and Associates, Inc. 1987 KL87-45 7.50 2188239.00 6112115.00 HSA<br />
CCR Kleinfelder and Associates, Inc. 1987 KL87-46 7.50 2188745.00 6111890.00 HSA<br />
CCR Kleinfelder and Associates, Inc. 1987 KL87-47 7.50 2188931.00 6112267.00 HSA<br />
CCR Kleinfelder and Associates, Inc. 1987 KL87-51 8.00 2188179.00 6112965.00 HSA<br />
CCR Kleinfelder and Associates, Inc. 1987 KL87-52 8.00 2187655.00 6113128.00 HSA<br />
CCR Kleinfelder and Associates, Inc. 1987 KL87-55 8.00 2187386.00 6112768.00 HSA<br />
CCR Kleinfelder and Associates, Inc. 1987 KL87-76 6.50 2187738.00 6113549.00 HSA<br />
CCR Kleinfelder and Associates, Inc. 1987 KL87-87 9.00 2187104.00 6112646.00 HSA<br />
CCR Kleinfelder and Associates, Inc. 1987 KL87-88 9.50 2186101.00 6113017.00 HSA<br />
CCR Parikh Consultants, Inc. 2011 PRK11-1 7.00 2183956.00 6111815.00 HSA<br />
CCR Parikh Consultants, Inc. 2011 PRK11-2 7.00 2184733.00 6112081.00 HSA<br />
CCR Parikh Consultants, Inc. 2011 PRK11-3 7.00 2185397.00 6112506.00 HSA<br />
CCR Parikh Consultants, Inc. 2011 PRK11-4 7.50 2185967.00 6112643.00 HSA
Fugro Consultants, Inc.<br />
Project No. 04.79221200<br />
<strong>Airport</strong> 1 <strong>Report</strong> Preparer Exploration Year<br />
Borehole or<br />
CPT ID<br />
Total Depth<br />
(feet)<br />
Northing (UTM,<br />
meters)<br />
Easting (UTM,<br />
meters)<br />
Exploration<br />
Method 2<br />
CCR Parikh Consultants, Inc. 2011 PRK11-5 7.00 2186629.00 6113022.00 HSA<br />
CCR Parikh Consultants, Inc. 2011 PRK11-6 7.00 2187326.00 6113282.00 HSA<br />
CCR Parikh Consultants, Inc. 2011 PRK11-7 7.00 2188052.00 6113640.00 HSA<br />
CCR Parikh Consultants, Inc. 2011 PRK11-8 7.00 2188245.00 6113680.00 HSA<br />
CCR Peter Kaldveer and Associates, Inc. 1990 KA90-1 31.50 2188088.00 6111994.00 HSA<br />
CCR Peter Kaldveer and Associates, Inc. 1990 KA90-2 21.50 2187932.00 6111995.00 HSA<br />
CCR Peter Kaldveer and Associates, Inc. 1990 KA90-3 23.50 2187934.00 6111866.00 HSA<br />
CCR Peter Kaldveer and Associates, Inc. 1990 KA90-4 5.00 2187877.00 6111891.00 HSA<br />
CCR Peter Kaldveer and Associates, Inc. 1990 KA90-5 5.00 2188017.00 6112044.00 HSA<br />
CCR Peter Kaldveer and Associates, Inc. 1990 KA90-6 6.00 2188136.00 6111923.00 HSA<br />
CCR Peter Kaldveer and Associates, Inc. 1983 KA83-1 30.00 2184653.00 6110756.00 HSA<br />
CCR Peter Kaldveer and Associates, Inc. 1983 KA83-2 30.00 2184789.00 6110688.00 HSA<br />
CCR Peter Kaldveer and Associates, Inc. 1983 KA83-3 23.50 2184820.00 6110816.00 HSA<br />
CCR Peter Kaldveer and Associates, Inc. 1983 KA83-PB2 25.00 2184745.00 6110806.00 HSA<br />
CCR Peter Kaldveer and Associates, Inc. 1983 KA83-PB4 25.00 2184563.00 6110830.00 HSA<br />
CCR Peter Kaldveer and Associates, Inc. 1983 KA83-PB5 30.00 2184609.00 6110698.00 HSA<br />
CCR Peter Kaldveer and Associates, Inc. 1983 KA83-PP1 20.00 2184728.00 6110680.00 HSA<br />
CCR Peter Kaldveer and Associates, Inc. 1983 KA83-PP3 20.00 2184656.00 6110817.00 HSA<br />
CCR Peter Kaldveer and Associates, Inc. 1983 KA83-PP4 20.00 2184510.00 6110709.00 HSA<br />
CCR Peter Kaldveer and Associates, Inc. 1981 KA81-1 10.00 2189182.00 6111721.00 HSA<br />
CCR Peter Kaldveer and Associates, Inc. 1981 KA81-2 40.00 2188718.00 6111794.00 HSA<br />
CCR Peter Kaldveer and Associates, Inc. 1981 KA81-3 50.00 2188550.00 6111908.00 HSA<br />
CCR Peter Kaldveer and Associates, Inc. 1981 KA81-4 38.00 2188717.00 6111597.00 HSA
Fugro Consultants, Inc.<br />
Project No. 04.79221200<br />
<strong>Airport</strong> 1 <strong>Report</strong> Preparer Exploration Year<br />
Borehole or<br />
CPT ID<br />
Total Depth<br />
(feet)<br />
Northing (UTM,<br />
meters)<br />
Easting (UTM,<br />
meters)<br />
Exploration<br />
Method 2<br />
Notes:<br />
CCR Peter Kaldveer and Associates, Inc. 1981 KA81-5 50.00 2188713.00 6111375.00 HSA<br />
CCR Peter Kaldveer and Associates, Inc. 1981 KA81-6 40.00 2188540.00 6111374.00 HSA<br />
CCR Peter Kaldveer and Associates, Inc. 1981 KA81-7 30.50 2188545.00 6111636.00 HSA<br />
CCR Peter Kaldveer and Associates, Inc. 1981 KA81-8 20.00 2188628.00 6111481.00 HSA<br />
CCR Peter Kaldveer and Associates, Inc. 1981 KA81-9 20.00 2188520.00 6111444.00 HSA<br />
CCR Peter Kaldveer and Associates, Inc. 1981 KA81-101 25.00 2189169.00 6113316.00 HSA<br />
CCR Peter Kaldveer and Associates, Inc. 1981 KA81-102 50.00 2188829.00 6113114.00 HSA<br />
CCR Peter Kaldveer and Associates, Inc. 1981 KA81-103 50.00 2189325.00 6113039.00 HSA<br />
CCR Peter Kaldveer and Associates, Inc. 1981 KA81-104 48.50 2189778.00 6113005.00 HSA<br />
CCR Peter Kaldveer and Associates, Inc. 1981 KA81-105 25.00 2189623.00 6112724.00 HSA<br />
CCR Peter Kaldveer and Associates, Inc. 1983 KA83-101 25.00 2188023.00 6111946.00 HSA<br />
CCR Peter Kaldveer and Associates, Inc. 1983 KA83-102 20.00 2187964.00 6111978.00 HSA<br />
CCR Peter Kaldveer and Associates, Inc. 1983 KA83-103 20.00 2188033.00 6112021.00 HSA<br />
CCR Peter Kaldveer and Associates, Inc. 1983 KA83-A1 15.00 2188114.00 6111720.00 HSA<br />
CCR Peter Kaldveer and Associates, Inc. 1983 KA83-A2 20.00 2187987.00 6111767.00 HSA<br />
CCR Peter Kaldveer and Associates, Inc. 1983 KA83-A3 20.00 2187986.00 6111674.00 HSA<br />
1. SFO: San Francisco International <strong>Airport</strong> 2. HAS: Hollow Stem Auger<br />
OAK: Oakland International <strong>Airport</strong><br />
RSB: Rotary Sample Boring (Wet)<br />
CCR: Buchanan Field <strong>Airport</strong><br />
CPT: Cone Penetrometer Test<br />
LVK: Livermore Municipal <strong>Airport</strong><br />
NUQ: Moffett Federal Airfield
Fugro Consultants, Inc.<br />
Project No. 04.79221200<br />
Appendix D<br />
<strong>Liquefaction</strong> Analyses<br />
LIST OF FIGURES<br />
Figures DA-1 through DA-5<br />
Figures DB-1 through DB-8<br />
Figures DC-1 through DB-8<br />
Figures DD-1 through DB-8<br />
Figures DE-1 through DB-2<br />
Figures DF-1 through DF-8<br />
USGS PDA Data, All <strong>Airport</strong>s<br />
Geotechnical Data and <strong>Liquefaction</strong> <strong>Analysis</strong> Results,<br />
San Francisco International <strong>Airport</strong><br />
Geotechnical Data and <strong>Liquefaction</strong> <strong>Analysis</strong> Results,<br />
Oakland International <strong>Airport</strong><br />
Geotechnical Data and <strong>Liquefaction</strong> <strong>Analysis</strong> Results,<br />
Moffett Field <strong>Airport</strong><br />
Geotechnical Data,<br />
Livermore Municipal <strong>Airport</strong><br />
Geotechnical Data and <strong>Liquefaction</strong> <strong>Analysis</strong> Results,<br />
Moffett Federal Airfield
Fugro Consultants, Inc.<br />
Project No. 04.79221200 <strong>ABAG</strong><br />
6010000<br />
6015000<br />
6020000<br />
6025000<br />
Legend<br />
Peak Ground Acceleration<br />
2060000<br />
40.28<br />
36.92<br />
36.4<br />
2060000<br />
N:\Projects\04_2012\04_7922_1200_Caltrans<strong>Airport</strong>Recov\Outputs\2013_03_05_<strong>Report</strong>\mxd\Fig_DA01a_SFO_PGA_1906Scenario.mxd, 03/21/13, dpollard<br />
2055000<br />
2050000<br />
6010000<br />
48.4<br />
6015000<br />
40.78<br />
6020000<br />
6025000<br />
36.83<br />
2055000<br />
2050000<br />
Coordinate Grid: CA State Plane, Zone 3,<br />
NAD83, Feet<br />
Ü1:18,005<br />
0 750 1,500 3,000<br />
Feet<br />
1906 San Francisco Earthquake Scenario<br />
(USGS PGA Data)<br />
San Francisco International <strong>Airport</strong><br />
San Francisco, California<br />
FIGURE DA-1a
6025000<br />
Legend<br />
Peak Ground Acceleration<br />
2060000<br />
6010000<br />
6010000<br />
6015000<br />
6015000<br />
25.94<br />
6020000<br />
6020000<br />
Coordinate Grid: CA State Plane, Zone 3,<br />
NAD83, Feet<br />
26.59<br />
6025000<br />
2050000<br />
2050000<br />
2055000<br />
2055000<br />
Ü<br />
1:18,005<br />
Fugro Consultants, Inc.<br />
Project No. 04.79221200 <strong>ABAG</strong><br />
0 750 1,500 3,000<br />
Feet<br />
Hayward-Rodgers Creek Scenario<br />
(USGS PGA Data)<br />
San Francisco International <strong>Airport</strong><br />
San Francisco, California<br />
FIGURE DA-1b<br />
2060000<br />
N:\Projects\04_2012\04_7922_1200_Caltrans<strong>Airport</strong>Recov\Outputs\2013_03_05_<strong>Report</strong>\mxd\Fig_DA01b_SFO_PGA_HRCScenario.mxd, 03/21/13, dpollard
6025000<br />
Legend<br />
Peak Ground Acceleration<br />
2060000<br />
14.5<br />
15.04<br />
6010000<br />
6010000<br />
13.73<br />
6015000<br />
6015000<br />
6020000<br />
Coordinate Grid: CA State Plane, Zone 3,<br />
NAD83, Feet<br />
6020000<br />
6025000<br />
2050000<br />
2050000<br />
2055000<br />
2055000<br />
Ü<br />
1:18,005<br />
Fugro Consultants, Inc.<br />
Project No. 04.79221200 <strong>ABAG</strong><br />
0 750 1,500 3,000<br />
Feet<br />
Concord-Green Valley Scenario<br />
(USGS PGA Data)<br />
San Francisco International <strong>Airport</strong><br />
San Francisco, California<br />
FIGURE DA-1c<br />
2060000<br />
N:\Projects\04_2012\04_7922_1200_Caltrans<strong>Airport</strong>Recov\Outputs\2013_03_05_<strong>Report</strong>\mxd\Fig_DA01c_SFO_PGA_CGVScenario.mxd, 03/21/13, dpollard
Fugro Consultants, Inc.<br />
Project No. 04.79221200 <strong>ABAG</strong><br />
6055000<br />
6060000<br />
6065000<br />
6070000<br />
Legend<br />
Peak Ground Acceleration<br />
N:\Projects\04_2012\04_7922_1200_Caltrans<strong>Airport</strong>Recov\Outputs\2013_03_05_<strong>Report</strong>\mxd\Fig_DA02a_OAK_PGA_1906Scenario.mxd, 03/21/13, dpollard<br />
2085000<br />
2090000<br />
2090000<br />
6055000<br />
32.99<br />
6060000<br />
31.89<br />
6065000<br />
31.26<br />
6070000<br />
2085000<br />
Coordinate Grid: CA State Plane, Zone 3,<br />
NAD83, Feet<br />
Ü1:18,005<br />
0 750 1,500 3,000<br />
Feet<br />
1906 San Francisco Earthquake Scenario<br />
(USGS PGA Data)<br />
Oakland International <strong>Airport</strong><br />
Oakland, California<br />
FIGURE DA-2a
Fugro Consultants, Inc.<br />
Project No. 04.79221200 <strong>ABAG</strong><br />
6055000<br />
6060000<br />
6065000<br />
6070000<br />
Legend<br />
Peak Ground Acceleration<br />
N:\Projects\04_2012\04_7922_1200_Caltrans<strong>Airport</strong>Recov\Outputs\2013_03_05_<strong>Report</strong>\mxd\Fig_DA02b_OAK_PGA_HRCScenario.mxd, 03/21/13, dpollard<br />
2085000<br />
2090000<br />
2090000<br />
6055000<br />
34.52<br />
6060000<br />
6065000<br />
35.66<br />
6070000<br />
2085000<br />
Coordinate Grid: CA State Plane, Zone 3,<br />
NAD83, Feet<br />
Ü1:18,005<br />
0 750 1,500 3,000<br />
Feet<br />
Hayward-Rodgers Creek Scenario<br />
(USGS PGA Data)<br />
Oakland International <strong>Airport</strong><br />
Oakland, California<br />
FIGURE DA-2b
Fugro Consultants, Inc.<br />
Project No. 04.79221200 <strong>ABAG</strong><br />
6055000<br />
6060000<br />
6065000<br />
6070000<br />
Legend<br />
Peak Ground Acceleration<br />
19.96<br />
20.6<br />
17.55<br />
N:\Projects\04_2012\04_7922_1200_Caltrans<strong>Airport</strong>Recov\Outputs\2013_03_05_<strong>Report</strong>\mxd\Fig_DA02c_OAK_PGA_CGVScenario.mxd, 03/21/13, dpollard<br />
2085000<br />
2090000<br />
2090000<br />
6055000<br />
19.83<br />
6060000<br />
20.27<br />
6065000<br />
6070000<br />
16.75<br />
2085000<br />
Coordinate Grid: CA State Plane, Zone 3,<br />
NAD83, Feet<br />
Ü1:18,005<br />
0 750 1,500 3,000<br />
Feet<br />
Concord-Green Valley Scenario<br />
(USGS PGA Data)<br />
Oakland International <strong>Airport</strong><br />
Oakland, California<br />
FIGURE DA-2c
6118000<br />
Legend<br />
Peak Ground Acceleration<br />
2190000<br />
2188000<br />
Coordinate Grid: CA State Plane, Zone 3,<br />
NAD83, Feet<br />
Ü<br />
1:12,003<br />
2186000<br />
2184000<br />
Fugro Consultants, Inc.<br />
Project No. 04.79221200 <strong>ABAG</strong><br />
6108000<br />
15.3<br />
6108000<br />
6110000<br />
6110000<br />
6112000<br />
6112000<br />
6114000<br />
6114000<br />
14.87<br />
6116000<br />
0 500 1,000 2,000<br />
Feet<br />
6116000<br />
1906 San Francisco Earthquake Scenario<br />
(USGS PGA Data)<br />
Buchanan <strong>Airport</strong><br />
Concord, California<br />
FIGURE DA-3a<br />
6118000<br />
N:\Projects\04_2012\04_7922_1200_Caltrans<strong>Airport</strong>Recov\Outputs\2013_03_05_<strong>Report</strong>\mxd\Fig_DA03a_BUC_PGA_1906Scenario.mxd, 03/21/13, dpollard<br />
2184000<br />
2186000<br />
2188000<br />
2190000
6118000<br />
Legend<br />
Peak Ground Acceleration<br />
2190000<br />
2188000<br />
Coordinate Grid: CA State Plane, Zone 3,<br />
NAD83, Feet<br />
Ü<br />
1:12,003<br />
2186000<br />
2184000<br />
Fugro Consultants, Inc.<br />
Project No. 04.79221200 <strong>ABAG</strong><br />
6108000<br />
6108000<br />
6110000<br />
6110000<br />
6112000<br />
23.89<br />
6112000<br />
6114000<br />
6114000<br />
6116000<br />
0 500 1,000 2,000<br />
Feet<br />
6116000<br />
Hayward-Rodgers Creek Scenario<br />
(USGS PGA Data)<br />
Buchanan <strong>Airport</strong><br />
Concord, California<br />
FIGURE DA-3b<br />
6118000<br />
N:\Projects\04_2012\04_7922_1200_Caltrans<strong>Airport</strong>Recov\Outputs\2013_03_05_<strong>Report</strong>\mxd\Fig_DA03b_BUC_PGA_HRCScenario.mxd, 03/21/13, dpollard<br />
2184000<br />
2186000<br />
2188000<br />
2190000
6118000<br />
Legend<br />
Peak Ground Acceleration<br />
52.25<br />
2190000<br />
2188000<br />
Coordinate Grid: CA State Plane, Zone 3,<br />
NAD83, Feet<br />
Ü<br />
1:12,003<br />
2186000<br />
2184000<br />
Fugro Consultants, Inc.<br />
Project No. 04.79221200 <strong>ABAG</strong><br />
6108000<br />
6108000<br />
6110000<br />
47.24<br />
6110000<br />
6112000<br />
6112000<br />
6114000<br />
6114000<br />
6116000<br />
0 500 1,000 2,000<br />
Feet<br />
6116000<br />
Concord-Green Valley Scenario<br />
(USGS PGA Data)<br />
Buchanan <strong>Airport</strong><br />
Concord, California<br />
FIGURE DA-3c<br />
6118000<br />
N:\Projects\04_2012\04_7922_1200_Caltrans<strong>Airport</strong>Recov\Outputs\2013_03_05_<strong>Report</strong>\mxd\Fig_DA03c_BUC_PGA_CGVScenario.mxd, 03/21/13, dpollard<br />
2184000<br />
2186000<br />
2188000<br />
2190000
6186000<br />
Legend<br />
Peak Ground Acceleration<br />
2082000<br />
2080000<br />
Coordinates System: CA State Plane,<br />
Zone 3, NAD83, Feet<br />
2078000<br />
Ü<br />
1:12,003<br />
2076000<br />
14.7<br />
2074000<br />
Fugro Consultants, Inc.<br />
Project No. 04.79221200 <strong>ABAG</strong><br />
6176000<br />
6176000<br />
6178000<br />
6178000<br />
17.35<br />
6180000<br />
6180000<br />
6182000<br />
6182000<br />
6184000<br />
0 500 1,000 2,000<br />
Feet<br />
6184000<br />
1906 San Francisco Earthquake Scenario<br />
(USGS PGA Data)<br />
Livermore <strong>Airport</strong><br />
Livermore, California<br />
FIGURE DA-4a<br />
6186000<br />
N:\Projects\04_2012\04_7922_1200_Caltrans<strong>Airport</strong>Recov\Outputs\2013_03_05_<strong>Report</strong>\mxd\Fig_DA04a_LIV_PGA_1906Scenario.mxd, 03/21/13, dpollard<br />
2074000<br />
2076000<br />
2078000<br />
2080000<br />
2082000
6186000<br />
Legend<br />
Peak Ground Acceleration<br />
2082000<br />
2080000<br />
Coordinates System: CA State Plane,<br />
Zone 3, NAD83, Feet<br />
2078000<br />
Ü<br />
1:12,003<br />
2076000<br />
2074000<br />
Fugro Consultants, Inc.<br />
Project No. 04.79221200 <strong>ABAG</strong><br />
6176000<br />
25.28<br />
6176000<br />
6178000<br />
6178000<br />
6180000<br />
6180000<br />
6182000<br />
6182000<br />
24.29<br />
6184000<br />
0 500 1,000 2,000<br />
Feet<br />
6184000<br />
Hayward-Rodgers Creek Scenario<br />
(USGS PGA Data)<br />
Livermore <strong>Airport</strong><br />
Livermore, California<br />
FIGURE DA-4b<br />
6186000<br />
N:\Projects\04_2012\04_7922_1200_Caltrans<strong>Airport</strong>Recov\Outputs\2013_03_05_<strong>Report</strong>\mxd\Fig_DA04b_LIV_PGA_HRCScenario.mxd, 03/21/13, dpollard<br />
2074000<br />
2076000<br />
2078000<br />
2080000<br />
2082000
6186000<br />
Legend<br />
Peak Ground Acceleration<br />
2082000<br />
2080000<br />
Coordinates System: CA State Plane,<br />
Zone 3, NAD83, Feet<br />
2078000<br />
Ü<br />
1:12,003<br />
2076000<br />
2074000<br />
Fugro Consultants, Inc.<br />
Project No. 04.79221200 <strong>ABAG</strong><br />
6176000<br />
6176000<br />
6178000<br />
6178000<br />
6180000<br />
14.75<br />
6180000<br />
6182000<br />
6182000<br />
6184000<br />
0 500 1,000 2,000<br />
Feet<br />
6184000<br />
Concord-Green Valley Scenario<br />
(USGS PGA Data)<br />
Livermore <strong>Airport</strong><br />
Livermore, California<br />
FIGURE DA-4c<br />
6186000<br />
N:\Projects\04_2012\04_7922_1200_Caltrans<strong>Airport</strong>Recov\Outputs\2013_03_05_<strong>Report</strong>\mxd\Fig_DA04c_LIV_PGA_CGVScenario.mxd, 03/21/13, dpollard<br />
2074000<br />
2076000<br />
2078000<br />
2080000<br />
2082000
Fugro Consultants, Inc.<br />
Project No. 04.79221200 <strong>ABAG</strong><br />
6105000<br />
6110000<br />
6115000<br />
6120000<br />
Legend<br />
Peak Ground Acceleration<br />
N:\Projects\04_2012\04_7922_1200_Caltrans<strong>Airport</strong>Recov\Outputs\2013_03_05_<strong>Report</strong>\mxd\Fig_DA05a_MOF_PGA_1906Scenario.mxd, 03/21/13, dpollard<br />
1980000<br />
1975000<br />
1980000<br />
32.25<br />
6105000<br />
6110000<br />
31.22<br />
6115000<br />
30.36<br />
6120000<br />
1975000<br />
Coordinate Grid: CA State Plane, Zone 3,<br />
NAD83, Feet<br />
Ü1:18,005<br />
0 750 1,500 3,000<br />
Feet<br />
1906 San Francisco Earthquake Scenario<br />
(USGS PGA Data)<br />
Moffett Federal Airfield<br />
Mountain View, California<br />
FIGURE DA-5a
Fugro Consultants, Inc.<br />
Project No. 04.79221200 <strong>ABAG</strong><br />
6105000<br />
6110000<br />
6115000<br />
6120000<br />
Legend<br />
Peak Ground Acceleration<br />
N:\Projects\04_2012\04_7922_1200_Caltrans<strong>Airport</strong>Recov\Outputs\2013_03_05_<strong>Report</strong>\mxd\Fig_DA05b_MOF_PGA_HRCScenario.mxd, 03/21/13, dpollard<br />
1980000<br />
1975000<br />
1980000<br />
32.25<br />
6105000<br />
6110000<br />
31.22<br />
6115000<br />
30.36<br />
6120000<br />
1975000<br />
Coordinate Grid: CA State Plane, Zone 3,<br />
NAD83, Feet<br />
Ü1:18,005<br />
0 750 1,500 3,000<br />
Feet<br />
Hayward-Rodgers Creek Scenario<br />
(USGS PGA Data)<br />
Moffett Federal Airfield<br />
Mountain View, California<br />
FIGURE DA-5b
Fugro Consultants, Inc.<br />
Project No. 04.79221200 <strong>ABAG</strong><br />
6105000<br />
6110000<br />
6115000<br />
6120000<br />
Legend<br />
Peak Ground Acceleration<br />
9.73<br />
9.77<br />
12.14<br />
N:\Projects\04_2012\04_7922_1200_Caltrans<strong>Airport</strong>Recov\Outputs\2013_03_05_<strong>Report</strong>\mxd\Fig_DA05c_MOF_PGA_CGVCScenarioy.mxd, 03/21/13, dpollard<br />
1980000<br />
1975000<br />
1980000<br />
6105000<br />
9.22<br />
6110000<br />
9.25<br />
6115000<br />
6120000<br />
9.27<br />
1975000<br />
Coordinate Grid: CA State Plane, Zone 3,<br />
NAD83, Feet<br />
Ü1:18,005<br />
0 750 1,500 3,000<br />
Feet<br />
Concord-Green Valley Scenario<br />
(USGS PGA Data)<br />
Moffett Federal Airfield<br />
Mountain View, California<br />
FIGURE DA-5c
Fugro Consultants, Inc.<br />
Project No. 04.79221200 <strong>ABAG</strong><br />
6010000<br />
6015000<br />
6020000<br />
6025000<br />
99LC-27<br />
#V<br />
Legend<br />
#V<br />
Fugro CPT, Phase 1, 1999<br />
2060000<br />
99LC-22<br />
#V<br />
2060000<br />
#V<br />
#V<br />
Fugro CPT, 2000, Phase 2<br />
Fugro CPT, 2000, Phase 3<br />
Cross Section Location<br />
Coordinates System: CA State Plane,<br />
Zone 3, NAD83, Feet<br />
99LC-02<br />
N:\Projects\04_2012\04_7922_1200_Caltrans<strong>Airport</strong>Recov\Outputs\2013_03_05_<strong>Report</strong>\mxd\Fig_DB01_SFO_ExplorationLocationMap.mxd, 03/21/13, dpollard<br />
2055000<br />
2050000<br />
6010000<br />
A<br />
B<br />
00LC-28<br />
#V<br />
00LC-50<br />
#V<br />
00LC-51<br />
#V<br />
00LC-29<br />
00LC-40<br />
#V<br />
#V<br />
#V<br />
#V<br />
#V<br />
00LC-53<br />
00LC-52<br />
#V<br />
99LC-01<br />
99LC-08<br />
99LC-23<br />
#V<br />
99LC-24<br />
#V<br />
00LC-56<br />
#V<br />
#V<br />
00LC-55<br />
00LC-37<br />
C'<br />
D'<br />
#V<br />
#V<br />
#V<br />
#V<br />
#V<br />
#V<br />
00LC-58<br />
00LC-30<br />
00LC-62<br />
00LC-54<br />
99LC-09<br />
00LC-57<br />
00LC-35<br />
#V<br />
#V<br />
#V<br />
00LC-67<br />
00LC-66<br />
#V<br />
#V<br />
#V<br />
00LC-68<br />
#V<br />
99LC-26<br />
#V<br />
#V #V<br />
#V<br />
#V<br />
#V<br />
#V<br />
#V<br />
99LC-25<br />
00LC-60<br />
00LC-61<br />
99LC-10<br />
00LC-31<br />
00LC-59<br />
00LC-69<br />
#V<br />
#V<br />
00LC-32<br />
00LC-39<br />
#V<br />
#V<br />
#V<br />
#V<br />
#V<br />
#V<br />
00LC-63<br />
00LC-71<br />
00LC-70<br />
00LC-38<br />
99LC-12<br />
99LC-11<br />
00LC-72<br />
#V<br />
#V<br />
#V<br />
#V<br />
#V<br />
#V<br />
#V<br />
C<br />
D<br />
#V<br />
#V<br />
#V<br />
00LC-65<br />
99LC-13<br />
00LC-64<br />
00LC-33<br />
00LC-36<br />
99LC-03<br />
#V<br />
#V<br />
#V<br />
#V<br />
#V<br />
#V<br />
#V<br />
#V<br />
#V<br />
#V<br />
#V<br />
#V<br />
00LC-74<br />
00LC-94 99LC-16<br />
00LC-73<br />
00LC-81<br />
00LC-77<br />
00LC-78<br />
00LC-76<br />
99LC-15<br />
00LC-75<br />
00LC-79<br />
99LC-17<br />
00LC-82<br />
00LC-80<br />
00LC-34<br />
00LC-83<br />
#V<br />
99LC-07<br />
99LC-14<br />
99LC-04<br />
#V<br />
99LC-18<br />
#V<br />
00LC-84<br />
99LC-05<br />
#V<br />
#V<br />
#V<br />
00LC-86<br />
00LC-85<br />
#V<br />
00LC-41<br />
99LC-19<br />
#V<br />
#V<br />
#V<br />
#V<br />
#V<br />
00LC-89<br />
#V<br />
#V<br />
99LC-06<br />
#V<br />
#V<br />
#V<br />
#V<br />
00LC-90<br />
#V<br />
#V<br />
00LC-88<br />
00LC-92<br />
00LC-87<br />
00LC-91<br />
99LC-21<br />
A'<br />
99LC-20<br />
00LC-93<br />
6015000<br />
6020000<br />
6025000<br />
B'<br />
2055000<br />
2050000<br />
Ü1:18,000<br />
0 750 1,500 3,000<br />
Feet<br />
PLAN VIEW<br />
San Francisco International <strong>Airport</strong><br />
San Francisco, California<br />
FIGURE DB-1
Fugro Consultants, Inc.<br />
Project No. 04.79221200 <strong>ABAG</strong><br />
0<br />
A<br />
N61W<br />
00LC-52<br />
335 ft, North<br />
#V<br />
00LC-55<br />
335 ft, North<br />
#V<br />
00LC-57<br />
78 ft, North<br />
#V<br />
00LC-35<br />
52 ft, North<br />
C-C'<br />
#V<br />
00LC-39<br />
107 ft, North<br />
#V<br />
D-D'<br />
00LC-72<br />
69 ft, North<br />
00LC-71<br />
224 ft, South<br />
#V #V<br />
00LC-36<br />
280 ft, South<br />
#V<br />
00LC-81<br />
74 ft, South<br />
#V<br />
99LC-07<br />
265 ft, South<br />
#V<br />
00LC-84<br />
334 ft, South<br />
#V<br />
00LC-86<br />
331 ft, South<br />
#V<br />
00LC-87<br />
183 ft, North<br />
#V<br />
00LC-91<br />
166 ft, North<br />
#V<br />
A'<br />
S61E<br />
0<br />
-30<br />
-30<br />
-60<br />
-60<br />
N:\Projects\04_2012\04_7922_1200_Caltrans<strong>Airport</strong>Recov\Outputs\2013_03_05_<strong>Report</strong>\mxd\Fig_DB02a_SFO_ProfileA.mxd, 03/21/13, dpollard<br />
ELEVATION (FEET)<br />
-90<br />
-120<br />
-150<br />
30 ft<br />
1000 ft<br />
Vertical Exaggeration = 33.3X<br />
2<br />
0 100 200<br />
Fr(%) qc(tsf)<br />
2 0<br />
100 200<br />
Fr(%) qc(tsf)<br />
Legend<br />
#V<br />
#V<br />
#V<br />
Fugro CPT, Phase 1, 1999<br />
Fugro CPT, 2000, Phase 2<br />
Fugro CPT, 2000, Phase 3<br />
F r = Friction Ratio<br />
q c = Tip Resistance<br />
2 0<br />
100 200<br />
Fr(%) qc(tsf)<br />
2 0<br />
100 200<br />
Fr(%) qc(tsf)<br />
Tip Resistance (tsf)<br />
2 0<br />
100 200<br />
Fr(%) qc(tsf)<br />
2 0<br />
100 200<br />
Fr(%) qc(tsf)<br />
2 0<br />
100 200<br />
Fr(%) qc(tsf)<br />
2 0<br />
100 200<br />
Fr(%) qc(tsf)<br />
CPT Correlation Chart Robertson and Wride, 1990<br />
1000 _<br />
100 _<br />
10 _<br />
1 _<br />
0.01<br />
_<br />
Increasing<br />
Effective<br />
Stress<br />
1<br />
Increasing Ic<br />
_<br />
0.1<br />
6<br />
7<br />
Normally Consolidated<br />
5<br />
_<br />
Friction Ratio (%)<br />
Increasing<br />
OCR, Age,<br />
Cementation<br />
1<br />
8<br />
4<br />
Increasing<br />
Sensitivity<br />
9<br />
3<br />
Increasing<br />
OCR, Age<br />
2<br />
_<br />
10<br />
Zone<br />
1<br />
2<br />
3<br />
4<br />
5<br />
6<br />
7<br />
8<br />
9<br />
2<br />
0 100 200<br />
2 0<br />
100<br />
Fr(%)<br />
200<br />
qc(tsf)<br />
Fr(%) qc(tsf)<br />
Soil Behavior Type<br />
Sensitive Fine-grained<br />
Peats<br />
Silty Clay to Clay<br />
Clayey Silt to Silty Clay<br />
Silty Sand to Sandy Silt<br />
Clean Sand to Silty Sand<br />
Gravelly Sand to Dense Sand<br />
Very Stiff Sand to Clayey Sand*<br />
Very Stiff Fine-Grained*<br />
2 0<br />
2100 0<br />
200 100 200<br />
Fr(%) Fr(%) qc(tsf) qc(tsf)<br />
2 0<br />
100 200<br />
Fr(%) qc(tsf)<br />
2 0<br />
100 200<br />
Fr(%) qc(tsf)<br />
-90<br />
-120<br />
-150<br />
ELEVATION (FEET)<br />
GEOTECHNICAL CROSS SECTION A-A'<br />
San Francisco International <strong>Airport</strong><br />
San Francisco, California<br />
FIGURE DB-2a
Fugro Consultants, Inc.<br />
Project No. 04.79221200 <strong>ABAG</strong><br />
10<br />
0<br />
B<br />
N61W<br />
00LC-28<br />
61 ft, South<br />
#V<br />
00LC-50<br />
300 ft, North<br />
00LC-51<br />
246 ft, South<br />
00LC-40<br />
92 ft, South<br />
99LC-08<br />
27 ft, South<br />
#V #V #V #V #V<br />
99LC-24<br />
4 ft, South<br />
99LC-09<br />
2 ft, North<br />
#V<br />
00LC-58<br />
226 ft, South<br />
#V<br />
99LC-10<br />
C-C' 13 ft, North<br />
#V<br />
00LC-63<br />
180 ft, South<br />
#V<br />
D-D'<br />
00LC-74<br />
391 ft, North<br />
#V<br />
00LC-94<br />
370 ft, North<br />
00LC-79<br />
207 ft, South<br />
00LC-82<br />
13 ft, South<br />
99LC-05<br />
310 ft, North<br />
00LC-85<br />
71 ft, North<br />
00LC-41<br />
79 ft, South<br />
00LC-89<br />
18 ft, South<br />
#V #V #V #V #V #V #V #V<br />
00LC-93<br />
39 ft, South<br />
B'<br />
S61E<br />
10<br />
0<br />
-10<br />
-10<br />
-20<br />
-20<br />
-30<br />
-30<br />
-40<br />
-40<br />
-50<br />
-50<br />
-60<br />
-60<br />
N:\Projects\04_2012\04_7922_1200_Caltrans<strong>Airport</strong>Recov\Outputs\2013_03_05_<strong>Report</strong>\mxd\Fig_DB02b_SFO_ProfileB.mxd, 03/21/13, dpollard<br />
ELEVATION (FEET)<br />
-70<br />
-80<br />
-90<br />
-100<br />
-110<br />
-120<br />
-130<br />
-140<br />
-150<br />
-160<br />
-170<br />
30 ft<br />
2 0<br />
100 200<br />
Fr(%) qc(tsf)<br />
2 0<br />
100 200<br />
2 0<br />
100 200<br />
Fr(%) qc(tsf)<br />
Fr(%) qc(tsf) 2 0<br />
100 200<br />
Fr(%) qc(tsf)<br />
1000 ft<br />
Vertical Exaggeration = 33.3X<br />
2 0<br />
100 200<br />
Fr(%) qc(tsf)<br />
Legend<br />
#V<br />
#V<br />
#V<br />
2 0<br />
100 200<br />
Fr(%) qc(tsf)<br />
Fugro CPT, Phase 1, 1999<br />
Fugro CPT, 2000, Phase 2<br />
Fugro CPT, 2000, Phase 3<br />
F r = Friction Ratio<br />
q c = Tip Resistance<br />
2 0<br />
100 200<br />
2 0<br />
100 Fr(%) 200 qc(tsf)<br />
Fr(%) qc(tsf)<br />
2<br />
0 100 200<br />
Fr(%) qc(tsf)<br />
Tip Resistance (tsf)<br />
2 0<br />
100 200<br />
Fr(%) qc(tsf)<br />
2 0<br />
100 200<br />
Fr(%) qc(tsf)<br />
2<br />
0 100 200<br />
2 0<br />
100<br />
qc(tsf)<br />
200<br />
Fr(%)<br />
2 0 100 200<br />
Fr(%) qc(tsf)<br />
2 0 100 200<br />
Fr(%) qc(tsf) Fr(%) qc(tsf)<br />
CPT Correlation Chart Robertson and Wride, 1990<br />
1000 _<br />
100 _<br />
10 _<br />
1 _<br />
0.01<br />
_<br />
Increasing<br />
Effective<br />
Stress<br />
1<br />
Increasing Ic<br />
_<br />
0.1<br />
6<br />
7<br />
Normally Consolidated<br />
5<br />
_<br />
Friction Ratio (%)<br />
Increasing<br />
OCR, Age,<br />
Cementation<br />
1<br />
8<br />
4<br />
Increasing<br />
Sensitivity<br />
9<br />
Increasing<br />
OCR, Age<br />
2<br />
3<br />
_<br />
10<br />
Zone<br />
1<br />
2<br />
3<br />
4<br />
5<br />
6<br />
7<br />
8<br />
9<br />
Soil Behavior Type<br />
Sensitive Fine-grained<br />
Peats<br />
Silty Clay to Clay<br />
Clayey Silt to Silty Clay<br />
Silty Sand to Sandy Silt<br />
Clean Sand to Silty Sand<br />
Gravelly Sand to Dense Sand<br />
Very Stiff Sand to Clayey Sand*<br />
Very Stiff Fine-Grained*<br />
2 0<br />
100 200<br />
Fr(%) qc(tsf)<br />
2 0<br />
100 200<br />
Fr(%) qc(tsf)<br />
2 0<br />
100 200<br />
Fr(%) qc(tsf)<br />
2 0<br />
100 200<br />
Fr(%) qc(tsf)<br />
-70<br />
-80<br />
-90<br />
-100<br />
-110<br />
-120<br />
-130<br />
-140<br />
-150<br />
-160<br />
-170<br />
ELEVATION (FEET)<br />
GEOTECHNICAL CROSS SECTION B-B'<br />
San Francisco International <strong>Airport</strong><br />
San Francisco, California<br />
FIGURE DB-2b
Fugro Consultants, Inc.<br />
Project No. 04.79221200 <strong>ABAG</strong><br />
0<br />
C<br />
S29W<br />
00LC-37<br />
83 ft, West<br />
00LC-62<br />
18 ft, West<br />
A-A'<br />
00LC-35<br />
226 ft, West<br />
00LC-31<br />
261 ft, West<br />
B-B' 99LC-10<br />
148 ft, West<br />
99LC-11<br />
182 ft, West<br />
#V<br />
#V #V #V #V #V #V<br />
99LC-03<br />
47 ft, West<br />
C'<br />
N29E<br />
0<br />
-30<br />
-30<br />
-60<br />
-60<br />
N:\Projects\04_2012\04_7922_1200_Caltrans<strong>Airport</strong>Recov\Outputs\2013_03_05_<strong>Report</strong>\mxd\Fig_DB02c_SFO_ProfileC.mxd, 03/21/13, dpollard<br />
ELEVATION (FEET)<br />
-90<br />
-120<br />
-150<br />
30 ft<br />
1000 ft<br />
Vertical Exaggeration = 33.3X<br />
Legend<br />
#V<br />
#V<br />
#V<br />
Fugro CPT, Phase 1, 1999<br />
Fugro CPT, 2000, Phase 2<br />
Fugro CPT, 2000, Phase 3<br />
F r = Friction Ratio<br />
q c = Tip Resistance<br />
2 0<br />
100 200<br />
Fr(%) qc(tsf)<br />
2 0<br />
100 200<br />
Fr(%) qc(tsf) 2 0<br />
100<br />
Fr(%) qc(tsf)<br />
200<br />
2 0<br />
100 200<br />
Fr(%) qc(tsf)<br />
Tip Resistance (tsf)<br />
2 0<br />
100 200<br />
Fr(%) qc(tsf)<br />
2 0<br />
100 200<br />
Fr(%) qc(tsf)<br />
2<br />
0 100 200<br />
Fr(%) qc(tsf)<br />
CPT Correlation Chart Robertson and Wride, 1990<br />
1000 _<br />
100 _<br />
10 _<br />
1 _<br />
0.01<br />
_<br />
Increasing<br />
Effective<br />
Stress<br />
1<br />
Increasing Ic<br />
_<br />
0.1<br />
6<br />
7<br />
Normally Consolidated<br />
5<br />
_<br />
Friction Ratio (%)<br />
Increasing<br />
OCR, Age,<br />
Cementation<br />
1<br />
8<br />
4<br />
Increasing<br />
Sensitivity<br />
9<br />
3<br />
Increasing<br />
OCR, Age<br />
2<br />
_<br />
10<br />
Zone<br />
1<br />
2<br />
3<br />
4<br />
5<br />
6<br />
7<br />
8<br />
9<br />
Soil Behavior Type<br />
Sensitive Fine-grained<br />
Peats<br />
Silty Clay to Clay<br />
Clayey Silt to Silty Clay<br />
Silty Sand to Sandy Silt<br />
Clean Sand to Silty Sand<br />
Gravelly Sand to Dense Sand<br />
Very Stiff Sand to Clayey Sand*<br />
Very Stiff Fine-Grained*<br />
-90<br />
-120<br />
-150<br />
ELEVATION (FEET)<br />
GEOTECHNICAL CROSS SECTION C-C'<br />
San Francisco International <strong>Airport</strong><br />
San Francisco, California<br />
FIGURE DB-2c
Fugro Consultants, Inc.<br />
Project No. 04.79221200 <strong>ABAG</strong><br />
0<br />
D<br />
S29W<br />
00LC-66<br />
350 ft, East<br />
#V<br />
00LC-67<br />
24 ft, West<br />
#V<br />
00LC-70<br />
383 ft, East<br />
#V<br />
A-A'<br />
00LC-72<br />
278 ft, East<br />
#V<br />
B-B'<br />
00LC-74<br />
350 ft, East<br />
#V<br />
99LC-15<br />
42 ft, West<br />
00LC-76<br />
256 ft, East<br />
00LC-77<br />
17 ft, East<br />
99LC-04<br />
243 ft, East<br />
99LC-14<br />
23 ft, West<br />
#V #V<br />
#V #V #V<br />
D'<br />
N29E<br />
0<br />
-30<br />
-30<br />
-60<br />
-60<br />
N:\Projects\04_2012\04_7922_1200_Caltrans<strong>Airport</strong>Recov\Outputs\2013_03_05_<strong>Report</strong>\mxd\Fig_DB02d_SFO_ProfileD.mxd, 03/21/13, dpollard<br />
ELEVATION (FEET)<br />
-90<br />
-120<br />
-150<br />
30 ft<br />
1000 ft<br />
Vertical Exaggeration = 33.3X<br />
2<br />
0 100 200<br />
Fr(%) qc(tsf)<br />
2 0<br />
100 200<br />
Fr(%) qc(tsf)<br />
2<br />
0 100 200<br />
Fr(%) qc(tsf)<br />
Legend<br />
#V<br />
#V<br />
#V<br />
Fugro CPT, Phase 1, 1999<br />
Fugro CPT, 2000, Phase 2<br />
Fugro CPT, 2000, Phase 3<br />
F r = Friction Ratio<br />
q c = Tip Resistance<br />
Tip Resistance (tsf)<br />
2<br />
0 100 200<br />
Fr(%) qc(tsf)<br />
2 0<br />
100 200<br />
Fr(%) qc(tsf)<br />
2 0<br />
100 200<br />
Fr(%) qc(tsf)<br />
2 0<br />
100 200<br />
2 0<br />
Fr(%) 100 qc(tsf) 200<br />
Fr(%) qc(tsf)<br />
CPT Correlation Chart Robertson and Wride, 1990<br />
1000 _<br />
100 _<br />
10 _<br />
1 _<br />
0.01<br />
_<br />
Increasing<br />
Effective<br />
Stress<br />
1<br />
Increasing Ic<br />
_<br />
0.1<br />
6<br />
7<br />
Normally Consolidated<br />
5<br />
_<br />
Friction Ratio (%)<br />
Increasing<br />
OCR, Age,<br />
Cementation<br />
1<br />
8<br />
4<br />
Increasing<br />
Sensitivity<br />
9<br />
3<br />
Increasing<br />
OCR, Age<br />
2<br />
_<br />
10<br />
Zone<br />
1<br />
2<br />
3<br />
4<br />
5<br />
6<br />
7<br />
8<br />
9<br />
Soil Behavior Type<br />
Sensitive Fine-grained<br />
Peats<br />
Silty Clay to Clay<br />
Clayey Silt to Silty Clay<br />
Silty Sand to Sandy Silt<br />
Clean Sand to Silty Sand<br />
Gravelly Sand to Dense Sand<br />
Very Stiff Sand to Clayey Sand*<br />
Very Stiff Fine-Grained*<br />
2<br />
0 100 200<br />
Fr(%) qc(tsf)<br />
2 0<br />
100 200<br />
Fr(%) qc(tsf)<br />
-90<br />
-120<br />
-150<br />
ELEVATION (FEET)<br />
GEOTECHNICAL CROSS SECTION D-D'<br />
San Francisco International <strong>Airport</strong><br />
San Francisco, California<br />
FIGURE DB-2d
Fugro Consultants, Inc.<br />
Project No. 04.79221200 <strong>ABAG</strong><br />
6010000<br />
6015000<br />
6020000<br />
6025000<br />
99LC-27<br />
Legend<br />
Settlement (Inches)<br />
2060000<br />
99LC-22<br />
2060000<br />
0 - 1<br />
1 - 2<br />
2 - 3<br />
3 - 4<br />
N:\Projects\04_2012\04_7922_1200_Caltrans<strong>Airport</strong>Recov\Outputs\2013_03_05_<strong>Report</strong>\mxd\Fig_DB03_SFO_LiquSettl_M7_80_a048_SanAndreas_1906_to80Ft.mxd, 03/21/13, dpollard<br />
2055000<br />
2050000<br />
6010000<br />
99LC-02<br />
00LC-50<br />
99LC-26<br />
00LC-28<br />
99LC-01<br />
99LC-12<br />
00LC-54 99LC-25<br />
99LC-03 99LC-14<br />
00LC-51 00LC-40<br />
00LC-65<br />
00LC-60<br />
99LC-04<br />
99LC-08<br />
00LC-61<br />
99LC-24<br />
99LC-13 00LC-77<br />
00LC-29<br />
99LC-11<br />
00LC-53<br />
00LC-64<br />
99LC-09<br />
00LC-78<br />
99LC-23<br />
00LC-59<br />
00LC-76<br />
00LC-33<br />
00LC-52<br />
00LC-56<br />
00LC-58<br />
99LC-10<br />
00LC-75<br />
99LC-15<br />
00LC-30<br />
00LC-55<br />
00LC-63 00LC-74<br />
00LC-31<br />
00LC-94<br />
99LC-16<br />
00LC-57<br />
00LC-32<br />
00LC-83<br />
00LC-79<br />
00LC-35<br />
00LC-82<br />
00LC-39<br />
99LC-17<br />
99LC-05<br />
00LC-62<br />
00LC-85<br />
00LC-72<br />
00LC-73<br />
99LC-06<br />
00LC-34<br />
00LC-69<br />
00LC-90<br />
00LC-37<br />
00LC-71<br />
00LC-41<br />
99LC-18 00LC-89<br />
00LC-68<br />
99LC-20<br />
00LC-36<br />
00LC-81<br />
99LC-19<br />
00LC-93<br />
00LC-70 00LC-80<br />
00LC-88 00LC-92<br />
00LC-67 00LC-38<br />
99LC-07<br />
00LC-87<br />
00LC-84<br />
00LC-86<br />
00LC-91<br />
99LC-21<br />
00LC-66<br />
6015000<br />
6020000<br />
6025000<br />
2055000<br />
2050000<br />
4 - 5<br />
> 5<br />
Magnitude= 7.8; P. G. A. = 0.48 g<br />
Only CPTs with total depth >30 feet<br />
are shown<br />
Coordinate Grid: CA State Plane, Zone 3,<br />
NAD83, Feet<br />
Ü1:18,005<br />
0 750 1,500 3,000<br />
Feet<br />
LIQUEFACTION SETTLEMENT MAP<br />
TOP 80 FEET<br />
1906 San Francisco Earthquake Scenario<br />
San Francisco International <strong>Airport</strong><br />
San Francisco, California<br />
FIGURE DB-3
Fugro Consultants, Inc.<br />
Project No. 04.79221200 <strong>ABAG</strong><br />
6010000<br />
6015000<br />
6020000<br />
6025000<br />
Legend<br />
99LC-27<br />
Settlement (Inches)<br />
2060000<br />
99LC-22<br />
2060000<br />
0 - 1<br />
1 - 2<br />
2 - 3<br />
3 - 4<br />
4 - 5<br />
N:\Projects\04_2012\04_7922_1200_Caltrans<strong>Airport</strong>Recov\Outputs\2013_03_05_<strong>Report</strong>\mxd\Fig_DB04_SFO_LiquSettl_M7_26_a027_HRC_Fault_to80Ft.mxd, 03/21/13, dpollard<br />
2055000<br />
2050000<br />
6010000<br />
99LC-02<br />
00LC-50<br />
99LC-26<br />
00LC-28<br />
99LC-01<br />
00LC-54<br />
99LC-25<br />
99LC-12<br />
99LC-03<br />
99LC-14<br />
00LC-51 00LC-40<br />
00LC-65<br />
00LC-60<br />
99LC-04<br />
00LC-61<br />
99LC-08 99LC-24<br />
99LC-13<br />
00LC-29<br />
00LC-77<br />
00LC-53<br />
99LC-11 00LC-64 00LC-78<br />
99LC-09<br />
99LC-23<br />
00LC-59<br />
00LC-76<br />
00LC-56<br />
00LC-33<br />
00LC-52<br />
00LC-58<br />
99LC-10<br />
00LC-75<br />
00LC-30<br />
99LC-15<br />
00LC-55<br />
00LC-74<br />
00LC-31 00LC-63<br />
00LC-94<br />
99LC-16<br />
00LC-57<br />
00LC-32<br />
00LC-83<br />
00LC-79<br />
00LC-35<br />
00LC-82<br />
00LC-39 99LC-17<br />
99LC-05<br />
00LC-62<br />
00LC-72<br />
00LC-73<br />
00LC-69<br />
00LC-37<br />
00LC-71<br />
00LC-68<br />
00LC-36<br />
00LC-70 00LC-80<br />
00LC-67 00LC-38<br />
00LC-66<br />
6015000<br />
6020000<br />
00LC-85<br />
00LC-34<br />
99LC-06<br />
00LC-90<br />
00LC-41<br />
99LC-18 00LC-89<br />
99LC-20<br />
00LC-81<br />
99LC-19<br />
00LC-93<br />
00LC-88 00LC-92<br />
99LC-07<br />
00LC-87<br />
00LC-84<br />
00LC-91<br />
00LC-86<br />
99LC-21<br />
6025000<br />
2055000<br />
2050000<br />
> 5<br />
Magnitude= 7.26; P. G. A. = 0.27 g<br />
Only CPTs with total depth >30 feet<br />
are shown<br />
Coordinate Grid: CA State Plane, Zone 3,<br />
NAD83, Feet<br />
Ü1:18,005<br />
0 750 1,500 3,000<br />
Feet<br />
LIQUEFACTION SETTLEMENT MAP<br />
TOP 80 FEET<br />
Hayward-Rodgers Creek Scenario<br />
San Francisco International <strong>Airport</strong><br />
San Francisco, California<br />
FIGURE DB-4
Fugro Consultants, Inc.<br />
Project No. 04.79221200 <strong>ABAG</strong><br />
6010000<br />
6015000<br />
6020000<br />
6025000<br />
Legend<br />
99LC-27<br />
Settlement (Inches)<br />
2060000<br />
99LC-22<br />
2060000<br />
0 - 1<br />
1 - 2<br />
2 - 3<br />
3 - 4<br />
4 - 5<br />
N:\Projects\04_2012\04_7922_1200_Caltrans<strong>Airport</strong>Recov\Outputs\2013_03_05_<strong>Report</strong>\mxd\Fig_DB05_SFO_LiquSettl_M6_71_a015_CGV_Fault_to80Ft.mxd, 03/21/13, dpollard<br />
2055000<br />
2050000<br />
6010000<br />
99LC-02<br />
00LC-50<br />
00LC-28<br />
99LC-26<br />
99LC-01<br />
00LC-54<br />
99LC-25<br />
99LC-12<br />
00LC-51<br />
99LC-03<br />
99LC-14<br />
00LC-40<br />
00LC-65<br />
00LC-60<br />
99LC-04<br />
99LC-08<br />
00LC-61<br />
99LC-24<br />
99LC-13<br />
00LC-29<br />
00LC-77<br />
00LC-53<br />
99LC-11 00LC-64 00LC-78<br />
99LC-09<br />
99LC-23<br />
00LC-59<br />
00LC-56<br />
00LC-76<br />
00LC-33<br />
00LC-52<br />
00LC-58<br />
99LC-10<br />
00LC-75<br />
00LC-30<br />
99LC-15<br />
00LC-55<br />
00LC-74<br />
00LC-31 00LC-63<br />
00LC-94<br />
99LC-16<br />
00LC-57<br />
00LC-32<br />
00LC-83<br />
00LC-79<br />
00LC-35<br />
00LC-82<br />
00LC-39 99LC-17<br />
99LC-05<br />
00LC-62<br />
00LC-72<br />
00LC-73<br />
00LC-69<br />
00LC-37<br />
00LC-71<br />
00LC-68<br />
00LC-36<br />
00LC-70 00LC-80<br />
00LC-67 00LC-38<br />
00LC-66<br />
6015000<br />
6020000<br />
00LC-85<br />
00LC-34<br />
99LC-06<br />
00LC-41 00LC-90<br />
99LC-18 00LC-89<br />
99LC-20<br />
00LC-81<br />
99LC-19<br />
00LC-93<br />
00LC-88 00LC-92<br />
99LC-07<br />
00LC-87<br />
00LC-84<br />
00LC-91<br />
00LC-86<br />
99LC-21<br />
6025000<br />
2055000<br />
2050000<br />
> 5<br />
Magnitude= 6.71; P. G. A. = 0.15 g<br />
Only CPTs with total depth >30 feet<br />
are shown<br />
Coordinate Grid: CA State Plane, Zone 3,<br />
NAD83, Feet<br />
Ü1:18,005<br />
0 750 1,500 3,000<br />
Feet<br />
LIQUEFACTION SETTLEMENT MAP<br />
TOP 80 FEET<br />
Concord-Green Valley Scenario<br />
San Francisco International <strong>Airport</strong><br />
San Francisco, California<br />
FIGURE DB-5
Fugro Consultants, Inc.<br />
Project No. 04.79221200 <strong>ABAG</strong><br />
6010000<br />
6015000<br />
6020000<br />
6025000<br />
Legend<br />
99LC-27<br />
Settlement (Inches)<br />
2060000<br />
99LC-22<br />
2060000<br />
0 - 1<br />
1 - 2<br />
2 - 3<br />
N:\Projects\04_2012\04_7922_1200_Caltrans<strong>Airport</strong>Recov\Outputs\2013_03_05_<strong>Report</strong>\mxd\Fig_DB06_SFO_LiquSettl_M8_00_a048_2008USGS_10Perc_50Yrs_to80Ft.mxd, 03/21/13, dpollard<br />
2055000<br />
2050000<br />
6010000<br />
99LC-02<br />
00LC-50<br />
00LC-28<br />
99LC-26<br />
99LC-01<br />
99LC-12<br />
00LC-54<br />
99LC-03<br />
99LC-25<br />
99LC-14<br />
00LC-51 00LC-40<br />
00LC-65<br />
00LC-60<br />
99LC-04<br />
00LC-61<br />
99LC-08 99LC-24<br />
99LC-13<br />
00LC-29<br />
00LC-77<br />
00LC-53<br />
99LC-11 00LC-64<br />
99LC-23<br />
00LC-78<br />
99LC-09<br />
00LC-59<br />
00LC-76<br />
00LC-33<br />
00LC-52<br />
00LC-56<br />
00LC-58<br />
99LC-10<br />
00LC-75<br />
00LC-30<br />
99LC-15<br />
00LC-55<br />
00LC-74<br />
00LC-31 00LC-63<br />
00LC-94<br />
99LC-16<br />
00LC-57<br />
00LC-32<br />
00LC-83<br />
00LC-79<br />
00LC-35<br />
00LC-39<br />
99LC-17 00LC-82 99LC-05<br />
00LC-62<br />
00LC-72<br />
00LC-73<br />
00LC-69<br />
00LC-37<br />
00LC-71<br />
00LC-68<br />
00LC-36<br />
00LC-70 00LC-80<br />
00LC-67 00LC-38<br />
00LC-66<br />
6015000<br />
6020000<br />
00LC-34<br />
00LC-81<br />
99LC-07<br />
00LC-84<br />
00LC-85<br />
99LC-06<br />
00LC-90<br />
00LC-41<br />
99LC-18 00LC-89<br />
99LC-20<br />
99LC-19<br />
00LC-93<br />
00LC-88 00LC-92<br />
00LC-87<br />
00LC-91<br />
00LC-86<br />
99LC-21<br />
6025000<br />
2055000<br />
2050000<br />
3 - 4<br />
4 - 5<br />
> 5<br />
Magnitude= 8.0; P. G. A. = 0.48 g<br />
Only CPTs with total depth >30 feet<br />
are shown<br />
Coordinate Grid: CA State Plane, Zone 3,<br />
NAD83, Feet<br />
Ü1:18,005<br />
0 750 1,500 3,000<br />
Feet<br />
LIQUEFACTION SETTLEMENT MAP<br />
TOP 80 FEET<br />
10% Probability of Exceedance<br />
in 50-Years Scenario<br />
San Francisco International <strong>Airport</strong><br />
San Francisco, California<br />
FIGURE DB-6
Fugro Consultants, Inc.<br />
Project No. 04.79221200 <strong>ABAG</strong><br />
6010000<br />
6015000<br />
6020000<br />
6025000<br />
Legend<br />
99LC-27<br />
Settlement (Inches)<br />
2060000<br />
99LC-22<br />
2060000<br />
0 - 1<br />
1 - 2<br />
2 - 3<br />
N:\Projects\04_2012\04_7922_1200_Caltrans<strong>Airport</strong>Recov\Outputs\2013_03_05_<strong>Report</strong>\mxd\Fig_DB07_SFO_LiquSettl_M8_00_a075_2008USGS_2Perc_50Yrs_to80Ft.mxd, 03/21/13, dpollard<br />
2055000<br />
2050000<br />
6010000<br />
99LC-02<br />
00LC-50<br />
00LC-28<br />
99LC-26<br />
99LC-01<br />
99LC-12<br />
00LC-54<br />
00LC-51<br />
99LC-25<br />
99LC-03<br />
99LC-14<br />
00LC-40<br />
00LC-65<br />
00LC-60<br />
99LC-04<br />
99LC-08 99LC-24<br />
00LC-61<br />
00LC-29<br />
99LC-13 00LC-77<br />
00LC-53<br />
99LC-23 99LC-09<br />
99LC-11 00LC-64 00LC-78<br />
00LC-59<br />
00LC-76<br />
00LC-33<br />
00LC-52<br />
00LC-58<br />
00LC-56<br />
99LC-10<br />
99LC-15<br />
00LC-75<br />
00LC-55<br />
00LC-30<br />
00LC-74<br />
00LC-31<br />
00LC-63<br />
00LC-94<br />
99LC-16<br />
00LC-57<br />
00LC-32<br />
00LC-83<br />
00LC-35<br />
00LC-79<br />
00LC-82<br />
00LC-39<br />
99LC-05<br />
00LC-62<br />
99LC-17<br />
00LC-72<br />
00LC-85<br />
00LC-73<br />
99LC-06<br />
00LC-34<br />
00LC-69<br />
00LC-90<br />
00LC-37<br />
00LC-41<br />
00LC-71<br />
99LC-18<br />
00LC-89<br />
00LC-68<br />
99LC-20<br />
00LC-81<br />
99LC-19<br />
00LC-36<br />
00LC-93<br />
00LC-70 00LC-80<br />
00LC-88 00LC-92<br />
00LC-67 00LC-38<br />
99LC-07<br />
00LC-87<br />
00LC-84<br />
00LC-86<br />
00LC-91<br />
99LC-21<br />
00LC-66<br />
6015000<br />
6020000<br />
6025000<br />
2055000<br />
2050000<br />
3 - 4<br />
4 - 5<br />
> 5<br />
Magnitude= 8.0; P. G. A. = 0.75 g<br />
Only CPTs with total depth >30 feet<br />
are shown<br />
Coordinate Grid: CA State Plane, Zone 3,<br />
NAD83, Feet<br />
Ü1:18,005<br />
0 750 1,500 3,000<br />
Feet<br />
LIQUEFACTION SETTLEMENT MAP<br />
TOP 80 FEET<br />
2% Probability of Exceedance<br />
in 50-Years Scenario<br />
San Francisco International <strong>Airport</strong><br />
San Francisco, California<br />
FIGURE DB-7
Fugro Consultants, Inc.<br />
Project No. 04.79221200 <strong>ABAG</strong><br />
0<br />
A<br />
N61W<br />
00LC-52<br />
335 ft, North<br />
#V<br />
00LC-55<br />
335 ft, North<br />
#V<br />
00LC-57<br />
78 ft, North<br />
#V<br />
00LC-35<br />
52 ft, North<br />
C-C'<br />
#V<br />
00LC-39<br />
107 ft, North<br />
#V<br />
D-D'<br />
00LC-72<br />
69 ft, North<br />
00LC-71<br />
224 ft, South<br />
#V #V<br />
00LC-36<br />
280 ft, South<br />
#V<br />
00LC-81<br />
74 ft, South<br />
#V<br />
99LC-07<br />
265 ft, South<br />
#V<br />
00LC-84<br />
334 ft, South<br />
#V<br />
00LC-86<br />
331 ft, South<br />
#V<br />
00LC-87<br />
183 ft, North<br />
#V<br />
00LC-91<br />
166 ft, North<br />
#V<br />
A'<br />
S61E<br />
0<br />
-30<br />
-30<br />
N:\Projects\04_2012\04_7922_1200_Caltrans<strong>Airport</strong>Recov\Outputs\2013_03_05_<strong>Report</strong>\mxd\Fig_DB08a_SFO_ProfileA_M8_00_a075_2475Yr.mxd, 03/21/13, dpollard<br />
ELEVATION (FEET)<br />
-60<br />
-90<br />
-120<br />
-150<br />
Legend<br />
#V<br />
#V<br />
#V<br />
30 ft<br />
4 2<br />
ev , %<br />
S, in<br />
1000 ft<br />
Vertical Exaggeration = 33.3X<br />
Fugro CPT, Phase 1, 1999<br />
Fugro CPT, 2000, Phase 2<br />
Fugro CPT, 2000, Phase 3<br />
q c = Tip Resistance<br />
e = Volumetric Strain<br />
S = Settlement<br />
0 100 200<br />
q c (tsf)<br />
Tip Resistance (tsf)<br />
1000 _<br />
100 _<br />
10 _<br />
1 _<br />
0.01<br />
_<br />
4 2<br />
ev , %<br />
S, in<br />
_<br />
2 4<br />
ev , %<br />
0 100 200 S, in<br />
q c (tsf)<br />
CPT Correlation Chart<br />
Increasing<br />
Effective<br />
Stress<br />
1<br />
Increasing Ic<br />
0.1<br />
6<br />
7<br />
Normally Consolidated<br />
5<br />
_<br />
Friction Ratio (%)<br />
Increasing 8<br />
OCR, Age,<br />
Cementation<br />
1<br />
4<br />
Increasing<br />
Sensitivity<br />
9<br />
Increasing<br />
OCR, Age<br />
2<br />
3<br />
_<br />
10<br />
4 2<br />
ev , %<br />
S, in<br />
0 100 200<br />
q c (tsf)<br />
0 100 200<br />
q c (tsf)<br />
4 2<br />
e v , %<br />
S, in<br />
4 2<br />
ev , %<br />
S, in<br />
0 100 200<br />
q c (tsf)<br />
Robertson and Wride, 1990<br />
Zone<br />
1<br />
2<br />
3<br />
4<br />
5<br />
6<br />
7<br />
8<br />
9<br />
Soil Behavior Type<br />
Sensitive Fine-grained<br />
Peats<br />
Silty Clay to Clay<br />
Clayey Silt to Silty Clay<br />
Silty Sand to Sandy Silt<br />
Clean Sand to Silty Sand<br />
Gravelly Sand to Dense Sand<br />
Very Stiff Sand to Clayey Sand*<br />
Very Stiff Fine-Grained*<br />
4 2<br />
ev , %<br />
S, in<br />
0 100 200<br />
q c (tsf)<br />
4 2<br />
ev , %<br />
S, in<br />
0<br />
100 200<br />
q c (tsf)<br />
Cumulative<br />
Settlement<br />
Volumetric<br />
Strain<br />
0<br />
100 200<br />
q c (tsf)<br />
4 2<br />
ev , %<br />
S, in<br />
10 8 6 4 2<br />
0 100 200 300<br />
Volumetric Strain (%) Tip Resistance (tsf)<br />
Settlement (in)<br />
4 2<br />
ev , %<br />
0 100 200<br />
S, in<br />
q c (tsf)<br />
Soil Type<br />
Liquefiable<br />
Zones<br />
Critical Tip<br />
Resistance<br />
CPT Tip<br />
Resistance<br />
4 2<br />
ev , %<br />
S, in<br />
0 100 200<br />
q c (tsf)<br />
4 2<br />
4 0<br />
2<br />
100 0<br />
200<br />
100 200<br />
ev , % ev , % q c (tsf) q 100 200<br />
c (tsf)<br />
0 S, in<br />
q c (tsf) S, in<br />
4 2<br />
ev , %<br />
S, in<br />
0<br />
100 200<br />
q c (tsf)<br />
-60<br />
-90<br />
-120<br />
-150<br />
ELEVATION (FEET)<br />
Note: Magnitude= 8.0;<br />
P. G. A. = 0.75 g<br />
LIQUEFACTION CROSS SECTION A-A'<br />
2% Probability of Exceedance<br />
in 50-Years Scenario<br />
San Francisco International <strong>Airport</strong><br />
San Francisco, California<br />
FIGURE DB-8a
Fugro Consultants, Inc.<br />
Project No. 04.79221200 <strong>ABAG</strong><br />
10<br />
0<br />
B<br />
N61W<br />
00LC-28<br />
61 ft, South<br />
#V<br />
00LC-50<br />
300 ft, North<br />
00LC-51<br />
246 ft, South<br />
00LC-40<br />
92 ft, South<br />
99LC-08<br />
27 ft, South<br />
#V #V #V #V #V<br />
99LC-24<br />
4 ft, South<br />
99LC-09<br />
2 ft, North<br />
#V<br />
00LC-58<br />
226 ft, South<br />
#V<br />
99LC-10<br />
C-C' 13 ft, North<br />
#V<br />
00LC-63<br />
180 ft, South<br />
#V<br />
D-D'<br />
00LC-74<br />
391 ft, North<br />
#V<br />
00LC-94<br />
370 ft, North<br />
00LC-79<br />
207 ft, South<br />
00LC-82<br />
13 ft, South<br />
99LC-05<br />
310 ft, North<br />
00LC-85<br />
71 ft, North<br />
00LC-41<br />
79 ft, South<br />
00LC-89<br />
18 ft, South<br />
#V #V #V #V #V #V #V #V<br />
00LC-93<br />
39 ft, South<br />
B'<br />
S61E<br />
10<br />
0<br />
-10<br />
-10<br />
-20<br />
-20<br />
-30<br />
-30<br />
-40<br />
-40<br />
-50<br />
-50<br />
N:\Projects\04_2012\04_7922_1200_Caltrans<strong>Airport</strong>Recov\Outputs\2013_03_05_<strong>Report</strong>\mxd\Fig_DB08b_SFO_ProfileB_M8_00_a075_2475Yr.mxd, 03/21/13, dpollard<br />
ELEVATION (FEET)<br />
-60<br />
-70<br />
-80<br />
-90<br />
-100<br />
-110<br />
-120<br />
-130<br />
-140<br />
-150<br />
-160<br />
-170<br />
Legend<br />
#V<br />
#V<br />
#V<br />
4 2 0<br />
100 200<br />
ev, % qc(tsf)<br />
S, in 4 2 0<br />
100 200<br />
4 2<br />
0 100 200 ev, % qc(tsf)<br />
ev, % 4 2 qc(tsf) 0<br />
100 200S, in<br />
S, in ev, % qc(tsf)<br />
S, in<br />
30 ft<br />
4 2<br />
ev, %<br />
S, in<br />
1000 ft<br />
Vertical Exaggeration = 33.3X<br />
Fugro CPT, Phase 1, 1999<br />
Fugro CPT, 2000, Phase 2<br />
Fugro CPT, 2000, Phase 3<br />
q c = Tip Resistance<br />
e = Volumetric Strain<br />
S = Settlement<br />
4 2<br />
ev, %<br />
S, in<br />
0 100 200<br />
qc(tsf)<br />
Tip Resistance (tsf)<br />
0 100 2004 2<br />
qc(tsf)<br />
ev, %<br />
S, in<br />
4 2<br />
0 100 200<br />
0<br />
100 ev, % 200 qc(tsf)<br />
qc(tsf)<br />
S, in<br />
4 2<br />
ev, %<br />
S, in<br />
4 2<br />
ev, %<br />
S, in<br />
0 100 200<br />
qc(tsf)<br />
CPT Correlation Chart Robertson and Wride, 1990<br />
1000 _<br />
100 _<br />
10 _<br />
1 _<br />
0.01<br />
_<br />
Increasing<br />
Effective<br />
Stress<br />
1<br />
_<br />
7 Increasing 8<br />
OCR, Age,<br />
Cementation<br />
Increasing Ic<br />
0.1<br />
6<br />
Normally Consolidated<br />
5<br />
_<br />
1<br />
Friction Ratio (%)<br />
4<br />
Increasing<br />
Sensitivity<br />
9<br />
Increasing<br />
OCR, Age<br />
2<br />
3<br />
_<br />
10<br />
Zone<br />
1<br />
2<br />
3<br />
4<br />
5<br />
6<br />
7<br />
8<br />
9<br />
Soil Behavior Type<br />
0 100 200<br />
qc(tsf)<br />
Sensitive Fine-grained<br />
Peats<br />
Silty Clay to Clay<br />
Clayey Silt to Silty Clay<br />
Silty Sand to Sandy Silt<br />
Clean Sand to Silty Sand<br />
Gravelly Sand to Dense Sand<br />
Very Stiff Sand to Clayey Sand*<br />
Very Stiff Fine-Grained*<br />
4 2<br />
ev, %<br />
S, in<br />
4 2<br />
ev, %<br />
S, in<br />
0<br />
100 200<br />
qc(tsf)<br />
4 2 0<br />
100 200<br />
ev, % qc(tsf)<br />
S, in<br />
0<br />
100 200<br />
qc(tsf)<br />
2<br />
0 100 200<br />
4<br />
4 2 0<br />
100<br />
qc(tsf)<br />
200<br />
ev, %<br />
4 2 0 100 200<br />
ev, % qc(tsf)<br />
4 2 0 100 S, in 200<br />
ev, % ev, qc(tsf) % qc(tsf)<br />
S, in S, in S, in<br />
2<br />
0 100 200<br />
4<br />
ev, % qc(tsf)<br />
S, in<br />
Cumulative<br />
Settlement<br />
Volumetric<br />
Strain<br />
10 8<br />
Volumetric Strain (%)<br />
Settlement (in)<br />
6 4 2<br />
0 100 200 300<br />
Tip Resistance (tsf)<br />
Soil Type<br />
Liquefiable<br />
Zones<br />
Critical Tip<br />
Resistance<br />
CPT Tip<br />
Resistance<br />
4 2<br />
ev, %<br />
S, in<br />
0<br />
100 200<br />
qc(tsf)<br />
Note: Magnitude= 8.0; P. G. A. = 0.75 g<br />
-60<br />
-70<br />
-80<br />
-90<br />
-100<br />
-110<br />
-120<br />
-130<br />
-140<br />
-150<br />
-160<br />
-170<br />
ELEVATION (FEET)<br />
LIQUEFACTION CROSS SECTION B-B'<br />
2% Probability of Exceedance<br />
in 50-Years Scenario<br />
San Francisco International <strong>Airport</strong><br />
San Francisco, California<br />
FIGURE DB-8b
Fugro Consultants, Inc.<br />
Project No. 04.79221200 <strong>ABAG</strong><br />
0<br />
C<br />
S29W<br />
00LC-37<br />
83 ft, West<br />
00LC-62<br />
18 ft, West<br />
A-A'<br />
00LC-35<br />
226 ft, West<br />
00LC-31<br />
261 ft, West<br />
B-B' 99LC-10<br />
148 ft, West<br />
99LC-11<br />
182 ft, West<br />
#V<br />
#V #V #V #V #V #V<br />
99LC-03<br />
47 ft, West<br />
C'<br />
N29E<br />
0<br />
Legend<br />
#V<br />
#V<br />
Fugro CPT, Phase 1, 1999<br />
Fugro CPT, 2000, Phase 2<br />
Cumulative<br />
Settlement<br />
Soil Type<br />
N:\Projects\04_2012\04_7922_1200_Caltrans<strong>Airport</strong>Recov\Outputs\2013_03_05_<strong>Report</strong>\mxd\Fig_DB08c_SFO_ProfileC_M8_00_a075_2475Yr.mxd, 03/21/13, dpollard<br />
ELEVATION (FEET)<br />
-30<br />
-60<br />
-90<br />
-120<br />
-150<br />
30 ft<br />
1000 ft<br />
Vertical Exaggeration = 33.3X<br />
4 2<br />
ev, %<br />
S, in<br />
4 2<br />
ev, %<br />
S, in<br />
0<br />
100 200<br />
qc(tsf)<br />
4 2 0<br />
100 200<br />
ev, % qc(tsf) 4 2 0<br />
100 200<br />
S, in<br />
ev, % qc(tsf)<br />
0<br />
100 200 S, in<br />
qc(tsf)<br />
4 2<br />
ev, %<br />
S, in<br />
2 4<br />
ev, %<br />
0 100<br />
S, in<br />
200<br />
qc(tsf)<br />
0<br />
100 200<br />
qc(tsf)<br />
4 2<br />
ev, %<br />
S, in<br />
0 100 200<br />
qc(tsf)<br />
-30<br />
-60<br />
-90<br />
-120<br />
-150<br />
Note: Magnitude= 8.0; P. G. A. = 0.75 g<br />
ELEVATION (FEET)<br />
#V<br />
Tip Resistance (tsf)<br />
Fugro CPT, 2000, Phase 3<br />
q c = Tip Resistance<br />
e = Volumetric Strain<br />
S = Settlement<br />
CPT Correlation Chart Robertson and Wride, 1990<br />
1000 _<br />
100 _<br />
10 _<br />
1 _<br />
0.01<br />
_<br />
Increasing<br />
Effective<br />
Stress<br />
1<br />
_<br />
7 Increasing 8<br />
OCR, Age,<br />
Cementation<br />
Increasing Ic<br />
0.1<br />
6<br />
Normally Consolidated<br />
5<br />
_<br />
1<br />
Friction Ratio (%)<br />
4<br />
Increasing<br />
Sensitivity<br />
9<br />
3<br />
Increasing<br />
OCR, Age<br />
2<br />
_<br />
10<br />
Volumetric<br />
Strain<br />
Zone<br />
1<br />
2<br />
3<br />
4<br />
5<br />
6<br />
7<br />
8<br />
9<br />
10 8<br />
Volumetric Strain (%)<br />
Settlement (in)<br />
6 4 2<br />
0 100 200 300<br />
Tip Resistance (tsf)<br />
Soil Behavior Type<br />
Liquefiable<br />
Zones<br />
Critical Tip<br />
Resistance<br />
CPT Tip<br />
Resistance<br />
Sensitive Fine-grained<br />
Peats<br />
Silty Clay to Clay<br />
Clayey Silt to Silty Clay<br />
Silty Sand to Sandy Silt<br />
Clean Sand to Silty Sand<br />
Gravelly Sand to Dense Sand<br />
Very Stiff Sand to Clayey Sand*<br />
Very Stiff Fine-Grained*<br />
LIQUEFACTION CROSS SECTION C-C'<br />
2% Probability of Exceedance<br />
in 50-Years Scenario<br />
San Francisco International <strong>Airport</strong><br />
San Francisco, California<br />
FIGURE DB-8c
Fugro Consultants, Inc.<br />
Project No. 04.79221200 <strong>ABAG</strong><br />
0<br />
D<br />
S29W<br />
00LC-66<br />
350 ft, East<br />
#V<br />
00LC-67<br />
24 ft, West<br />
#V<br />
00LC-70<br />
383 ft, East<br />
#V<br />
A-A'<br />
00LC-72<br />
278 ft, East<br />
#V<br />
B-B'<br />
00LC-74<br />
350 ft, East<br />
#V<br />
99LC-15<br />
42 ft, West<br />
00LC-76<br />
256 ft, East<br />
00LC-77<br />
17 ft, East<br />
99LC-04<br />
243 ft, East<br />
99LC-14<br />
23 ft, West<br />
#V #V<br />
#V #V #V<br />
D'<br />
N29E<br />
0<br />
Legend<br />
#V<br />
#V<br />
Fugro CPT, Phase 1, 1999<br />
Fugro CPT, 2000, Phase 2<br />
Cumulative<br />
Settlement<br />
Soil Type<br />
N:\Projects\04_2012\04_7922_1200_Caltrans<strong>Airport</strong>Recov\Outputs\2013_03_05_<strong>Report</strong>\mxd\Fig_DB08d_SFO_ProfileD_M8_00_a075_2475Yr.mxd, 03/21/13, dpollard<br />
ELEVATION (FEET)<br />
-30<br />
-60<br />
-90<br />
-120<br />
-150<br />
4 2<br />
ev, %<br />
S, in<br />
0 100 200<br />
qc(tsf)<br />
30 ft<br />
4 2<br />
ev, %<br />
S, in<br />
2<br />
0 100 200<br />
4<br />
ev, % qc(tsf)<br />
S, in<br />
0 100 200<br />
qc(tsf)<br />
1000 ft<br />
Vertical Exaggeration = 33.3X<br />
4 2<br />
ev, %<br />
S, in<br />
0 100 200<br />
qc(tsf)<br />
4 2<br />
ev, %<br />
S, in<br />
2 0<br />
100 200<br />
4<br />
ev, % qc(tsf)<br />
S, in<br />
0<br />
100 200<br />
qc(tsf)<br />
4 2<br />
ev, %<br />
S, in<br />
100 200<br />
4 2<br />
4 2 0<br />
0<br />
ev, 100 qc(tsf) 200<br />
ev, %<br />
% qc(tsf)<br />
S, in<br />
S, in<br />
0 100 200<br />
qc(tsf)<br />
4 2<br />
ev, %<br />
S, in<br />
0<br />
100 200<br />
qc(tsf)<br />
Note: Magnitude= 8.0; P. G. A. = 0.75 g<br />
-30<br />
-60<br />
-90<br />
-120<br />
-150<br />
ELEVATION (FEET)<br />
#V<br />
Tip Resistance (tsf)<br />
Fugro CPT, 2000, Phase 3<br />
q c = Tip Resistance<br />
e = Volumetric Strain<br />
S = Settlement<br />
CPT Correlation Chart Robertson and Wride, 1990<br />
1000 _<br />
100 _<br />
10 _<br />
1 _<br />
0.01<br />
_<br />
Increasing<br />
Effective<br />
Stress<br />
1<br />
_<br />
7 Increasing 8<br />
OCR, Age,<br />
Cementation<br />
Increasing Ic<br />
0.1<br />
6<br />
Normally Consolidated<br />
5<br />
_<br />
1<br />
Friction Ratio (%)<br />
4<br />
Increasing<br />
Sensitivity<br />
9<br />
3<br />
Increasing<br />
OCR, Age<br />
2<br />
_<br />
10<br />
Volumetric<br />
Strain<br />
Zone<br />
1<br />
2<br />
3<br />
4<br />
5<br />
6<br />
7<br />
8<br />
9<br />
10 8<br />
Volumetric Strain (%)<br />
Settlement (in)<br />
6 4 2<br />
0 100 200 300<br />
Tip Resistance (tsf)<br />
Soil Behavior Type<br />
Liquefiable<br />
Zones<br />
Critical Tip<br />
Resistance<br />
CPT Tip<br />
Resistance<br />
Sensitive Fine-grained<br />
Peats<br />
Silty Clay to Clay<br />
Clayey Silt to Silty Clay<br />
Silty Sand to Sandy Silt<br />
Clean Sand to Silty Sand<br />
Gravelly Sand to Dense Sand<br />
Very Stiff Sand to Clayey Sand*<br />
Very Stiff Fine-Grained*<br />
LIQUEFACTION CROSS SECTION D-D'<br />
2% Probability of Exceedance<br />
in 50-Years Scenario<br />
San Francisco International <strong>Airport</strong><br />
San Francisco, California<br />
FIGURE DB-8d
Fugro Consultants, Inc.<br />
Project No. 04.79221200 <strong>ABAG</strong><br />
6055000<br />
6060000<br />
6065000<br />
6070000<br />
Legend<br />
A<br />
08B-11<br />
&<<br />
&<<br />
08B-14<br />
&<<br />
Existing Borings<br />
Cross Section Location<br />
&<<br />
08B-10<br />
&<<br />
08B-12<br />
&<<br />
08B-13<br />
08B-15<br />
&<<br />
&<<br />
08B-16<br />
08B-18 &<<br />
08B-20<br />
Coordinates System: CA State Plane,<br />
Zone 3, NAD83, Feet<br />
N:\Projects\04_2012\04_7922_1200_Caltrans<strong>Airport</strong>Recov\Outputs\2013_03_05_<strong>Report</strong>\mxd\Fig_DC01_OAK_ExplorationLocationMap.mxd, 03/21/13, dpollard<br />
2090000<br />
2085000<br />
6055000<br />
11WL-2<br />
UB-10<br />
B<br />
08B-9<br />
&<<br />
&<<br />
11GMB-14<br />
11GMB-13<br />
11GMB-21<br />
11GMB-22<br />
&<<br />
&<<br />
11GMB-12<br />
&<<br />
11GB-20<br />
11GB-19<br />
11B-9<br />
00GB-4<br />
&<<br />
&< 08B-8<br />
&< &< &<<br />
&<<br />
11GMB-9<br />
&<<br />
&<<br />
&<<br />
08B-7<br />
11GMB-11 &<<br />
11B-7<br />
11GMB-10<br />
&<<br />
&<<br />
11GMB-8<br />
UB-9<br />
&<<br />
6060000<br />
&<<br />
08B-6<br />
UB-8&<<br />
08B-5<br />
&<<br />
11B-5<br />
&< 08B-4<br />
&<<br />
UB-7<br />
&<<br />
08B-17<br />
UB-3<br />
&<<br />
&<<br />
08B-1<br />
08B-3 11B-3 11B-1<br />
08B-2 &< &< &<<br />
&< &< 11WL-4<br />
&<<br />
UB-5<br />
&<<br />
B'<br />
UB-4 11WL-3<br />
6065000<br />
&<<br />
08B-19<br />
08B-21&<<br />
&<<br />
A'<br />
6070000<br />
2090000<br />
2085000<br />
Ü1:18,005<br />
0 750 1,500 3,000<br />
Feet<br />
PLAN VIEW<br />
Oakland International <strong>Airport</strong><br />
Oakland, California<br />
FIGURE DC-1
! ! ! ! ! ! !<br />
! ! ! ! ! !<br />
! ! ! ! ! ! !<br />
! ! ! ! ! !<br />
! ! ! ! ! ! !<br />
! ! ! ! ! !<br />
! ! ! ! ! ! !<br />
! ! ! ! ! !<br />
! ! ! ! ! ! !<br />
! ! ! ! ! !<br />
! ! ! ! ! ! !<br />
! ! ! ! ! !<br />
! ! ! ! ! ! !<br />
! ! ! ! ! !<br />
! ! ! ! ! ! !<br />
! ! ! ! ! !<br />
! ! ! ! ! ! !<br />
! ! ! ! ! !<br />
! ! ! ! ! ! !<br />
! ! ! ! ! !<br />
! ! ! ! ! !<br />
! ! ! ! ! !<br />
! ! ! ! ! !<br />
! ! ! ! ! !<br />
! ! ! ! ! !<br />
! ! ! ! ! !<br />
! ! ! ! ! !<br />
! ! ! ! ! !<br />
! ! ! ! ! !<br />
! ! ! ! ! !<br />
Fugro Consultants, Inc.<br />
Project No. 04.79221200 <strong>ABAG</strong><br />
0<br />
A<br />
N69W<br />
08B-10<br />
627 ft, South<br />
08B-11<br />
332 ft, North<br />
08B-14<br />
683 ft, North<br />
08B-12<br />
318 ft, South<br />
08B-13<br />
743 ft, South<br />
&< &< &< &< &<<br />
&< &< &< &< &< &<<br />
<br />
75 21<br />
<br />
<br />
<br />
18<br />
<br />
18 19<br />
29 5<br />
19 3<br />
11<br />
3<br />
2<br />
23<br />
7<br />
4<br />
<br />
19<br />
<br />
08B-15<br />
188 ft, North<br />
08B-16<br />
438 ft, South<br />
08B-17<br />
873 ft, South<br />
08B-18<br />
496 ft, North<br />
08B-19<br />
554 ft, South<br />
08B-20<br />
20 ft, North<br />
A'<br />
S69E<br />
<br />
0<br />
3 12<br />
<br />
<br />
3<br />
-10<br />
19<br />
<br />
2<br />
<br />
7<br />
<br />
10<br />
<br />
14<br />
<br />
<br />
<br />
4<br />
<br />
12<br />
-10<br />
26<br />
<br />
26<br />
20<br />
<br />
<br />
<br />
<br />
-20<br />
32<br />
<br />
23<br />
10<br />
-20<br />
N:\Projects\04_2012\04_7922_1200_Caltrans<strong>Airport</strong>Recov\Outputs\2013_03_05_<strong>Report</strong>\mxd\Fig_DC02a_OAK_ProfileA_Oakland.mxd, 03/21/13, dpollard<br />
DEPTH (FEET)<br />
-30<br />
-40<br />
-50<br />
-60<br />
Lean CLAY (CL)<br />
Lean to Fat CLAY (CL-CH)<br />
Fat CLAY (CH)<br />
Silt (ML)<br />
Poorly-Graded SAND (SP)<br />
Poorly-Graded SAND with Clay (SP-SC)<br />
<br />
32<br />
Poorly-Graded SAND with Silt (SP-SM)<br />
Well-Graded SAND (SW)<br />
Well-Graded SAND with Silt (SW-SM)<br />
Clayey SAND (SC)<br />
Clayey to Silty SAND (SC-SM)<br />
Silty SAND (SM)<br />
<br />
<br />
<br />
<br />
<br />
<br />
Fill<br />
<br />
Well-Graded GRAVEL (GW)<br />
Well-Graded GRAVEL with Silt (GW-GM)<br />
Silty Gravel (GM)<br />
Asphaltic Concrete<br />
10 SPT Blow Count<br />
<br />
Modified California Liner<br />
Sampler Blow Count<br />
-30<br />
-40<br />
-50<br />
-60<br />
75 Fines Content (% - plotted on left of boring)<br />
DEPTH (FEET)<br />
10 ft<br />
1000 ft<br />
Vertical Exaggeration = 100<br />
GEOTECHNICAL CROSS SECTION A-A'<br />
Oakland International <strong>Airport</strong><br />
Oakland, California<br />
FIGURE DC-2a
! ! ! ! ! !<br />
! ! ! ! ! ! !<br />
! ! ! ! ! !<br />
! ! ! ! ! ! !<br />
! ! ! ! ! !<br />
! ! ! ! ! ! !<br />
! ! ! ! ! !<br />
! ! ! ! ! ! !<br />
! ! ! ! ! !<br />
! ! ! ! ! ! !<br />
! ! ! ! ! !<br />
! ! ! ! ! !<br />
! ! ! ! ! ! !<br />
! ! ! ! ! !<br />
! ! ! ! ! ! !<br />
! ! ! ! ! !<br />
! ! ! ! ! ! !<br />
! ! ! ! ! !<br />
! ! ! ! ! ! !<br />
! ! ! ! ! !<br />
! ! ! ! ! ! !<br />
! ! ! ! ! !<br />
! ! ! ! ! !<br />
! ! ! ! ! !<br />
! ! ! ! ! !<br />
! ! ! ! ! !<br />
! ! ! ! ! !<br />
! ! ! ! ! !<br />
! ! ! ! ! !<br />
! ! ! ! ! !<br />
! ! ! ! ! !<br />
! ! ! ! ! !<br />
! ! ! ! ! !<br />
Fugro Consultants, Inc.<br />
Project No. 04.79221200 <strong>ABAG</strong><br />
N:\Projects\04_2012\04_7922_1200_Caltrans<strong>Airport</strong>Recov\Outputs\2013_03_05_<strong>Report</strong>\mxd\Fig_DC02b_OAK_ProfileB_Oakland.mxd, 03/21/13, dpollard<br />
DEPTH (FEET)<br />
0<br />
-10<br />
-20<br />
-30<br />
-40<br />
-50<br />
-60<br />
11WL-2<br />
166 ft, South<br />
UB-10<br />
493 ft, South<br />
11GB-20<br />
23 ft, North<br />
11GB-19<br />
21 ft, North<br />
11B-9<br />
134 ft, South<br />
B<br />
N50W &<<br />
6<br />
P<br />
P<br />
<br />
<br />
&<<br />
32<br />
24<br />
17<br />
5<br />
0<br />
0<br />
11<br />
9<br />
9<br />
0<br />
<br />
<br />
<br />
<br />
<br />
<br />
52<br />
23<br />
&< &<<br />
<br />
<br />
<br />
&<<br />
Lean CLAY (CL)<br />
15<br />
<br />
7<br />
<br />
11GMB-14<br />
267 ft, South<br />
Lean to Fat CLAY (CL-CH)<br />
Fat CLAY (CH)<br />
Silt (ML)<br />
Poorly-Graded SAND (SP)<br />
11GMB-21<br />
401 ft, South<br />
Poorly-Graded SAND with Clay (SP-SC)<br />
00GB-4<br />
2 ft, North<br />
11GMB-22<br />
416 ft, South<br />
11GMB-12<br />
289 ft, South<br />
11GMB-11<br />
307 ft, South<br />
11GMB-9<br />
150 ft, North<br />
&< &
Fugro Consultants, Inc.<br />
Project No. 04.79221200 <strong>ABAG</strong><br />
6055000<br />
6060000<br />
6065000<br />
6070000<br />
Legend<br />
08B-11<br />
08B-14<br />
Settlement (Inches)<br />
From borings ≥ 30 feet depth<br />
0 - 1<br />
Settlement (Inches)<br />
From borings 10 to 30 feet depth<br />
0 - 1<br />
08B-10<br />
(9)<br />
08B-12<br />
08B-15<br />
1 - 2<br />
2 - 3<br />
1 - 2<br />
2 - 3<br />
08B-13<br />
08B-16<br />
08B-18<br />
3 - 4<br />
3 - 4<br />
4 - 5<br />
4 - 5<br />
N:\Projects\04_2012\04_7922_1200_Caltrans<strong>Airport</strong>Recov\Outputs\2013_03_05_<strong>Report</strong>\mxd\Fig_DC03_OAK_LiquSettl_M7_80_a032_1906SF.mxd, 03/21/13, dpollard<br />
2090000<br />
2085000<br />
6055000<br />
11WL-2<br />
UB-10<br />
11GMB-14<br />
11GMB-22<br />
11B-9<br />
08B-9<br />
00GB-4<br />
08B-8<br />
11GMB-12<br />
11GMB-11<br />
11GMB-10<br />
11GMB-8<br />
(5)<br />
11GMB-9<br />
(6)<br />
08B-7<br />
11B-7<br />
UB-9<br />
UB-8<br />
6060000<br />
08B-6<br />
08B-5<br />
11B-5<br />
08B-4<br />
UB-7<br />
(6)<br />
08B-1<br />
08B-3<br />
08B-2<br />
UB-4<br />
6065000<br />
11B-3<br />
08B-17<br />
UB-3<br />
(5)<br />
11B-1<br />
11WL-4<br />
11WL-3<br />
UB-5<br />
08B-20<br />
08B-19<br />
08B-21<br />
6070000<br />
2090000<br />
2085000<br />
> 5<br />
(9) - Calculated<br />
Settlement<br />
Magnitude= 7.8; P. G. A. = 0.32 g<br />
Only borings with > 30 feet total depth<br />
are shown<br />
Coordinate Grid: CA State Plane, Zone 3,<br />
NAD83, Feet<br />
Ü1:18,005<br />
> 5<br />
(9) - Calculated<br />
Settlement<br />
0 750 1,500 3,000<br />
Feet<br />
LIQUEFACTION SETTLEMENT MAP<br />
1906 San Francisco Earthquake Scenario<br />
Oakland International <strong>Airport</strong><br />
Oakland, California<br />
FIGURE DC-3
Fugro Consultants, Inc.<br />
Project No. 04.79221200 <strong>ABAG</strong><br />
6055000<br />
6060000<br />
6065000<br />
6070000<br />
Legend<br />
08B-10<br />
(9)<br />
08B-11<br />
08B-14<br />
08B-12<br />
08B-13<br />
08B-15<br />
08B-16<br />
08B-18<br />
Settlement (Inches)<br />
From borings ≥ 30 feet depth<br />
0 - 1<br />
1 - 2<br />
2 - 3<br />
3 - 4<br />
Settlement (Inches)<br />
From borings 10 to 30 feet depth<br />
0 - 1<br />
1 - 2<br />
2 - 3<br />
3 - 4<br />
N:\Projects\04_2012\04_7922_1200_Caltrans<strong>Airport</strong>Recov\Outputs\2013_03_05_<strong>Report</strong>\mxd\Fig_DC04_OAK_LiquSettl_M7_26_a035_HRC_Fault.mxd, 03/21/13, dpollard<br />
2090000<br />
2085000<br />
6055000<br />
11WL-2<br />
UB-10 11B-9<br />
08B-21<br />
08B-9<br />
11GMB-14<br />
11GMB-22<br />
11GMB-12<br />
11GMB-11<br />
11GMB-10<br />
00GB-4<br />
11GMB-8<br />
(5)<br />
08B-8<br />
6060000<br />
11GMB-9<br />
(6)<br />
UB-9<br />
08B-7<br />
11B-7<br />
UB-8<br />
08B-6<br />
08B-5<br />
11B-5<br />
08B-4<br />
UB-7<br />
(6)<br />
08B-3<br />
08B-2<br />
UB-4<br />
6065000<br />
11B-3<br />
08B-1<br />
08B-17<br />
UB-3<br />
(5)<br />
11B-1<br />
11WL-4<br />
11WL-3<br />
UB-5<br />
08B-19<br />
08B-20<br />
6070000<br />
2090000<br />
2085000<br />
4 - 5<br />
> 5<br />
(9) - Calculated<br />
Settlement<br />
Magnitude= 7.26; P. G. A. = 0.35 g<br />
Only borings with > 30 feet total depth<br />
are shown<br />
Coordinate Grid: CA State Plane, Zone 3,<br />
NAD83, Feet<br />
Ü1:18,005<br />
4 - 5<br />
> 5<br />
(9) - Calculated<br />
Settlement<br />
0 750 1,500 3,000<br />
Feet<br />
LIQUEFACTION SETTLEMENT MAP<br />
Hayward-Rodgers Creek Scenario<br />
Oakland International <strong>Airport</strong><br />
Oakland, California<br />
FIGURE DC-4
Fugro Consultants, Inc.<br />
Project No. 04.79221200 <strong>ABAG</strong><br />
6055000<br />
6060000<br />
6065000<br />
6070000<br />
Legend<br />
08B-11<br />
08B-14<br />
Settlement (Inches)<br />
From borings ≥ 30 feet depth<br />
0 - 1<br />
Settlement (Inches)<br />
From borings 10 to 30 feet depth<br />
0 - 1<br />
08B-10<br />
(8)<br />
08B-12<br />
08B-13<br />
08B-15<br />
08B-16<br />
08B-18<br />
1 - 2<br />
2 - 3<br />
3 - 4<br />
1 - 2<br />
2 - 3<br />
3 - 4<br />
N:\Projects\04_2012\04_7922_1200_Caltrans<strong>Airport</strong>Recov\Outputs\2013_03_05_<strong>Report</strong>\mxd\Fig_DC05_OAK_LiquSettl_M6_71_a020_CGV_Fault.mxd, 03/21/13, dpollard<br />
2090000<br />
2085000<br />
6055000<br />
11WL-2<br />
11B-9<br />
UB-10<br />
08B-9<br />
00GB-4<br />
11GMB-14<br />
08B-8<br />
11GMB-22<br />
11GMB-9<br />
11GMB-12<br />
(6)<br />
08B-7<br />
11GMB-11<br />
11B-7<br />
11GMB-10<br />
UB-9<br />
11GMB-8<br />
(5)<br />
UB-8<br />
6060000<br />
08B-6<br />
08B-5<br />
11B-5<br />
08B-4<br />
UB-7<br />
(5)<br />
08B-3<br />
08B-2<br />
6065000<br />
11B-3<br />
08B-1<br />
UB-4<br />
UB-5<br />
08B-17<br />
UB-3<br />
(5)<br />
11B-1<br />
11WL-4<br />
11WL-3<br />
08B-20<br />
08B-19<br />
08B-21<br />
6070000<br />
2090000<br />
2085000<br />
4 - 5<br />
> 5<br />
(9) - Calculated<br />
Settlement<br />
Magnitude= 6.71; P. G. A. = 0.20 g<br />
Only borings with > 30 feet total depth<br />
are shown<br />
Coordinate Grid: CA State Plane, Zone 3,<br />
NAD83, Feet<br />
Ü1:18,005<br />
4 - 5<br />
> 5<br />
(9) - Calculated<br />
Settlement<br />
0 750 1,500 3,000<br />
Feet<br />
LIQUEFACTION SETTLEMENT MAP<br />
Concord-Green Valley Scenario<br />
Oakland International <strong>Airport</strong><br />
Oakland, California<br />
FIGURE DC-5
Fugro Consultants, Inc.<br />
Project No. 04.79221200 <strong>ABAG</strong><br />
6055000<br />
6060000<br />
6065000<br />
6070000<br />
Legend<br />
08B-11<br />
08B-14<br />
Settlement (Inches)<br />
From borings ≥ 30 feet depth<br />
0 - 1<br />
Settlement (Inches)<br />
From borings 10 to 30 feet depth<br />
0 - 1<br />
08B-10<br />
(9)<br />
08B-12<br />
08B-13<br />
08B-15<br />
08B-16<br />
08B-18<br />
1 - 2<br />
2 - 3<br />
3 - 4<br />
1 - 2<br />
2 - 3<br />
3 - 4<br />
N:\Projects\04_2012\04_7922_1200_Caltrans<strong>Airport</strong>Recov\Outputs\2013_03_05_<strong>Report</strong>\mxd\Fig_DC06_OAK_LiquSettl_M6_70_a049_475Yr.mxd, 03/21/13, dpollard<br />
2090000<br />
2085000<br />
6055000<br />
11WL-2<br />
11B-9<br />
UB-10<br />
(7)<br />
08B-9<br />
00GB-4<br />
11GMB-14<br />
08B-8<br />
11GMB-9<br />
11GMB-22<br />
(6)<br />
11GMB-12<br />
11GMB-11<br />
08B-7<br />
11GMB-10<br />
11B-7<br />
11GMB-8<br />
UB-9<br />
(5)<br />
UB-8<br />
6060000<br />
08B-6<br />
08B-5<br />
11B-5<br />
(5)<br />
08B-4<br />
UB-7<br />
(6)<br />
11B-3<br />
08B-1<br />
08B-3<br />
08B-2<br />
UB-4<br />
6065000<br />
08B-17<br />
UB-3<br />
(9)<br />
11B-1<br />
11WL-4<br />
11WL-3<br />
UB-5 (6)<br />
08B-20<br />
08B-19<br />
08B-21<br />
6070000<br />
2090000<br />
2085000<br />
4 - 5<br />
> 5<br />
(9) - Calculated<br />
Settlement<br />
Magnitude= 6.7; P. G. A. = 0.49 g<br />
Only borings with > 30 feet total depth<br />
are shown<br />
Coordinate Grid: CA State Plane, Zone 3,<br />
NAD83, Feet<br />
Ü1:18,005<br />
4 - 5<br />
> 5<br />
(9) - Calculated<br />
Settlement<br />
0 750 1,500 3,000<br />
Feet<br />
LIQUEFACTION SETTLEMENT MAP<br />
10% Probability of Exceedance<br />
in 50-Years Scenario<br />
Oakland International <strong>Airport</strong><br />
Oakland, California<br />
FIGURE DC-6
Fugro Consultants, Inc.<br />
Project No. 04.79221200 <strong>ABAG</strong><br />
6055000<br />
6060000<br />
6065000<br />
6070000<br />
Legend<br />
08B-10<br />
08B-11<br />
08B-14<br />
08B-12<br />
08B-13<br />
08B-15<br />
08B-16<br />
08B-18<br />
Settlement (Inches)<br />
From borings ≥ 30 feet depth<br />
0 - 1<br />
1 - 2<br />
2 - 3<br />
3 - 4<br />
Settlement (Inches)<br />
From borings 10 to 30 feet depth<br />
0 - 1<br />
1 - 2<br />
2 - 3<br />
3 - 4<br />
N:\Projects\04_2012\04_7922_1200_Caltrans<strong>Airport</strong>Recov\Outputs\2013_03_05_<strong>Report</strong>\mxd\Fig_DC07_OAK_LiquSettl_M6_70_a073_2475Yr.mxd, 03/21/13, dpollard<br />
2090000<br />
2085000<br />
6055000<br />
11WL-2<br />
UB-10<br />
11GB-20<br />
11GB-19<br />
11B-9<br />
11GMB-14<br />
08B-9<br />
00GB-4<br />
08B-8<br />
11GMB-22<br />
11GMB-12<br />
11GMB-9<br />
11GMB-11<br />
11GMB-10<br />
08B-7<br />
11B-7<br />
11GMB-8<br />
UB-9<br />
6060000<br />
08B-6<br />
08B-5<br />
UB-8<br />
11B-5<br />
08B-4<br />
UB-7<br />
11B-3<br />
08B-3<br />
08B-2<br />
UB-4<br />
6065000<br />
08B-17<br />
UB-3<br />
08B-1<br />
11B-1<br />
11WL-4<br />
11WL-3<br />
UB-5<br />
08B-20<br />
08B-19<br />
08B-21<br />
6070000<br />
2090000<br />
2085000<br />
4 - 5<br />
> 5<br />
(9) - Calculated<br />
Settlement<br />
Magnitude= 6.7; P. G. A. = 0.73 g<br />
Coordinate Grid: CA State Plane, Zone 3,<br />
NAD83, Feet<br />
Ü1:18,005<br />
4 - 5<br />
> 5<br />
(9) - Calculated<br />
Settlement<br />
0 750 1,500 3,000<br />
Feet<br />
LIQUEFACTION SETTLEMENT MAP<br />
2% Probability of Exceedance<br />
in 50-Years Scenario<br />
Oakland International <strong>Airport</strong><br />
Oakland, California<br />
FIGURE DC-7
Fugro Consultants, Inc.<br />
Project No. 04.79221200 <strong>ABAG</strong><br />
0<br />
A<br />
N69W<br />
08B-10<br />
627 ft, South<br />
08B-11<br />
332 ft, North<br />
08B-14<br />
683 ft, North<br />
08B-12<br />
318 ft, South<br />
08B-13<br />
743 ft, South<br />
! ! !! !<br />
! ! ! ! ! !<br />
<br />
3<br />
<br />
75<br />
21<br />
29 5<br />
2<br />
<br />
<br />
23<br />
08B-15<br />
188 ft, North<br />
<br />
19 3<br />
7<br />
08B-16<br />
438 ft, South<br />
<br />
19<br />
08B-17<br />
873 ft, South<br />
18<br />
11<br />
<br />
08B-18<br />
496 ft, North<br />
<br />
4<br />
18<br />
08B-19<br />
554 ft, South<br />
19<br />
<br />
08B-20<br />
20 ft, North<br />
A'<br />
S69E<br />
<br />
0<br />
N:\Projects\04_2012\04_7922_1200_Caltrans<strong>Airport</strong>Recov\Outputs\2013_03_05_<strong>Report</strong>\mxd\Fig_DC08a_OAK_ProfileA_M6_70_a073_2475Yr.mxd, 03/21/13, dpollard<br />
DEPTH (FEET)<br />
10<br />
-10<br />
-20<br />
8 6<br />
-30<br />
-40<br />
-50<br />
-60<br />
4<br />
10<br />
2<br />
19<br />
8<br />
0<br />
<br />
2<br />
6 4<br />
<br />
32<br />
102<br />
80<br />
<br />
<br />
0 20 10 40 8 606<br />
Blow Counts<br />
<br />
7<br />
10 <br />
<br />
6 0 4 202<br />
100 40 8 0 6 604<br />
20 2 400<br />
060<br />
20 40 60<br />
Blow Counts Blow Counts<br />
Blow Counts<br />
10 8 6 4 2<br />
4<br />
2<br />
0<br />
10 ft<br />
26<br />
<br />
3 12<br />
<br />
14<br />
32<br />
0 20 40 60<br />
Blow Counts<br />
1000 ft<br />
Vertical Exaggeration = 100<br />
10<br />
8<br />
0<br />
6<br />
10<br />
26<br />
<br />
0 20 40 60<br />
Blow Counts<br />
20 <br />
10 8 6<br />
4<br />
2<br />
8<br />
0<br />
6<br />
23<br />
4<br />
2<br />
0<br />
<br />
0 20 40 60<br />
Blow Counts<br />
4<br />
3<br />
<br />
4<br />
0 20 40 60<br />
Blow Counts<br />
2<br />
0<br />
10<br />
<br />
0 2010<br />
840 6 604<br />
Blow Counts<br />
8<br />
6<br />
4<br />
2<br />
0<br />
<br />
2 0<br />
10<br />
<br />
12<br />
<br />
0 20 40 60<br />
Blow Counts<br />
Note: Magnitude= 6.7; P. G. A. = 0.73 g<br />
-10<br />
<br />
0 20 40 60<br />
Blow Counts<br />
-20<br />
-30<br />
-40<br />
-50<br />
-60<br />
DEPTH (FEET)<br />
Cummulative<br />
Settlement<br />
Volumetric<br />
Strain<br />
SOIL BORING LITHOLOGY<br />
WITH LIQUEFACTION<br />
EVALUATION<br />
&<<br />
39<br />
43<br />
30<br />
<br />
24<br />
<br />
10<br />
15<br />
8 6 4 2 0 0 Blow 20 Counts<br />
40 60<br />
10 8 6 4 2 0 0 20 40 60<br />
Volumetric Strain (%) Blow Counts<br />
Settlement (in)<br />
18<br />
9<br />
P<br />
P<br />
Liquefiable<br />
Zone<br />
Critical SPT<br />
N-Value<br />
SPT<br />
N-Value<br />
LIQUEFACTION CROSS SECTION A-A'<br />
2% Probability of Exceedance<br />
in 50-Years Scenario<br />
Oakland International <strong>Airport</strong><br />
Oakland, California<br />
PLATE DC-8a
Fugro Consultants, Inc.<br />
Project No. 04.79221200 <strong>ABAG</strong><br />
0<br />
11WL-2<br />
166 ft, South<br />
B<br />
N50W<br />
&<<br />
6<br />
11GB-20<br />
23 ft, North<br />
11GB-19<br />
21 ft, North<br />
11B-9<br />
134 ft, South<br />
&< &<<br />
<br />
<br />
11GMB-14<br />
267 ft, South<br />
00GB-4<br />
2 ft, North<br />
11GMB-9<br />
150 ft, North<br />
&< &< &<<br />
&<<br />
15<br />
7<br />
39<br />
43<br />
4<br />
08B-7<br />
219 ft, South<br />
&< &<<br />
11B-7<br />
180 ft, South<br />
<br />
<br />
3<br />
08B-6<br />
162 ft, North<br />
&<<br />
<br />
11B-5<br />
220 ft, South<br />
&<<br />
18<br />
08B-4<br />
136 ft, North<br />
&<<br />
10<br />
11B-3<br />
252 ft, South<br />
08B-2<br />
103 ft, South<br />
&<<br />
8 49<br />
<br />
08B-1<br />
93 ft, North<br />
&<<br />
&< &
Fugro Consultants, Inc.<br />
Project No. 04.79221200 <strong>ABAG</strong><br />
6108000<br />
6110000<br />
6112000<br />
6114000<br />
6116000<br />
6118000<br />
Legend<br />
&<<br />
Existing Borings<br />
N:\Projects\04_2012\04_7922_1200_Caltrans<strong>Airport</strong>Recov\Outputs\2013_03_05_<strong>Report</strong>\mxd\Fig_DD01_BUC_ExplorationLocationMap.mxd, 03/21/13, dpollard<br />
2184000<br />
2186000<br />
2188000<br />
2190000<br />
6108000<br />
6110000<br />
KA83-3<br />
KA83-2<br />
KA83-PP1 &< &< &< &<<br />
&< KA83-PB2<br />
30<br />
23.5<br />
20<br />
&< &< 25 KA83-PP3<br />
KA83-PB5 30<br />
&<<br />
&<<br />
20<br />
30 KA83-PB4<br />
KA83-PP4 25<br />
20<br />
KA81-103<br />
KA81-1<br />
&<<br />
50 KA81-101<br />
&<<br />
&<<br />
10<br />
25<br />
KA81-4<br />
KL87-47<br />
KA81-5<br />
&<<br />
KA81-102<br />
KA81-2 7.5<br />
&<<br />
&< &< &< &< KL87-46<br />
50<br />
KA81-8 50&<<br />
38 40 7.5<br />
KA81-3<br />
&< 20<br />
&< &< &<<br />
KA81-6<br />
4020<br />
30.5 50<br />
KA90-6 KA90-1<br />
KA81-9<br />
KL87-51<br />
PRK11-8<br />
KA81-7 &< KL87-45<br />
&<<br />
7.5<br />
&<<br />
&<<br />
7<br />
KA83-A1&<<br />
&< KA90-5<br />
8<br />
PRK11-7<br />
15 6<br />
&< &<<br />
&<<br />
KA83-A3&
Fugro Consultants, Inc.<br />
Project No. 04.79221200 <strong>ABAG</strong><br />
KL87-20<br />
222 ft, East<br />
KL87-21<br />
9 ft, East<br />
KL87-22<br />
42 ft, East<br />
KL87-25<br />
20 ft, East<br />
KL87-26<br />
28 ft, East<br />
KL87-28<br />
42 ft, East<br />
KL87-87<br />
C-C'<br />
26 ft, East<br />
KL87-30<br />
132 ft, West<br />
KL87-55<br />
23 ft, East<br />
KL87-52<br />
244 ft, East<br />
KL87-51<br />
118 ft, West<br />
KA81-102<br />
245 ft, West<br />
KA81-101<br />
198 ft, West<br />
0<br />
A<br />
S24W<br />
&< &< &< &< &< &< &< &< &<<br />
&<<br />
&<<br />
&<<br />
&<<br />
A'<br />
N24E<br />
0<br />
-10<br />
-10<br />
-20<br />
-20<br />
-30<br />
10 ft<br />
-30<br />
-40<br />
-40<br />
400 ft<br />
Vertical Exaggeration = 40.0X<br />
-50<br />
-50<br />
-60<br />
-60<br />
DEPTH (FEET)<br />
DEPTH (FEET)<br />
D-D'<br />
25<br />
40<br />
20<br />
92<br />
10<br />
14<br />
11<br />
21<br />
3<br />
8<br />
4<br />
4<br />
8<br />
6<br />
5<br />
8<br />
12<br />
8<br />
7<br />
16<br />
39<br />
Legend<br />
Lean CLAY (CL)<br />
Lean to Fat CLAY (CL-CH)<br />
Fat CLAY (CH)<br />
Well-Graded SAND (SW)<br />
Clayey SAND (SC)<br />
Silty SAND (SM)<br />
Silty Gravel (GM)<br />
Low-Plasticity Organic (OL)<br />
Asphaltic Concrete<br />
10 SPT Blow Count<br />
Modified California Liner<br />
Sampler Blow Count<br />
GEOTECHNICAL CROSS SECTION A-A'<br />
Buchanan <strong>Airport</strong><br />
Concord, California<br />
Silt (ML)<br />
! ! !<br />
! ! !<br />
! ! !<br />
! ! !<br />
! ! !<br />
! ! !<br />
75 Fines Content (% - plotted on left of boring)<br />
Poorly-Graded GRAVEL (GP)<br />
FIGURE DD-2a<br />
N:\Projects\04_2012\04_7922_1200_Caltrans<strong>Airport</strong>Recov\Outputs\2013_03_05_<strong>Report</strong>\mxd\Fig_DD02a_BUC_ProfileA.mxd, 03/21/13, dpollard
Fugro Consultants, Inc.<br />
Project No. 04.79221200 <strong>ABAG</strong><br />
PRK11-1<br />
18 ft, East<br />
PRK11-2<br />
55 ft, West<br />
PRK11-3<br />
63 ft, East<br />
PRK11-4<br />
44 ft, West<br />
KL87-88<br />
243 ft, East<br />
KL87-29<br />
157 ft, West<br />
PRK11-5<br />
33 ft, East<br />
PRK11-6<br />
13 ft, West<br />
KL87-76<br />
63 ft, East<br />
PRK11-7<br />
D-D'<br />
18 ft, East<br />
PRK11-8<br />
24 ft, West<br />
0<br />
B<br />
S24W<br />
&< &< &< &< &<<br />
&< &< &< &<<br />
&< &<<br />
B'<br />
N24E<br />
0<br />
-10<br />
-10<br />
-20<br />
-20<br />
-30<br />
-30<br />
10 ft<br />
DEPTH (FEET)<br />
DEPTH (FEET)<br />
C-C'<br />
57<br />
29<br />
-40<br />
-40<br />
400 ft<br />
Vertical Exaggeration = 40.0X<br />
-50<br />
-50<br />
-60<br />
-60<br />
Legend<br />
Lean CLAY (CL)<br />
Lean to Fat CLAY (CL-CH)<br />
Fat CLAY (CH)<br />
Well-Graded SAND (SW)<br />
Clayey SAND (SC)<br />
Silty SAND (SM)<br />
Silty Gravel (GM)<br />
Low-Plasticity Organic (OL)<br />
Asphaltic Concrete<br />
10 SPT Blow Count<br />
Modified California Liner<br />
Sampler Blow Count<br />
GEOTECHNICAL CROSS SECTION B-B'<br />
Buchanan <strong>Airport</strong><br />
Concord, California<br />
Silt (ML)<br />
! ! !<br />
! ! !<br />
! ! !<br />
! ! !<br />
! ! !<br />
75 Fines Content (% - plotted on left of boring)<br />
Poorly-Graded GRAVEL (GP)<br />
FIGURE DD-2b<br />
N:\Projects\04_2012\04_7922_1200_Caltrans<strong>Airport</strong>Recov\Outputs\2013_03_05_<strong>Report</strong>\mxd\Fig_DD02b_BUC_ProfileB.mxd, 03/21/13, dpollard
0<br />
C'<br />
N24W<br />
-10<br />
-20<br />
DEPTH (FEET)<br />
-30<br />
-40<br />
Fugro Consultants, Inc.<br />
Project No. 04.79221200 <strong>ABAG</strong><br />
-50<br />
-60<br />
GEOTECHNICAL CROSS SECTION C-C'<br />
Buchanan <strong>Airport</strong><br />
Concord, California<br />
KL87-16<br />
2 ft, East<br />
KL87-88<br />
69 ft, West<br />
PRK11-5<br />
151 ft, East<br />
KL87-29<br />
78 ft, West<br />
KL87-87<br />
A-A'<br />
1 ft, East<br />
KL87-30<br />
60 ft, West<br />
KL87-55<br />
227 ft, East<br />
KL87-44<br />
18 ft, West<br />
KA90-2<br />
257 ft, West<br />
KA83-103<br />
192 ft, West<br />
KA90-1<br />
194 ft, West<br />
KL87-45<br />
22 ft, West<br />
KA81-3<br />
84 ft, West<br />
KA81-2<br />
120 ft, West<br />
KA81-1<br />
2 ft, East<br />
0<br />
&< &< &< &< &< &< &<<br />
&< &< &< &< &<<br />
&<<br />
&<<br />
&<<br />
-10<br />
-20<br />
-30<br />
10 ft<br />
DEPTH (FEET)<br />
B-B'<br />
C<br />
S24E<br />
<br />
57<br />
40<br />
20<br />
5<br />
<br />
<br />
39<br />
<br />
9<br />
<br />
5<br />
<br />
15<br />
20<br />
8<br />
11<br />
20<br />
7<br />
14<br />
31<br />
2<br />
<br />
<br />
98<br />
<br />
2<br />
7<br />
<br />
70 15<br />
1<br />
<br />
<br />
<br />
27<br />
3<br />
3<br />
<br />
99<br />
<br />
<br />
<br />
8<br />
5<br />
12*<br />
12<br />
3<br />
8<br />
-40<br />
<br />
9<br />
400 ft<br />
Vertical Exaggeration = 40.0X<br />
9<br />
-50<br />
12<br />
-60<br />
Legend<br />
Lean CLAY (CL)<br />
Well-Graded SAND (SW)<br />
Silty Gravel (GM)<br />
10 SPT Blow Count<br />
Lean to Fat CLAY (CL-CH)<br />
Fat CLAY (CH)<br />
FIGURE DD-2c<br />
Clayey SAND (SC)<br />
Silty SAND (SM)<br />
Low-Plasticity Organic (OL)<br />
Asphaltic Concrete<br />
Modified California Liner<br />
Sampler Blow Count<br />
Silt (ML)<br />
! ! !<br />
! ! !<br />
! ! !<br />
! ! !<br />
! ! !<br />
! ! !<br />
Poorly-Graded GRAVEL (GP)<br />
75 Fines Content (% - plotted on left of boring)<br />
N:\Projects\04_2012\04_7922_1200_Caltrans<strong>Airport</strong>Recov\Outputs\2013_03_05_<strong>Report</strong>\mxd\Fig_DD02c_BUC_ProfileC.mxd, 03/21/13, dpollard
Fugro Consultants, Inc.<br />
Project No. 04.79221200 <strong>ABAG</strong><br />
0<br />
D<br />
N26W<br />
KA81-104<br />
180 ft, East<br />
KA81-105<br />
140 ft, West<br />
&
Fugro Consultants, Inc.<br />
Project No. 04.79221200 <strong>ABAG</strong><br />
6108000<br />
6110000<br />
6112000<br />
6114000<br />
6116000<br />
6118000<br />
Legend<br />
Settlement (Inches)<br />
From borings ≥ 30 feet depth<br />
Settlement (Inches)<br />
From borings 10 to 30 feet depth<br />
0 - 1<br />
0 - 1<br />
2190000<br />
KA81-105<br />
KA81-104<br />
2190000<br />
1 - 2<br />
2 - 3<br />
1 - 2<br />
2 - 3<br />
N:\Projects\04_2012\04_7922_1200_Caltrans<strong>Airport</strong>Recov\Outputs\2013_03_05_<strong>Report</strong>\mxd\Fig_DD03_BUC_LiquSettl_M7_80_a015_1906SF.mxd, 03/21/13, dpollard<br />
2188000<br />
2186000<br />
2184000<br />
6108000<br />
KA83-2<br />
KA83-PP1<br />
KA83-1<br />
KA83-PB5<br />
KA83-PP4<br />
6110000<br />
KA81-5<br />
KA81-8<br />
KA81-6<br />
KA81-9<br />
KA81-7<br />
KA83-A3<br />
KA83-A2<br />
KA90-3<br />
KA83-3<br />
KA83-PB2<br />
KA83-PP3<br />
KA83-PB4<br />
KA81-1<br />
KA81-4<br />
KA81-2<br />
KA81-3<br />
KA83-A1 KA90-1<br />
KA83-103<br />
KA83-101<br />
KA83-102<br />
6112000<br />
KA90-2<br />
KA81-103<br />
KA81-101<br />
KA81-102<br />
6114000<br />
6116000<br />
6118000<br />
2188000<br />
2186000<br />
2184000<br />
3 - 4<br />
4 - 5<br />
> 5<br />
KA = Kaldveer Associates<br />
KL = Kleinfelder Associates<br />
PRK = Parikh Consultants<br />
Magnitude= 7.8; P. G. A. = 0.15 g<br />
Only borings with > 30 feet total depth<br />
are shown<br />
Coordinate Grid: CA State Plane, Zone 3,<br />
NAD83, Feet<br />
Ü1:12,003<br />
3 - 4<br />
4 - 5<br />
> 5<br />
0 500 1,000 2,000<br />
Feet<br />
LIQUEFACTION SETTLEMENT MAP<br />
1906 San Francisco Earthquake Scenario<br />
Buchanan <strong>Airport</strong><br />
Concord, California<br />
FIGURE DD-3
Fugro Consultants, Inc.<br />
Project No. 04.79221200 <strong>ABAG</strong><br />
6108000<br />
6110000<br />
6112000<br />
6114000<br />
6116000<br />
6118000<br />
Legend<br />
Settlement (Inches)<br />
From borings ≥ 30 feet depth<br />
Settlement (Inches)<br />
From borings 10 to 30 feet depth<br />
0 - 1<br />
0 - 1<br />
2190000<br />
KA81-105<br />
KA81-104<br />
2190000<br />
1 - 2<br />
2 - 3<br />
1 - 2<br />
2 - 3<br />
N:\Projects\04_2012\04_7922_1200_Caltrans<strong>Airport</strong>Recov\Outputs\2013_03_05_<strong>Report</strong>\mxd\Fig_DD04_BUC_LiquSettl_M7_26_a024_HRC_Fault.mxd, 03/21/13, dpollard<br />
2188000<br />
2186000<br />
2184000<br />
6108000<br />
KA81-5<br />
KA81-8<br />
KA81-6<br />
KA81-9<br />
KA81-7<br />
KA83-A3<br />
KA83-A2<br />
KA90-3<br />
KA83-2<br />
KA83-3<br />
KA83-PP1 KA83-PB2<br />
KA83-PP3<br />
KA83-PP4<br />
KA83-PB4<br />
KA83-PB5<br />
6110000<br />
KA81-1<br />
KA81-4<br />
KA81-2<br />
KA83-1<br />
KA81-3<br />
KA83-A1<br />
6112000<br />
KA90-1<br />
KA83-103<br />
KA83-101<br />
KA83-102<br />
KA90-2<br />
KA81-103<br />
KA81-101<br />
KA81-102<br />
6114000<br />
6116000<br />
6118000<br />
2188000<br />
2186000<br />
2184000<br />
3 - 4<br />
4 - 5<br />
> 5<br />
KA = Kaldveer Associates<br />
KL = Kleinfelder Associates<br />
PRK = Parikh Consultants<br />
Magnitude= 7.26; P. G. A. = 0.24 g<br />
Only borings with > 30 feet total depth<br />
are shown<br />
Coordinate Grid: CA State Plane, Zone 3,<br />
NAD83, Feet<br />
Ü1:12,003<br />
3 - 4<br />
4 - 5<br />
> 5<br />
0 500 1,000 2,000<br />
Feet<br />
LIQUEFACTION SETTLEMENT MAP<br />
Hayward-Rodgers Creek Scenario<br />
Buchanan <strong>Airport</strong><br />
Concord, California<br />
FIGURE DD-4
Fugro Consultants, Inc.<br />
Project No. 04.79221200 <strong>ABAG</strong><br />
6108000<br />
6110000<br />
6112000<br />
6114000<br />
6116000<br />
6118000<br />
Legend<br />
Settlement (Inches)<br />
From borings ≥ 30 feet depth<br />
Settlement (Inches)<br />
From borings 10 to 30 feet depth<br />
0 - 1<br />
0 - 1<br />
2190000<br />
KA81-105<br />
KA81-104<br />
2190000<br />
1 - 2<br />
2 - 3<br />
1 - 2<br />
2 - 3<br />
N:\Projects\04_2012\04_7922_1200_Caltrans<strong>Airport</strong>Recov\Outputs\2013_03_05_<strong>Report</strong>\mxd\Fig_DD05_BUC_LiquSettl_M6_71_a053_CGV_Fault.mxd, 03/21/13, dpollard<br />
2188000<br />
2186000<br />
2184000<br />
6108000<br />
KA81-1<br />
KA81-5<br />
KA81-4<br />
KA81-8<br />
KA81-2<br />
KA81-6<br />
KA81-3<br />
KA81-9<br />
KA81-7<br />
KA90-1<br />
KA83-103<br />
KA83-A1<br />
KA83-101<br />
KA83-A3<br />
KA83-102<br />
KA83-A2<br />
KA90-2<br />
KA90-3<br />
KA83-3<br />
KA83-2<br />
KA83-PB2<br />
KA83-PP1<br />
KA83-1<br />
KA83-PP3<br />
KA83-PB5<br />
KA83-PB4<br />
KA83-PP4<br />
6110000<br />
6112000<br />
KA81-103<br />
KA81-101<br />
KA81-102<br />
6114000<br />
6116000<br />
6118000<br />
2188000<br />
2186000<br />
2184000<br />
3 - 4<br />
4 - 5<br />
> 5<br />
KA = Kaldveer Associates<br />
KL = Kleinfelder Associates<br />
PRK = Parikh Consultants<br />
Magnitude= 6.71; P. G. A. = 0.53 g<br />
Only borings with > 30 feet total depth<br />
are shown<br />
Coordinate Grid: CA State Plane, Zone 3,<br />
NAD83, Feet<br />
Ü1:12,003<br />
3 - 4<br />
4 - 5<br />
> 5<br />
0 500 1,000 2,000<br />
Feet<br />
LIQUEFACTION SETTLEMENT MAP<br />
Concord-Green Valley Scenario<br />
Buchanan <strong>Airport</strong><br />
Concord, California<br />
FIGURE DD-5
Fugro Consultants, Inc.<br />
Project No. 04.79221200 <strong>ABAG</strong><br />
6108000<br />
6110000<br />
6112000<br />
6114000<br />
6116000<br />
6118000<br />
Legend<br />
Settlement (Inches)<br />
From borings ≥ 30 feet depth<br />
0 - 1<br />
Settlement (Inches)<br />
From borings 10 to 30 feet depth<br />
0 - 1<br />
2190000<br />
KA81-105<br />
KA81-104<br />
2190000<br />
1 - 2<br />
2 - 3<br />
1 - 2<br />
2 - 3<br />
N:\Projects\04_2012\04_7922_1200_Caltrans<strong>Airport</strong>Recov\Outputs\2013_03_05_<strong>Report</strong>\mxd\Fig_DD06_BUC_LiquSettl_M6_60_a054_475Yr.mxd, 03/21/13, dpollard<br />
2184000<br />
2186000<br />
2188000<br />
6108000<br />
KA83-2<br />
KA83-PP1<br />
KA83-1<br />
KA83-PB5<br />
KA83-PP4<br />
6110000<br />
KA81-5<br />
KA81-8<br />
KA81-6<br />
KA81-9<br />
KA81-7<br />
KA83-A1<br />
KA83-A3<br />
KA83-A2<br />
KA90-3<br />
KA83-3<br />
KA83-PB2<br />
KA83-PP3<br />
KA83-PB4<br />
KA81-1<br />
KA81-4<br />
KA81-2<br />
KA81-3<br />
6112000<br />
KA90-1<br />
KA83-103<br />
KA83-101<br />
KA83-102<br />
KA90-2<br />
KA81-103<br />
KA81-101<br />
KA81-102<br />
6114000<br />
6116000<br />
6118000<br />
2184000<br />
2186000<br />
2188000<br />
3 - 4<br />
4 - 5<br />
> 5<br />
KA = Kaldveer Associates<br />
KL = Kleinfelder Associates<br />
PRK = Parikh Consultants<br />
Magnitude= 6.6; P. G. A. = 0.54 g<br />
Only borings with > 30 feet total depth<br />
are shown<br />
Coordinate Grid: CA State Plane, Zone 3,<br />
NAD83, Feet<br />
Ü1:12,003<br />
3 - 4<br />
4 - 5<br />
> 5<br />
0 500 1,000 2,000<br />
Feet<br />
LIQUEFACTION SETTLEMENT MAP<br />
10% Probability of Exceedance<br />
in 50-Years Scenario<br />
Buchanan <strong>Airport</strong><br />
Concord, California<br />
FIGURE DD-6
Fugro Consultants, Inc.<br />
Project No. 04.79221200 <strong>ABAG</strong><br />
6108000<br />
6110000<br />
6112000<br />
6114000<br />
6116000<br />
6118000<br />
Legend<br />
Settlement (Inches)<br />
From borings ≥ 30 feet depth<br />
Settlement (Inches)<br />
From borings 10 to 30 feet depth<br />
0 - 1<br />
0 - 1<br />
2190000<br />
KA81-105<br />
KA81-104<br />
2190000<br />
1 - 2<br />
2 - 3<br />
1 - 2<br />
2 - 3<br />
N:\Projects\04_2012\04_7922_1200_Caltrans<strong>Airport</strong>Recov\Outputs\2013_03_05_<strong>Report</strong>\mxd\Fig_DD07_BUC_LiquSettl_M6_60_a087_2475Yr.mxd, 03/21/13, dpollard<br />
2188000<br />
2186000<br />
2184000<br />
6108000<br />
KA83-2<br />
KA83-PP1<br />
KA83-1<br />
KA83-PB5<br />
KA83-PP4<br />
6110000<br />
KA81-5<br />
KA81-8<br />
KA81-6<br />
KA81-9<br />
KA81-7<br />
KA83-A1<br />
KA83-A3<br />
KA83-A2<br />
KA90-3<br />
KA83-3<br />
KA83-PB2<br />
KA83-PP3<br />
KA83-PB4<br />
KA81-1<br />
KA81-4<br />
KA81-2<br />
KA90-2<br />
KA83-102<br />
6112000<br />
KA81-3<br />
KA81-103<br />
KA81-101<br />
KA81-102<br />
KA90-1<br />
KA83-103<br />
KA83-101<br />
6114000<br />
6116000<br />
6118000<br />
2188000<br />
2186000<br />
2184000<br />
3 - 4<br />
4 - 5<br />
> 5<br />
KA = Kaldveer Associates<br />
KL = Kleinfelder Associates<br />
PRK = Parikh Consultants<br />
Magnitude= 6.6; P. G. A. = 0.87 g<br />
Only borings with > 30 feet total depth<br />
are shown<br />
Coordinate Grid: CA State Plane, Zone 3,<br />
NAD83, Feet<br />
Ü1:12,003<br />
3 - 4<br />
4 - 5<br />
> 5<br />
0 500 1,000 2,000<br />
Feet<br />
LIQUEFACTION SETTLEMENT MAP<br />
2% Probability of Exceedance<br />
in 50-Years Scenario<br />
Buchanan <strong>Airport</strong><br />
Concord, California<br />
FIGURE DD-7
Fugro Consultants, Inc.<br />
Project No. 04.79221200 <strong>ABAG</strong><br />
0<br />
A<br />
S24W<br />
KL87-20<br />
222 ft, East<br />
KL87-21<br />
9 ft, East<br />
KL87-22<br />
42 ft, East<br />
KL87-25<br />
20 ft, East<br />
&< &< &< &< &< &< &< &< &<<br />
&<<br />
&<<br />
25<br />
KL87-26<br />
28 ft, East<br />
KL87-28<br />
42 ft, East<br />
KL87-87<br />
C-C'<br />
26 ft, East<br />
KL87-30<br />
132 ft, West<br />
KL87-55<br />
23 ft, East<br />
40<br />
20<br />
KL87-52<br />
244 ft, East<br />
KL87-51<br />
118 ft, West<br />
92<br />
D-D'<br />
KA81-102<br />
245 ft, West<br />
&<<br />
10<br />
KA81-101<br />
198 ft, West<br />
&<<br />
14<br />
A'<br />
N24E<br />
0<br />
11<br />
21<br />
-10<br />
10<br />
8<br />
6<br />
4<br />
2<br />
0<br />
10<br />
8<br />
6<br />
0 20 40 60<br />
Blow Counts<br />
4<br />
2<br />
0<br />
0 20 40 60<br />
Blow Counts<br />
10 8 6 4 2<br />
0<br />
10<br />
8<br />
6<br />
0 20 40 60<br />
Blow Counts<br />
4<br />
2<br />
0<br />
0 20 40 60<br />
Blow Counts<br />
10 8 6 4 2<br />
0<br />
10<br />
8<br />
0 20 40 60<br />
Blow Counts<br />
6<br />
4<br />
2<br />
0<br />
10<br />
0 20 40 60<br />
Blow Counts<br />
10 8 610<br />
4 8 2 6 0 4 02<br />
10 208<br />
0 640 20 4 60 2 40010<br />
860<br />
0 6 204<br />
2 40 0 600 20 40 60<br />
8 6 4 2 0 0 20 Blow 40 Counts 60Blow Counts<br />
Blow Counts<br />
Blow Counts<br />
Blow Counts<br />
3<br />
8<br />
-10<br />
4<br />
4<br />
-20<br />
8<br />
6<br />
-20<br />
N:\Projects\04_2012\04_7922_1200_Caltrans<strong>Airport</strong>Recov\Outputs\2013_03_05_<strong>Report</strong>\mxd\Fig_DD08a_BUC_ProfileA_M6_60_a087_2475Yr.mxd, 03/21/13, dpollard<br />
DEPTH (FEET)<br />
-30<br />
-40<br />
-50<br />
-60<br />
10 ft<br />
400 ft<br />
Vertical Exaggeration = 40.0X<br />
Cummulative<br />
Settlement<br />
Volumetric<br />
Strain<br />
SOIL BORING LITHOLOGY<br />
WITH LIQUEFACTION<br />
EVALUATION<br />
&<<br />
39<br />
43<br />
30<br />
<br />
24<br />
<br />
18<br />
9<br />
P<br />
15<br />
10 8 6 4 2 0 0 20 40 60<br />
Blow Counts<br />
10 8 6 4 2 0 0 20 40 60<br />
Volumetric Strain (%) Blow Counts<br />
Settlement (in)<br />
P<br />
Liquefiable<br />
Zone<br />
Critical SPT<br />
N-Value<br />
SPT<br />
N-Value<br />
Note: Magnitude= 6.6; P. G. A. = 0.87 g<br />
10<br />
8<br />
6<br />
4<br />
2<br />
10<br />
0<br />
5<br />
8 6<br />
12<br />
8<br />
7<br />
16<br />
4<br />
2<br />
39<br />
0 20 40 60<br />
Blow Counts<br />
0<br />
8<br />
0 20 40 60<br />
Blow Counts<br />
LIQUEFACTION CROSS SECTION A-A'<br />
2% Probability of Exceedance<br />
in 50-Years Scenario<br />
Buchanan <strong>Airport</strong><br />
Concord, California<br />
FIGURE DD-8a<br />
-30<br />
-40<br />
-50<br />
-60
Fugro Consultants, Inc.<br />
Project No. 04.79221200 <strong>ABAG</strong><br />
0<br />
B<br />
S24W<br />
PRK11-1<br />
18 ft, East<br />
PRK11-2<br />
55 ft, West<br />
PRK11-3<br />
63 ft, East<br />
PRK11-4<br />
44 ft, West<br />
&< &< &< &< &<<br />
&< &< &< &<<br />
&< &<<br />
KL87-88<br />
243 ft, East<br />
C-C'<br />
KL87-29<br />
157 ft, West<br />
57<br />
PRK11-5<br />
33 ft, East<br />
PRK11-6<br />
13 ft, West<br />
KL87-76<br />
63 ft, East<br />
29<br />
PRK11-7<br />
D-D'<br />
18 ft, East<br />
PRK11-8<br />
24 ft, West<br />
B'<br />
N24E<br />
0<br />
-10<br />
10 8 6 4 2 0 0 20 40 10 60 8 6 4 2 0 0 20 40 10 8 60 6 4 2 0<br />
Blow Counts<br />
Blow Counts<br />
10 8 6 4 2 0 0 20 40 60<br />
0 20 40 60<br />
10 8 6 4 2 0 0 20 1040 8 60 6 4 2 0 0 20 4010 860<br />
610<br />
4 8 2 6 0 4 2 0<br />
10 8 6 4 2 0<br />
Blow Counts 0 20 0 40 20 60 40 60<br />
Blow Counts 0 20 40 60<br />
10 Blow Counts 8 6 4 2 0 0 20 Blow 40 Counts 60<br />
Blow Counts<br />
Blow Counts Blow Counts<br />
Blow Counts<br />
10 8 6 4 2 0 0 20 40 60<br />
Blow Counts<br />
-10<br />
-20<br />
-20<br />
N:\Projects\04_2012\04_7922_1200_Caltrans<strong>Airport</strong>Recov\Outputs\2013_03_05_<strong>Report</strong>\mxd\Fig_DD08b_BUC_ProfileB_M6_60_a087_2475Yr.mxd, 03/21/13, dpollard<br />
DEPTH (FEET)<br />
-30<br />
-40<br />
-50<br />
-60<br />
10 ft<br />
400 ft<br />
Vertical Exaggeration = 40.0X<br />
Cummulative<br />
Settlement<br />
Volumetric<br />
Strain<br />
SOIL BORING LITHOLOGY<br />
WITH LIQUEFACTION<br />
EVALUATION<br />
&<<br />
39<br />
43<br />
30<br />
<br />
24<br />
<br />
10<br />
15<br />
8 6 4 2 0 0 Blow 20 Counts<br />
40 60<br />
10 8 6 4 2 0 0 20 40 60<br />
Volumetric Strain (%) Blow Counts<br />
Settlement (in)<br />
18<br />
9<br />
P<br />
P<br />
Liquefiable<br />
Zone<br />
Critical SPT<br />
N-Value<br />
SPT<br />
N-Value<br />
Note: Magnitude= 6.6; P. G. A. = 0.87 g<br />
LIQUEFACTION CROSS SECTION B-B'<br />
2% Probability of Exceedance<br />
in 50-Years Scenario<br />
Buchanan <strong>Airport</strong><br />
Concord, California<br />
-30<br />
-40<br />
-50<br />
-60<br />
FIGURE DD-8b<br />
DEPTH (FEET)
Fugro Consultants, Inc.<br />
Project No. 04.79221200 <strong>ABAG</strong><br />
0<br />
C<br />
S24E<br />
KL87-16<br />
2 ft, East<br />
KL87-88<br />
69 ft, West<br />
B-B'<br />
PRK11-5<br />
151 ft, East<br />
KL87-29<br />
78 ft, West<br />
KL87-30<br />
60 ft, West<br />
KL87-55<br />
227 ft, East<br />
&< &< &< &< &< &< &<<br />
&< &< &< &< &<<br />
<br />
57<br />
KL87-87<br />
A-A'<br />
1 ft, East<br />
40<br />
20<br />
KL87-44<br />
18 ft, West<br />
KA90-2<br />
257 ft, West<br />
KA83-103<br />
192 ft, West<br />
<br />
39<br />
<br />
5 9<br />
KA90-1<br />
194 ft, West<br />
<br />
5<br />
<br />
KL87-45<br />
22 ft, West<br />
KA81-3<br />
84 ft, West<br />
&<<br />
15<br />
20<br />
8<br />
KA81-2<br />
120 ft, West<br />
&<<br />
11<br />
20<br />
7<br />
KA81-1<br />
2 ft, East<br />
&<<br />
14<br />
31<br />
2<br />
C'<br />
N24W<br />
0<br />
-10<br />
<br />
10 8 6 4 2 0 0 20 40 60<br />
10 8 6 4 2 0<br />
10 8 6 4 2 0<br />
10 8 6 4 2 0 0 20 40 60<br />
10 8 6 4 2 0 0Blow Counts<br />
0 20 40 60<br />
20 10 408<br />
10 6 8604<br />
6 2 4 0 2 0 020 2040 4060<br />
60 Blow Counts<br />
Blow Counts<br />
10 Blow 8 Counts 6 4 2 0 0 20 40 Blow Counts Blow 60 Counts<br />
<br />
10 8 6 4 2 0 0 20 40 60<br />
98 <br />
Blow Counts<br />
Blow Counts<br />
<br />
0 20 40 60<br />
Blow Counts<br />
<br />
10<br />
2<br />
8<br />
6<br />
4<br />
2<br />
0<br />
7<br />
0 20 40 60<br />
Blow Counts<br />
-10<br />
70<br />
<br />
15<br />
<br />
1<br />
<br />
N:\Projects\04_2012\04_7922_1200_Caltrans<strong>Airport</strong>Recov\Outputs\2013_03_05_<strong>Report</strong>\mxd\Fig_DD08c_BUC_ProfileC_M6_60_a087_2475Yr.mxd, 03/21/13, dpollard<br />
DEPTH (FEET)<br />
-20<br />
-30<br />
-40<br />
-50<br />
-60<br />
10 ft<br />
400 ft<br />
Vertical Exaggeration = 40.0X<br />
Cummulative<br />
Settlement<br />
Volumetric<br />
Strain<br />
10<br />
8<br />
10<br />
SOIL BORING LITHOLOGY<br />
WITH LIQUEFACTION<br />
EVALUATION<br />
&<<br />
39<br />
43<br />
30<br />
<br />
24<br />
<br />
10<br />
15<br />
8 6 4 2 0 0 Blow 20 Counts<br />
40 60<br />
10 8 6 4 2 0 0 20 40 60<br />
Volumetric Strain (%) Blow Counts<br />
Settlement (in)<br />
18<br />
9<br />
P<br />
P<br />
6<br />
8<br />
4<br />
10<br />
6<br />
2<br />
8<br />
4<br />
Liquefiable<br />
Zone<br />
0<br />
6<br />
Critical SPT<br />
N-Value<br />
SPT<br />
N-Value<br />
2<br />
27<br />
<br />
99<br />
0<br />
0 20 40 60<br />
Blow Counts<br />
0 20 40 60<br />
Blow Counts<br />
4<br />
2<br />
0<br />
10<br />
8<br />
<br />
<br />
0 20 40 60<br />
Blow Counts<br />
6<br />
10<br />
4<br />
8<br />
2<br />
6<br />
0<br />
4<br />
3<br />
8<br />
5<br />
12*<br />
<br />
2 0<br />
9<br />
3<br />
12<br />
3<br />
8<br />
9<br />
0 20 40 60<br />
Blow Counts<br />
12<br />
0 20 40 60<br />
Blow Counts<br />
Note: Magnitude= 6.6; P. G. A. = 0.87 g<br />
-20<br />
-30<br />
-40<br />
-50<br />
-60<br />
DEPTH (FEET)<br />
LIQUEFACTION CROSS SECTION C-C'<br />
2% Probability of Exceedance<br />
in 50-Years Scenario<br />
Buchanan <strong>Airport</strong><br />
Concord, California<br />
FIGURE DD-8c
Fugro Consultants, Inc.<br />
Project No. 04.79221200 <strong>ABAG</strong><br />
0<br />
D<br />
N26W<br />
KA81-104<br />
180 ft, East<br />
KA81-105<br />
140 ft, West<br />
&
Legend<br />
Existing Borings<br />
&<<br />
2080000<br />
Cross Section Location<br />
Coordinates System: CA State Plane,<br />
Zone 3, NAD83, Feet<br />
2079000<br />
2078000<br />
Ü<br />
1:6,002<br />
EB-1<br />
&<<br />
A'<br />
A<br />
EB-2<br />
EB-3<br />
&< &<<br />
EB-8 EB-6<br />
EB-7<br />
&<<br />
&<<br />
&<<br />
EB-4<br />
EB-5<br />
&< &<<br />
0 250 500 1,000<br />
Feet<br />
6177000<br />
6177000<br />
6178000<br />
6178000<br />
6179000<br />
6179000<br />
6180000<br />
6180000<br />
6181000<br />
6182000<br />
B B'<br />
6181000<br />
6182000<br />
2076000<br />
2076000<br />
2077000<br />
2077000<br />
Fugro Consultants, Inc.<br />
Project No. 04.79221200 <strong>ABAG</strong><br />
PLAN VIEW<br />
Livermore <strong>Airport</strong><br />
Livermore, California<br />
FIGURE DE-1<br />
N:\Projects\04_2012\04_7922_1200_Caltrans<strong>Airport</strong>Recov\Outputs\2013_03_05_<strong>Report</strong>\mxd\Fig_DE01_LIV_ExplorationLocationMap.mxd, 03/21/13, dpollard<br />
2078000<br />
2079000<br />
2080000
! ! ! ! ! ! !<br />
! ! ! ! ! !<br />
! ! ! ! ! ! !<br />
! ! ! ! ! !<br />
! ! ! ! ! ! !<br />
! ! ! ! ! !<br />
! ! ! ! ! ! !<br />
! ! ! ! ! !<br />
! ! ! ! ! ! !<br />
! ! ! ! ! !<br />
Fugro Consultants, Inc.<br />
Project No. 04.79221200 <strong>ABAG</strong><br />
0<br />
A<br />
N89W<br />
EB-1<br />
1 ft, South<br />
EB-2<br />
20 ft, South<br />
EB-3<br />
24 ft, North<br />
&< &< &< &< &<<br />
EB-4<br />
36 ft, South<br />
EB-5<br />
4 ft, South<br />
A'<br />
S89E<br />
0<br />
-2<br />
<br />
<br />
<br />
-2<br />
<br />
<br />
-4<br />
<br />
<br />
<br />
<br />
-4<br />
<br />
N:\Projects\04_2012\04_7922_1200_Caltrans<strong>Airport</strong>Recov\Outputs\2013_03_05_<strong>Report</strong>\mxd\Fig_DE02a_LIV_ProfileA.mxd, 03/21/13, dpollard<br />
DEPTH (FEET)<br />
-6<br />
-8<br />
-10<br />
-12<br />
<br />
<br />
400 ft<br />
Vertical Exaggeration = 200.0X<br />
Legend<br />
2 ft<br />
<br />
<br />
<br />
Lean CLAY (CL)<br />
Clayey SAND (SC)<br />
Silty CLAY (CL-ML)<br />
Clayey to Silty SAND (SC-SM)<br />
Silt (ML)<br />
Silty SAND (SM)<br />
Poorly-Graded SAND with Silt (SP-SM)<br />
Asphaltic Concrete<br />
10 SPT Blow Count<br />
<br />
<br />
Modified California Liner<br />
Sampler Blow Count<br />
<br />
<br />
<br />
<br />
<br />
<br />
<br />
-6<br />
-8<br />
-10<br />
-12<br />
DEPTH (FEET)<br />
GEOTECHNICAL CROSS SECTION A-A'<br />
Livermore <strong>Airport</strong><br />
Livermore, California<br />
FIGURE DE-2a
! ! ! ! ! ! !<br />
! ! ! ! ! !<br />
! ! ! ! ! ! !<br />
! ! ! ! ! !<br />
! ! ! ! ! ! !<br />
! ! ! ! ! !<br />
! ! ! ! ! ! !<br />
! ! ! ! ! !<br />
! ! ! ! ! ! !<br />
! ! ! ! ! !<br />
Fugro Consultants, Inc.<br />
Project No. 04.79221200 <strong>ABAG</strong><br />
0<br />
B<br />
W<br />
EB-8<br />
8 ft, North<br />
&<<br />
EB-7<br />
4 ft, South<br />
&<<br />
EB-6<br />
32 ft, North<br />
&<<br />
B'<br />
E<br />
0<br />
-2<br />
<br />
<br />
<br />
-2<br />
<br />
<br />
<br />
-4<br />
-4<br />
<br />
<br />
<br />
N:\Projects\04_2012\04_7922_1200_Caltrans<strong>Airport</strong>Recov\Outputs\2013_03_05_<strong>Report</strong>\mxd\Fig_DE02b_LIV_ProfileB.mxd, 03/21/13, dpollard<br />
Legend<br />
DEPTH (FEET)<br />
-6<br />
-8<br />
-10<br />
-12<br />
2 ft<br />
100 ft<br />
Vertical Exaggeration = 50.0X<br />
<br />
<br />
<br />
Lean CLAY (CL)<br />
Clayey SAND (SC)<br />
Silty CLAY (CL-ML)<br />
Clayey to Silty SAND (SC-SM)<br />
Silt (ML)<br />
Silty SAND (SM)<br />
Poorly-Graded SAND with Silt (SP-SM)<br />
Asphaltic Concrete<br />
10 SPT Blow Count<br />
<br />
<br />
<br />
Modified California Liner<br />
Sampler Blow Count<br />
<br />
35<br />
23<br />
-6<br />
-8<br />
-10<br />
-12<br />
DEPTH (FEET)<br />
GEOTECHNICAL CROSS SECTION B-B'<br />
Livermore <strong>Airport</strong><br />
Livermore, California<br />
FIGURE DE-2b
6120000<br />
Legend<br />
USGS CPT, 2000<br />
#V<br />
TetraTech CPT, 2005<br />
#V<br />
Cross Section Location<br />
1980000<br />
Ü<br />
1:18,005<br />
1975000<br />
0 750 1,500 3,000<br />
Feet<br />
USC-07<br />
#V<br />
#V<br />
#V<br />
#V<br />
#V#V #V #V<br />
#V<br />
#V #V<br />
#V<br />
#V<br />
USC-06<br />
#V<br />
6105000<br />
6105000<br />
A<br />
USC-05<br />
TTC-01<br />
TTC-06<br />
6110000<br />
USC-04<br />
USC-03<br />
TTC-02<br />
TTC-03<br />
TTC-05<br />
TTC-07<br />
TTC-04<br />
USC-02<br />
6110000<br />
USC-01<br />
A'<br />
6115000<br />
6120000<br />
6115000<br />
PLAN VIEW<br />
Moffett Federal Airfield<br />
Mountain View, California<br />
Fugro Consultants, Inc.<br />
Project No. 04.79221200 <strong>ABAG</strong><br />
FIGURE DF-1<br />
N:\Projects\04_2012\04_7922_1200_Caltrans<strong>Airport</strong>Recov\Outputs\2013_03_05_<strong>Report</strong>\mxd\Fig_DF01_MOF_ExplorationLocationMap.mxd, 03/21/13, dpollard<br />
1975000<br />
1980000
40<br />
20<br />
ELEVATION (FEET)<br />
USC-02<br />
39 ft, East<br />
USC-01<br />
107 ft, West<br />
#V<br />
#V<br />
#V<br />
USC-03<br />
239 ft, East<br />
#V<br />
USC-05<br />
466 ft, West<br />
USC-04<br />
389 ft, East<br />
USC-06<br />
1340 ft, West<br />
#V #V<br />
Fugro Consultants, Inc.<br />
Project No. 04.79221200 <strong>ABAG</strong><br />
40<br />
A<br />
N25W<br />
20<br />
0<br />
-20<br />
-40<br />
-60<br />
0 100 200<br />
Qt(tsf)<br />
10 5<br />
Fr (%)<br />
0 100 200<br />
Qt(tsf)<br />
10<br />
5<br />
0<br />
Fr (%)<br />
-20<br />
-40<br />
0<br />
-60<br />
0 100 200<br />
Qt(tsf)<br />
10<br />
5<br />
ELEVATION (FEET)<br />
10<br />
5<br />
Fr (%)<br />
Fr (%)<br />
A'<br />
S25E<br />
10<br />
5<br />
Fr (%)<br />
0<br />
0 100 200<br />
Qt(tsf)<br />
0<br />
0 100 200<br />
Qt(tsf)<br />
10 5<br />
Fr (%)<br />
20 ft<br />
1000 ft<br />
Vertical Exaggeration = 50<br />
0 100 200<br />
Qt(tsf)<br />
GEOTECHNICAL CROSS SECTION A-A'<br />
Moffett Federal Airfield<br />
Mountain View, California<br />
FIGURE DF-2<br />
N:\Projects\04_2012\04_7922_1200_Caltrans<strong>Airport</strong>Recov\Outputs\2013_03_05_<strong>Report</strong>\mxd\Fig_DF02_MOF_ProfileA.mxd, 03/21/13, dpollard
Fugro Consultants, Inc.<br />
Project No. 04.79221200 <strong>ABAG</strong><br />
6105000<br />
6110000<br />
6115000<br />
6120000<br />
Legend<br />
Settlement (Inches)<br />
0 - 1<br />
1 - 2<br />
USC-05<br />
2 - 3<br />
USC-04<br />
3 - 4<br />
1980000<br />
1980000<br />
4 - 5<br />
> 5<br />
N:\Projects\04_2012\04_7922_1200_Caltrans<strong>Airport</strong>Recov\Outputs\2013_03_05_<strong>Report</strong>\mxd\Fig_DF03_MOF_LiquSettl_M7_80_a031_1906SF.mxd, 03/21/13, dpollard<br />
1975000<br />
6105000<br />
USC-03<br />
TTC-02<br />
TTC-01<br />
TTC-05<br />
TTC-07<br />
USC-02<br />
TTC-04<br />
TTC-06<br />
TTC-03<br />
USC-06<br />
USC-01<br />
6110000<br />
USC-07<br />
6115000<br />
6120000<br />
1975000<br />
Magnitude= 7.8; P. G. A. = 0.31 g<br />
Only borings with > 30 feet total depth<br />
are shown<br />
Coordinate Grid: CA State Plane, Zone 3,<br />
NAD83, Feet<br />
Ü1:18,005<br />
0 750 1,500 3,000<br />
Feet<br />
LIQUEFACTION SETTLEMENT MAP<br />
1906 San Francisco Earthquake Scenario<br />
Moffett Federal Airfield<br />
Mountain View, California<br />
FIGURE DF-3
Fugro Consultants, Inc.<br />
Project No. 04.79221200 <strong>ABAG</strong><br />
6105000<br />
6110000<br />
6115000<br />
6120000<br />
Legend<br />
Settlement (Inches)<br />
0 - 1<br />
1 - 2<br />
USC-05<br />
2 - 3<br />
USC-04<br />
3 - 4<br />
N:\Projects\04_2012\04_7922_1200_Caltrans<strong>Airport</strong>Recov\Outputs\2013_03_05_<strong>Report</strong>\mxd\Fig_DF04_MOF_LiquSettl_M7_26_a032_HRC_Fault.mxd, 03/21/13, dpollard<br />
1980000<br />
1975000<br />
6105000<br />
USC-03<br />
TTC-02<br />
TTC-01<br />
TTC-05<br />
TTC-07<br />
USC-02<br />
TTC-04<br />
TTC-06<br />
TTC-03<br />
USC-06<br />
USC-01<br />
6110000<br />
USC-07<br />
6115000<br />
6120000<br />
1980000<br />
1975000<br />
4 - 5<br />
> 5<br />
Magnitude= 7.26; P. G. A. = 0.32 g<br />
Only borings with > 30 feet total depth<br />
are shown<br />
Coordinate Grid: CA State Plane, Zone 3,<br />
NAD83, Feet<br />
Ü1:18,005<br />
0 750 1,500 3,000<br />
Feet<br />
LIQUEFACTION SETTLEMENT MAP<br />
Hayward-Rodgers Creek Scenario<br />
Moffett Federal Airfield<br />
Mountain View, California<br />
FIGURE DF-4
Fugro Consultants, Inc.<br />
Project No. 04.79221200 <strong>ABAG</strong><br />
6105000<br />
6110000<br />
6115000<br />
6120000<br />
Legend<br />
Settlement (Inches)<br />
0 - 1<br />
1 - 2<br />
USC-05<br />
2 - 3<br />
USC-04<br />
3 - 4<br />
N:\Projects\04_2012\04_7922_1200_Caltrans<strong>Airport</strong>Recov\Outputs\2013_03_05_<strong>Report</strong>\mxd\Fig_DF05_MOF_LiquSettl_M6_71_a010_CGV_Fault.mxd, 03/21/13, dpollard<br />
1980000<br />
1975000<br />
6105000<br />
USC-03<br />
TTC-02<br />
TTC-01<br />
TTC-05<br />
TTC-07<br />
USC-02<br />
TTC-04<br />
TTC-06<br />
TTC-03<br />
USC-06<br />
USC-01<br />
6110000<br />
USC-07<br />
6115000<br />
6120000<br />
1980000<br />
1975000<br />
4 - 5<br />
> 5<br />
Magnitude= 6.71; P. G. A. = 0.10 g<br />
Only borings with > 30 feet total depth<br />
are shown<br />
Coordinate Grid: CA State Plane, Zone 3,<br />
NAD83, Feet<br />
Ü1:18,005<br />
0 750 1,500 3,000<br />
Feet<br />
LIQUEFACTION SETTLEMENT MAP<br />
Concord-Green Valley Scenario<br />
Moffett Federal Airfield<br />
Mountain View, California<br />
FIGURE DF-5
Fugro Consultants, Inc.<br />
Project No. 04.79221200 <strong>ABAG</strong><br />
6105000<br />
6110000<br />
6115000<br />
6120000<br />
Legend<br />
Settlement (Inches)<br />
0 - 1<br />
1 - 2<br />
USC-05<br />
2 - 3<br />
USC-04<br />
3 - 4<br />
1980000<br />
1980000<br />
4 - 5<br />
> 5<br />
N:\Projects\04_2012\04_7922_1200_Caltrans<strong>Airport</strong>Recov\Outputs\2013_03_05_<strong>Report</strong>\mxd\Fig_DF06_MOF_LiquSettl_M6_70_a049_475Yr.mxd, 03/21/13, dpollard<br />
1975000<br />
6105000<br />
USC-03<br />
TTC-02<br />
TTC-01<br />
TTC-05<br />
TTC-07<br />
USC-02<br />
TTC-04<br />
TTC-06<br />
TTC-03<br />
USC-06<br />
USC-01<br />
6110000<br />
USC-07<br />
6115000<br />
6120000<br />
1975000<br />
Magnitude= 6.7; P. G. A. = 0.49 g<br />
Only borings with > 30 feet total depth<br />
are shown<br />
Coordinate Grid: CA State Plane, Zone 3,<br />
NAD83, Feet<br />
Ü1:18,005<br />
0 750 1,500 3,000<br />
Feet<br />
LIQUEFACTION SETTLEMENT MAP<br />
10% Probability of Exceedance<br />
in 50-Years Scenario<br />
Moffett Federal Airfield<br />
Mountain View, California<br />
FIGURE DF-6
Fugro Consultants, Inc.<br />
Project No. 04.79221200 <strong>ABAG</strong><br />
6105000<br />
6110000<br />
6115000<br />
6120000<br />
Legend<br />
Settlement (Inches)<br />
0 - 1<br />
1 - 2<br />
USC-05<br />
2 - 3<br />
USC-04<br />
3 - 4<br />
1980000<br />
1980000<br />
4 - 5<br />
> 5<br />
N:\Projects\04_2012\04_7922_1200_Caltrans<strong>Airport</strong>Recov\Outputs\2013_03_05_<strong>Report</strong>\mxd\Fig_DF07_MOF_LiquSettl_M6_70_a075_2475Yr.mxd, 03/21/13, dpollard<br />
1975000<br />
6105000<br />
USC-03<br />
TTC-02<br />
TTC-01<br />
TTC-05<br />
TTC-07<br />
USC-02<br />
TTC-04<br />
TTC-06<br />
TTC-03<br />
USC-06<br />
USC-01<br />
6110000<br />
USC-07<br />
6115000<br />
6120000<br />
1975000<br />
Magnitude= 6.7; P. G. A. = 0.75 g<br />
Only borings with > 30 feet total depth<br />
are shown<br />
Coordinate Grid: CA State Plane, Zone 3,<br />
NAD83, Feet<br />
Ü1:18,005<br />
0 750 1,500 3,000<br />
Feet<br />
LIQUEFACTION SETTLEMENT MAP<br />
2% Probability of Exceedance<br />
in 50-Years Scenario<br />
Moffett Federal Airfield<br />
Mountain View, California<br />
FIGURE DF-7
Fugro Consultants, Inc.<br />
Project No. 04.79221200 <strong>ABAG</strong><br />
40<br />
A<br />
N25W<br />
USC-05<br />
466 ft, West<br />
USC-04<br />
389 ft, East<br />
USC-03<br />
239 ft, East<br />
USC-02<br />
39 ft, East<br />
USC-06<br />
1340 ft, West<br />
#V<br />
USC-01<br />
107 ft, West<br />
#V<br />
A'<br />
S25E<br />
40<br />
1000 _<br />
CPT CORRELATION CHART<br />
(Robertson and Wride, 1990)<br />
N:\Projects\04_2012\04_7922_1200_Caltrans<strong>Airport</strong>Recov\Outputs\2013_03_05_<strong>Report</strong>\mxd\Fig_DF08_MOF_ProfileA_M6_70_a075_2475Yr.mxd, 03/21/13, dpollard<br />
ELEVATION (FEET)<br />
20<br />
0<br />
-20<br />
-40<br />
-60<br />
4 2<br />
ev , %<br />
S, in<br />
20 ft<br />
#V #V<br />
0<br />
50 100 150<br />
q c (tsf)<br />
4 2<br />
ev , %<br />
S, in<br />
1000 ft<br />
Vertical Exaggeration = 50<br />
0 50 100 150<br />
q c (tsf)<br />
4 2<br />
ev , %<br />
S, in<br />
#V<br />
0 50 100 150<br />
q c (tsf)<br />
4 2<br />
ev , %<br />
S, in<br />
#V<br />
0<br />
50 100 150<br />
q c (tsf)<br />
4 2<br />
ev , %<br />
S, in<br />
0<br />
50 100 150<br />
q c (tsf)<br />
4 2<br />
ev , %<br />
S, in<br />
0<br />
50 100 150<br />
q c (tsf)<br />
<strong>Liquefaction</strong> Legend<br />
Cumulative<br />
Settlement<br />
Volumetric<br />
Strain<br />
10 8<br />
Volumetric Strain (%)<br />
Settlement (in)<br />
6 4 2<br />
0 100 200 300<br />
Tip Resistance (tsf)<br />
Soil Type<br />
Liquefiable<br />
Zones<br />
Critical Tip<br />
Resistance<br />
CPT Tip<br />
Resistance<br />
20<br />
0<br />
-20<br />
-40<br />
-60<br />
ELEVATION (FEET)<br />
Tip Resistance (tsf)<br />
100 _<br />
10 _<br />
1 _<br />
0.01<br />
_<br />
Increasing<br />
Effective<br />
Stress<br />
Zone<br />
1<br />
2<br />
3<br />
4<br />
5<br />
6<br />
7<br />
8<br />
9<br />
1<br />
Increasing Ic<br />
_<br />
0.1<br />
6<br />
7<br />
Normally Consolidated<br />
_<br />
Friction Ratio (%)<br />
Increasing<br />
OCR, Age,<br />
Cementation<br />
Increasing<br />
Sensitivity<br />
*heavily overconsolidated or cemented<br />
5<br />
Increasing<br />
OCR, Age<br />
_<br />
LIQUEFACTION CROSS SECTION A-A'<br />
2% Probability of Exceedance<br />
in 50-Years Scenario<br />
Moffett Federal Airfield<br />
Mountain View, California<br />
1<br />
Soil Behavior Type<br />
Sensitive Fine-grained<br />
Peats<br />
Silty Clay to Clay<br />
Clayey Silt to Silty Clay<br />
Silty Sand to Sandy Silt<br />
Clean Sand to Silty Sand<br />
Gravelly Sand to Dense Sand<br />
Very Stiff Sand to Clayey Sand*<br />
Very Stiff Fine-Grained*<br />
Note: Magnitude= 6.7; P. G. A. = 0.75 g<br />
8<br />
4<br />
9<br />
2<br />
3<br />
10<br />
FIGURE DF-8