Tim Jerzyk Senior Vice President, Treasurer - Yum!
Tim Jerzyk Senior Vice President, Treasurer - Yum!
Tim Jerzyk Senior Vice President, Treasurer - Yum!

Create successful ePaper yourself
Turn your PDF publications into a flip-book with our unique Google optimized e-Paper software.
NEWS<br />
<strong>Tim</strong> <strong>Jerzyk</strong><br />
<strong>Senior</strong> <strong>Vice</strong> <strong>President</strong>, <strong>Treasurer</strong><br />
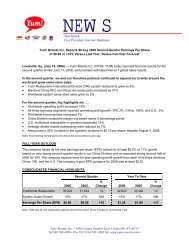
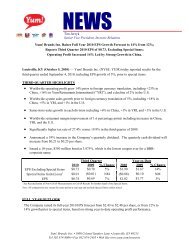
<strong>Yum</strong>! Brands Inc. Reports Third Quarter 2009 EPS Growth of 21%, Excluding Special Items;<br />
Led by Robust China Profit Growth of 32%;<br />
Raises Full-Year EPS Growth Forecast to 12%, Excluding Special Items<br />
Louisville, Ky. (October 6, 2009) — <strong>Yum</strong>! Brands Inc. (NYSE: YUM) today reported Earnings Per Share<br />
(EPS) of $0.69, or $0.70 excluding special items, for the third quarter ended September 5, 2009.<br />
THIRD-QUARTER HIGHLIGHTS<br />
• International development continued at a strong pace with 267 new restaurants including 88 new<br />
units in mainland China and 165 new units in <strong>Yum</strong>! Restaurants International (YRI).<br />
• System sales growth of +11% in mainland China and +4% in YRI was offset by a 5% decline in the<br />
U.S. resulting in flat worldwide system sales in local currency terms; worldwide system sales declined<br />
4% after foreign currency translation.<br />
• Worldwide restaurant margin improved over 3 percentage points driven by significant gains in both<br />
the U.S. and China.<br />
• Worldwide operating profit growth of 15% was driven by China, +32%, and the U.S., +18%. YRI profit<br />
declined 13% due to negative foreign currency translation. Worldwide operating profit growth was<br />
19% prior to foreign currency translation.<br />
• Foreign currency translation negatively impacted EPS by $0.02 per share.<br />
Note: All comparisons are versus the same period a year ago and exclude Special Items unless noted.<br />
Third Quarter<br />
Year-to-Date<br />
2009 2008 % Change 2009 2008 % Change<br />
EPS Excluding Special Items $0.70 $0.58 21% $1.67 $1.45 16%<br />
Special Items Gain/(Loss) 1 ($0.01) $0.00 NM $0.10 $0.08 NM<br />
EPS $0.69 $0.58 19% $1.77 $1.53 16%<br />
1<br />
See Reconciliation of Non-GAAP Measurements to GAAP Results for further detail of the 2009 and 2008 Special Items.<br />
FULL-YEAR OUTLOOK<br />
The Company raised its full-year 2009 EPS forecast from $2.10 to $2.14 per share or 12% growth prior to<br />
special items, driven by stronger-than-expected full year performance in China and a lower-than-expected<br />
full year effective tax rate.<br />
<strong>Yum</strong>! Brands, Inc. • 1900 Colonel Sanders Lane • Louisville, KY 40213<br />
Tel 502 874-8006 • Fax 502 874-2410 • Web Site www.yum.com/investors
David C. Novak, Chairman and CEO, said, “I’m pleased to report we are raising our full year 2009<br />
EPS growth forecast to 12% based on our strong year-to-date profit performance. Our global<br />
portfolio delivered an impressive 15% operating profit growth this quarter, driven by 32% growth<br />
in China and 18% growth in our U.S. business. China and <strong>Yum</strong>! Restaurants International are on<br />
track to open over 1,400 international new units this year. We are confident our industry leading<br />
international new unit development will continue to be a key factor in our ability to drive future<br />
sales and profit growth.<br />
“Our China business generated extraordinary operating profit growth of 32% in the third quarter.<br />
We leveraged our high-return, new unit development and increased restaurant margin over two<br />
points. We are especially pleased that our China team achieved margins near record levels with<br />
high average unit volumes. We are on track to open over 475 new units in mainland China.<br />
Importantly, KFC is the only Western QSR brand in the vast majority of the 600 cities in which we<br />
have a presence. Our U.S. business achieved strong operating profit growth of 18%. This can be<br />
attributed to substantial improvement to restaurant margin and significant G&A savings which<br />
offset a 6% same-store-sales decline. There’s no question the overall worldwide environment<br />
continues to be challenging. However, we are more confident than ever in the consistent earnings<br />
power of our global portfolio. We also continue to make major progress developing our significant,<br />
new sales layers which will better leverage our assets and drive future growth.<br />
“Looking to 2010, we expect to deliver 10% EPS growth. This would be the ninth consecutive<br />
year we meet or exceed our annual target of at least 10% EPS growth. Our fundamental<br />
opportunities remain intact. We continue to have the unique ability to generate unparalleled<br />
international growth, increase sales in our existing assets and drive significant free cash flow<br />
while continuing to be an industry leader in return on invested capital.”<br />
2
CHINA DIVISION<br />
Third Quarter<br />
Year-to-Date<br />
% Change % Change<br />
2009 2008 Reported Ex F/X 2009 2008 Reported Ex F/X<br />
System Sales Growth +11 +10 +11 +9<br />
Restaurant Margin (%) 23.2 20.9 2.3 2.3 21.5 19.7 1.8 1.7<br />
Operating Profit ($MM) 217 165 +32 +31 453 360 +26 +23<br />
• China Division system sales growth of 10% excluding foreign currency translation was<br />
driven by strong new unit development in mainland China while same-store-sales were flat.<br />
o We opened 88 new restaurants in mainland China for the third quarter for a total of 304<br />
year to date.<br />
Mainland China Units Q3 2009 % Change<br />
Traditional Restaurants 3,281 +16<br />
KFC 2,729 +16<br />
Pizza Hut Casual Dining 442 +11<br />
Pizza Hut Home Service 87 +24<br />
• Restaurant margin increased 2.3 percentage points driven primarily by significant commodity<br />
deflation of $21 million in the third quarter. A similar benefit is expected in the fourth quarter.<br />
• Foreign currency conversion benefited operating profit by $1 million.<br />
• Operating profit growth of 32% overlapped growth of 22% in the third quarter of 2008.<br />
3
YUM! RESTAURANTS INTERNATIONAL (YRI) DIVISION<br />
Third Quarter<br />
Year-to-Date<br />
% Change % Change<br />
2009 2008 Reported Ex F/X 2009 2008 Reported Ex F/X<br />
Traditional Restaurants 12,895 12,489 +3 NA 12,895 12,489 +3 NA<br />
System Sales Growth (7) +4 (7) +7<br />
Franchise & License Fees 156 165 (5) +5 442 467 (5) +8<br />
Operating Profit ($MM) 119 137 (13) Flat 342 393 (13) +3<br />
Operating Margin (%) 18.0 18.1 (0.1) (0.6) 18.7 18.0 +0.7 (0.2)<br />
• System sales growth of 4%, excluding foreign currency translation, was driven by new unit<br />
development and same-store sales were flat. The table below provides further insight into key<br />
YRI markets.<br />
• YRI opened 165 new restaurants with 93% coming from our franchise partners.<br />
• Operating profit growth was negatively impacted by poor performance in two company<br />
markets, Mexico and South Korea, and timing related to overhead expenses.<br />
• Foreign currency translation negatively impacted operating profit by $17 million.<br />
Key YRI Markets<br />
Franchise Only Markets<br />
System Sales Growth<br />
Ex F/X (%)<br />
Third Quarter Year-to-Date<br />
Asia (ex China Division) +4 +7<br />
Continental Europe Flat +3<br />
Middle East +6 +8<br />
Latin America +4 +6<br />
Company/Franchise Markets<br />
Australia +3 +6<br />
UK +9 +10<br />
New Growth Markets +20 +18<br />
Note: The markets listed above generate approximately 80% of YRI operating profit. New<br />
Growth Markets include France, Russia and India.<br />
4
U.S. DIVISION<br />
Third Quarter<br />
Year-to-Date<br />
2009 2008 % Change 2009 2008 % Change<br />
Same-Store-Sales Growth (%) (6) +3 NM (3) +3 NM<br />
Restaurant Margin (%) 14.1 10.8 +3.3 14.0 11.9 +2.1<br />
Operating Profit ($MM) 171 146 +18 497 447 +11<br />
Operating Margin (%) 16.2 12.0 +4.2 15.5 12.3 +3.2<br />
• Same-store-sales declined 6% which included a 13% decline at Pizza Hut.<br />
• Restaurant margin improved by 3.3 points due largely to commodity cost deflation of $16<br />
million this quarter. Year-to-date commodity cost deflation has totaled $11 million. The full<br />
year benefit from commodity cost deflation is expected to be about $20 million.<br />
• Third quarter operating profit growth of 18% and operating margin improvement of 4.2 points<br />
were driven by a $16 million decline in our U.S. G&A cost structure from actions initiated in<br />
the fourth quarter of 2008. For the full year, we continue to expect G&A cost savings of at<br />
least $60 million.<br />
U.S. REFRANCHISING UPDATE<br />
In the third quarter, 98 company-owned U.S. restaurants were sold to franchisees. Year to date,<br />
we have refranchised 286 units, including 210 Pizza Huts, 50 KFCs and 26 Taco Bells. We<br />
continue to expect to refranchise 500 units in 2009. Full year proceeds from U.S. refranchising<br />
are expected to be about $175 million.<br />
CONFERENCE CALL<br />
<strong>Yum</strong>! Brands Inc. will host a conference call to review the company’s financial performance and<br />
strategies at 9:15 a.m. ET Wednesday, October 7, 2009.<br />
The number is 877/815-2029 for U.S. callers and 706/645-9271 for international callers.<br />
The call will be available for playback beginning at noon Eastern <strong>Tim</strong>e Wednesday, October 7,<br />
through midnight October 21, 2009. To access the playback, dial 800/642-1687 in the United<br />
States and 706/645-9291 internationally. The playback pass code is 29944595.<br />
The webcast and the playback can be accessed via the Internet by visiting <strong>Yum</strong>! Brands’ Web<br />
site, www.yum.com/investors and selecting “Q3 2009 Earnings Call”.<br />
For your added convenience . . . A podcast will be available within 24 hours of the end of the<br />
call at www.yum.com/investors.<br />
ADDITIONAL INFORMATION ONLINE<br />
Third quarter end dates for each division, restaurant-count details, and definitions of terms<br />
including Key Markets are available online at<br />
http://investors.yum.com/phoenix.zhtml?c=117941&p=irol-newsEarnings.<br />
5
This announcement, any related announcements and the related webcast may contain “forwardlooking<br />
statements” within the meaning of Section 27A of the Securities Act of 1933 and Section<br />
21E of the Securities Exchange Act of 1934. We intend all forward-looking statements to be<br />
covered by the safe harbor provisions of the Private Securities Litigation Reform Act of 1995.<br />
Forward-looking statements can be identified by the fact that they do not relate strictly to historical<br />
or current facts. Our forward-looking statements are subject to risks and uncertainties, which may<br />
cause actual results to differ materially from those projected. Factors that can cause our actual<br />
results to differ materially include, but are not limited to: economic and political conditions in the<br />
countries where we operate; currency exchange and interest rates; commodity, labor and other<br />
operating costs; competition, consumer preferences or perceptions; the impact of any widespread<br />
illness or food borne illness; the effectiveness of our operating initiatives and marketing; newproduct<br />
and concept development by us and our competitors; the success of our strategies for<br />
refranchising and international development; the continued viability of our franchise and license<br />
operators; our ability to secure and maintain distribution and adequate supply to our restaurants;<br />
publicity that may impact our business and/or industry; pending or future legal claims; our<br />
effective tax rates; our actuarially determined casualty loss estimates; government regulations;<br />
and accounting policies and practices. You should consult our filings with the Securities and<br />
Exchange Commission (including the information set forth under the captions “Risk Factors” and<br />
“Forward-Looking Statements” in our Annual Report on Form 10-K) for additional detail about<br />
factors that could affect our financial and other results. Forward-looking statements are based on<br />
current expectations and assumptions and currently available data and are neither predictions nor<br />
guarantees of future events or performance. You should not place undue reliance on forwardlooking<br />
statements, which speak only as of the date hereof. We are not undertaking to update<br />
any of these statements.<br />
<strong>Yum</strong>! Brands, Inc., based in Louisville, Kentucky, is the world’s largest restaurant company in<br />
terms of system restaurants, with more than 36,000 restaurants in over 110 countries and<br />
territories. The company is ranked #239 on the Fortune 500 List, with revenues in excess of $11<br />
billion in 2008. Four of the company’s restaurant brands – KFC, Pizza Hut, Taco Bell and Long<br />
John Silver’s – are the global leaders of the chicken, pizza, Mexican–style food and quick–service<br />
seafood categories, respectively. Outside the United States, the <strong>Yum</strong>! Brands system opened<br />
more than four new restaurants each day of the year, making it a leader in international retail<br />
development. The company has consistently been recognized for its reward and recognition<br />
culture, diversity leadership, community giving, and consistent shareholder returns. In 2007, the<br />
company launched World Hunger Relief, the world’s largest private sector hunger relief effort to<br />
raise awareness, volunteerism and funds to benefit the United Nations World Food Programme<br />
(WFP) and other hunger relief agencies. To date, this effort has raised $36 million for the WFP<br />
and other hunger relief agencies and is helping to provide 160 million meals and save the lives of<br />
about 4 million people in remote corners of the world, where hunger is most prevalent.<br />
Analysts are invited to contact<br />
<strong>Tim</strong> <strong>Jerzyk</strong>, <strong>Senior</strong> <strong>Vice</strong> <strong>President</strong>, Investor Relations/<strong>Treasurer</strong>, at 888/298-6986<br />
Bruce Bishop, Director Investor Relations, at 888/298-6986<br />
Members of the media are invited to contact<br />
Amy Sherwood, <strong>Vice</strong> <strong>President</strong> Public Relations, at 502/874-8200<br />
6
YUM! Brands, Inc.<br />
Consolidated Summary of Results<br />
(amounts in millions, except per share amounts)<br />
(unaudited)<br />
Quarter % Change Year to Date % Change<br />
9/5/09 9/6/08 B/(W) 9/5/09 9/6/08 B/(W)<br />
Company sales $ 2,432 $ 2,482 (2) $ 6,502 $ 6,899 (6)<br />
Franchise and license fees and income 346 360 (3) 969 1,015 (4)<br />
Total revenues 2,778 2,842 (2) 7,471 7,914 (6)<br />
Company restaurants<br />
Food and paper 777 830 7 2,081 2,265 8<br />
Payroll and employee benefits 523 575 9 1,485 1,682 12<br />
Occupancy and other operating expenses 707 719 2 1,879 1,975 5<br />
Company restaurant expenses 2,007 2,124 6 5,445 5,922 8<br />
General and administrative expenses 276 305 9 812 898 9<br />
Franchise and license expenses 29 25 (14) 74 63 (18)<br />
Closures and impairment (income) expenses 5 3 NM 31 9 NM<br />
Refranchising (gain) loss 4 (8) NM (9) 16 NM<br />
Other (income) expense (13) (18) (32) (97) (148) (35)<br />
Total costs and expenses, net 2,308 2,431 5 6,256 6,760 7<br />
Operating Profit 470 411 14 1,215 1,154 5<br />
Interest expense, net 42 47 13 138 152 9<br />
Income before income taxes 428 364 18 1,077 1,002 7<br />
Income tax provision 88 79 (12) 212 236 10<br />
Net income – including noncontrolling interest 340 285 19 865 766 13<br />
Net income – noncontrolling interest 6 3 NM 10 6 NM<br />
Net income – YUM! Brands, Inc. $ 334 $ 282 18 $ 855 $ 760 12<br />
Effective tax rate 20.6% 21.7% 19.7% 23.5%<br />
Effective tax rate before special items 19.9% 21.6% 21.1% 22.6%<br />
Basic EPS Data<br />
EPS $ 0.71 $ 0.60 18 $ 1.82 $ 1.59 15<br />
Average shares outstanding 472 470 — 469 479 2<br />
Diluted EPS Data<br />
EPS $ 0.69 $ 0.58 19 $ 1.77 $ 1.53 16<br />
Average shares outstanding 485 487 — 482 496 3<br />
Dividends declared per common share $ — $ — $ 0.38 $ 0.34<br />
See accompanying notes.<br />
7
YUM! Brands, Inc.<br />
CHINA DIVISION Operating Results<br />
(amounts in millions)<br />
(unaudited)<br />
Quarter % Change Year to Date % Change<br />
9/5/09 9/6/08 B/(W) 9/5/09 9/6/08 B/(W)<br />
Company sales $ 1,048 $ 854 23 $ 2,430 $ 2,049 19<br />
Franchise and license fees and income 15 20 (25) 43 48 (10)<br />
Total revenues 1,063 874 22 2,473 2,097 18<br />
Company restaurant expenses, net<br />
Food and paper 367 320 (15) 864 769 (12)<br />
Payroll and employee benefits 129 107 (19) 321 276 (16)<br />
Occupancy and other operating expenses 309 249 (25) 724 600 (21)<br />
805 676 (19) 1,909 1,645 (16)<br />
General and administrative expenses 51 45 (10) 132 121 (9)<br />
Franchise and license expenses — — — — — —<br />
Closures and impairment (income) expenses 2 1 NM 8 3 NM<br />
Other (income) expense (12) (13) (16) (29) (32) (12)<br />
846 709 (19) 2,020 1,737 (16)<br />
Operating Profit $ 217 $ 165 32 $ 453 $ 360 26<br />
Company sales 100.0% 100.0% 100.0% 100.0%<br />
Food and paper 35.0 37.4 2.4 ppts. 35.5 37.5 2.0 ppts.<br />
Payroll and employee benefits 12.3 12.6 0.3 ppts. 13.2 13.5 0.3 ppts.<br />
Occupancy and other operating expenses 29.5 29.1 (0.4) ppts. 29.8 29.3 (0.5) ppts.<br />
Restaurant margin 23.2% 20.9% 2.3 ppts. 21.5% 19.7% 1.8 ppts.<br />
See accompanying notes.<br />
China Division includes mainland China, Thailand and KFC Taiwan.<br />
As discussed in (d) in the accompanying notes, we began consolidating the operating entity that owns the KFC business in Shanghai,<br />
China, with 236 units, during the second quarter of 2009. This entity was previously accounted for as an unconsolidated affiliate.<br />
8
YUM! Brands, Inc.<br />
YUM! RESTAURANTS INTERNATIONAL DIVISION Operating Results<br />
(amounts in millions)<br />
(unaudited)<br />
Quarter % Change Year to Date % Change<br />
9/5/09 9/6/08 B/(W) 9/5/09 9/6/08 B/(W)<br />
Company sales $ 505 $ 588 (14) $ 1,388 $ 1,717 (19)<br />
Franchise and license fees and income 156 165 (5) 442 467 (5)<br />
Total revenues 661 753 (12) 1,830 2,184 (16)<br />
Company restaurant expenses, net<br />
Food and paper 162 186 14 445 539 18<br />
Payroll and employee benefits 131 154 14 358 448 20<br />
Occupancy and other operating expenses 154 181 15 425 530 20<br />
447 521 14 1,228 1,517 19<br />
General and administrative expenses 83 87 5 228 253 10<br />
Franchise and license expenses 13 10 (28) 29 25 (15)<br />
Closures and impairment (income) expenses (1) (2) NM 3 (3) NM<br />
Other (income) expense — — — — (1) (100)<br />
542 616 12 1,488 1,791 17<br />
Operating Profit $ 119 $ 137 (13) $ 342 $ 393 (13)<br />
Company sales 100.0% 100.0% 100.0% 100.0%<br />
Food and paper 31.9 31.8 (0.1) ppts. 32.0 31.5 (0.5) ppts.<br />
Payroll and employee benefits 26.2 26.1 (0.1) ppts. 25.9 26.1 0.2 ppts.<br />
Occupancy and other operating expenses 30.6 30.7 0.1 ppts. 30.6 30.8 0.2 ppts.<br />
Restaurant margin 11.3% 11.4% (0.1) ppts. 11.5% 11.6% (0.1) ppts.<br />
Operating margin 18.0% 18.1% (0.1) ppts. 18.7% 18.0% 0.7 ppts.<br />
See accompanying notes.<br />
9
YUM! Brands, Inc.<br />
UNITED STATES Operating Results<br />
(amounts in millions)<br />
(unaudited)<br />
Quarter % Change Year to Date % Change<br />
9/5/09 9/6/08 B/(W) 9/5/09 9/6/08 B/(W)<br />
Company sales $ 879 $ 1,040 (15) $ 2,684 $ 3,133 (14)<br />
Franchise and license fees and income 176 175 1 516 500 3<br />
Total revenues 1,055 1,215 (13) 3,200 3,633 (12)<br />
Company restaurant expenses, net<br />
Food and paper 248 324 23 772 957 19<br />
Payroll and employee benefits 263 314 16 806 958 16<br />
Occupancy and other operating expenses 244 289 16 730 845 14<br />
755 927 19 2,308 2,760 16<br />
General and administrative expenses 109 125 12 330 384 14<br />
Franchise and license expenses 16 13 (16) 45 33 (36)<br />
Closures and impairment (income) expenses 4 4 NM 20 9 NM<br />
Other (income) expense — — — — — —<br />
884 1,069 17 2,703 3,186 15<br />
Operating Profit $ 171 $ 146 18 $ 497 $ 447 11<br />
Company sales 100.0% 100.0% 100.0% 100.0%<br />
Food and paper 28.3 31.1 2.8 ppts. 28.8 30.5 1.7 ppts.<br />
Payroll and employee benefits 29.9 30.2 0.3 ppts. 30.0 30.6 0.6 ppts.<br />
Occupancy and other operating expenses 27.7 27.9 0.2 ppts. 27.2 27.0 (0.2) ppts.<br />
Restaurant margin 14.1% 10.8% 3.3 ppts. 14.0% 11.9% 2.1 ppts.<br />
Operating margin 16.2% 12.0% 4.2 ppts. 15.5% 12.3% 3.2 ppts.<br />
See accompanying notes.<br />
10
YUM! Brands, Inc.<br />
Condensed Consolidatd Balance Sheets<br />
(amounts in millions)<br />
(unaudited)<br />
9/5/09 12/27/08<br />
ASSETS<br />
Current Assets<br />
Cash and cash equivalents $ 424 $ 216<br />
Accounts and notes receivable, less allowance: $30 in 2009 and $23 in 2008 241 229<br />
Inventories 116 143<br />
Prepaid expenses and other current assets 287 172<br />
Deferred income taxes 54 81<br />
Advertising cooperative assets, restricted 84 110<br />
Total Current Assets 1,206 951<br />
Property, plant and equipment, net of accumulated depreciation and amortization of $3,369 in<br />
2009 and $3,187 in 2008 3,844 3,710<br />
Goodwill 686 605<br />
Intangible assets, net 447 335<br />
Investments in unconsolidated affiliates 98 65<br />
Other assets 549 561<br />
Deferred income taxes 291 300<br />
Total Assets $ 7,121 $ 6,527<br />
LIABILITIES AND SHAREHOLDERS’ EQUITY (DEFICIT)<br />
Current Liabilities<br />
Accounts payable and other current liabilities $ 1,388 $ 1,473<br />
Income taxes payable 27 114<br />
Short-term borrowings 35 25<br />
Advertising cooperative liabilities 84 110<br />
Total Current Liabilities 1,534 1,722<br />
Long-term debt 3,258 3,564<br />
Other liabilities and deferred credits 1,340 1,335<br />
Total Liabilities 6,132 6,621<br />
Shareholders’ Equity (Deficit)<br />
Common stock, no par value, 750 shares authorized; 468 shares and 459 shares issued in<br />
2009 and 2008, respectively 202 7<br />
Retained earnings 979 303<br />
Accumulated other comprehensive income (loss) (279) (418)<br />
Total Shareholders’ Equity (Deficit) – YUM! Brands, Inc. 902 (108)<br />
Noncontrolling interest 87 14<br />
Total Shareholders’ Equity (Deficit) 989 (94)<br />
Total Liabilities and Shareholders’ Equity (Deficit) $ 7,121 $ 6,527<br />
See accompanying notes.<br />
11
YUM! Brands, Inc.<br />
Condensed Consolidated Statements of Cash Flows<br />
(amounts in millions)<br />
(unaudited)<br />
Year to Date<br />
9/5/09 9/6/08<br />
Cash Flows – Operating Activities<br />
Net income – including noncontrolling interest $ 865 $ 766<br />
Depreciation and amortization 385 389<br />
Closures and impairment (income) expenses 31 9<br />
Refranchising (gain) loss (9) 16<br />
Contributions to defined benefit pension plans (96) (7)<br />
Gain upon consolidation of a former unconsolidated affiliate in China (68) —<br />
Gain on sale of interest in Japan unconsolidated affiliate — (100)<br />
Deferred income taxes 59 (13)<br />
Equity income from investments in unconsolidated affiliates (29) (33)<br />
Distributions of income received from unconsolidated affiliates 29 40<br />
Excess tax benefit from share-based compensation (48) (32)<br />
Share-based compensation expense 39 44<br />
Changes in accounts and notes receivable 1 (18)<br />
Changes in inventories 34 (16)<br />
Changes in prepaid expenses and other current assets (26) (27)<br />
Changes in accounts payable and other current liabilities 2 23<br />
Changes in income taxes payable (87) 24<br />
Other non-cash charges and credits, net 53 82<br />
Net Cash Provided by Operating Activities 1,135 1,147<br />
Cash Flows – Investing Activities<br />
Capital spending (505) (583)<br />
Proceeds from refranchising of restaurants 91 142<br />
Acquisition of restaurants from franchisees (24) (9)<br />
Acquisitions and investments (75) —<br />
Sales of property, plant and equipment 16 58<br />
Other, net (8) (8)<br />
Net Cash Used in Investing Activities (505) (400)<br />
Cash Flows – Financing Activities<br />
Proceeds from long-term debt 499 375<br />
Repayments of long-term debt (522) (260)<br />
Revolving credit facilities, three months or less, net (289) 305<br />
Short-term borrowings by original maturity<br />
More than three months – proceeds — —<br />
More than three months – payments — —<br />
Three months or less, net 5 (15)<br />
Repurchase shares of Common Stock — (1,513)<br />
Excess tax benefit from share-based compensation 48 32<br />
Employee stock option proceeds 91 51<br />
Dividends paid on Common Stock (263) (234)<br />
Other, net (8) —<br />
Net Cash Used in Financing Activities (439) (1,259)<br />
Effect of Exchange Rate on Cash and Cash Equivalents — —<br />
Net Increase (Decrease) in Cash and Cash Equivalents 191 (512)<br />
Change in Cash and Cash Equivalents due to consolidation of entities in China 17 17<br />
Cash and Cash Equivalents - Beginning of Period $ 216 $ 789<br />
Cash and Cash Equivalents - End of Period $ 424 $ 294<br />
See accompanying notes.<br />
12
Reconciliation of Non-GAAP Measurements to GAAP Results<br />
(amounts in millions, except per share amounts)<br />
(unaudited)<br />
In addition to the results provided in accordance with U.S. Generally Accepted Accounting Principles (“GAAP”) throughout this<br />
document, the Company has provided non-GAAP measurements which present operating results in 2009 and 2008 on a basis before<br />
Special Items. Included in Special Items are the U.S. refranchising (gain) loss, charges relating to U.S. General and Administrative<br />
(“G&A”) productivity initiatives and realignment of resources, investments in our U.S. Brands, the 2009 loss recognized as a result of our<br />
decision to offer to refranchise an equity market outside the U.S., the 2009 gain upon our acquisition of additional ownership in, and<br />
consolidation of, the operating entity that owns the KFCs in Shanghai, China, and the 2008 gain on the sale of our minority interest in<br />
our Japan unconsolidated affiliate. These amounts are described in (d), (e), (f) and (g) in the accompanying notes.<br />
The Company uses earnings before Special Items as a key performance measure of results of operations for the purpose of evaluating<br />
performance internally. This non-GAAP measurement is not intended to replace the presentation of our financial results in accordance<br />
with GAAP. Rather, the Company believes that the presentation of earnings before Special Items provides additional information to<br />
investors to facilitate the comparison of past and present operations, excluding items in 2009 and 2008 that the Company does not<br />
believe are indicative of our ongoing operations due to their size and/or nature.<br />
Quarter<br />
Year to Date<br />
Detail of Special Items<br />
9/5/09 9/6/08 9/5/09 9/6/08<br />
Gain of the sale of our interest in our Japan unconsolidated affiliate $ — $ — $ — $ (100)<br />
Gain upon consolidation of a former unconsolidated affiliate in China — — (68) —<br />
Loss as a result of our offer to refranchise an equity market outside the U.S. 10 — 10 —<br />
U.S. Refranchising (gain) loss (8) (3) (23) 22<br />
Charges relating to U.S. G&A productivity initiatives and realignment of resources — 1 9 8<br />
Investments in our U.S. Brands 1 2 32 5<br />
Total Special Items (Income) Expense 3 — (40) (65)<br />
Tax (Benefit) Expense on Special Items 3 — (6) 24<br />
Special Items (Income) Expense, net of tax $ 6 $ — $ (46) $ (41)<br />
Average diluted shares outstanding 485 487 482 496<br />
Special Items diluted EPS $ (0.01) $ — $ 0.10 $ 0.08<br />
Reconciliation of Operating Profit Before Special Items to Reported Operating Profit<br />
Operating Profit before Special Items $ 473 $ 411 $ 1,175 $ 1,089<br />
Special Items Income (Expense) (3) — 40 65<br />
Reported Operating Profit $ 470 $ 411 $ 1,215 $ 1,154<br />
Reconciliation of EPS Before Special Items to Reported EPS<br />
Diluted EPS before Special Items $ 0.70 $ 0.58 $ 1.67 $ 1.45<br />
Special Items EPS (0.01) — 0.10 0.08<br />
Reported EPS $ 0.69 $ 0.58 $ 1.77 $ 1.53<br />
Reconciliation of Effective Tax Rate Before Special Items to Reported Effective Tax<br />
Rate<br />
Effective Tax Rate before Special Items 19.9% 21.6% 21.1% 22.6%<br />
Impact on Tax Rate as a result of Special Items 0.7% 0.1% (1.4)% 0.9%<br />
Reported Effective Tax Rate 20.6% 21.7% 19.7% 23.5%<br />
13
YUM! Brands, Inc.<br />
Segment Results<br />
(amounts in millions)<br />
(unaudited)<br />
Quarter Ended 9/5/09<br />
China<br />
Division YRI<br />
United<br />
States<br />
Corporate and<br />
Unallocated Consolidated<br />
Total revenues $ 1,063 $ 661 $ 1,055 $ (1) $ 2,778<br />
Company restaurant expenses 805 447 755 — 2,007<br />
General and administrative expenses 51 83 109 33 276<br />
Franchise and license expenses — 13 16 — 29<br />
Closures and impairment (income) expenses 2 (1) 4 — 5<br />
Refranchising (gain) loss — — — 4 4<br />
Other (income) expense (12) — — (1) (13)<br />
846 542 884 36 2,308<br />
Operating Profit (loss) $ 217 $ 119 $ 171 $ (37) $ 470<br />
Quarter Ended 9/6/08<br />
China<br />
Division YRI<br />
United<br />
States<br />
Corporate and<br />
Unallocated Consolidated<br />
Total revenues $ 874 $ 753 $ 1,215 $ — $ 2,842<br />
Company restaurant expenses 676 521 927 — 2,124<br />
General and administrative expenses 45 87 125 48 305<br />
Franchise and license expenses — 10 13 2 25<br />
Closures and impairment (income) expenses 1 (2) 4 — 3<br />
Refranchising (gain) loss — — — (8) (8)<br />
Other (income) expense (13) — — (5) (18)<br />
709 616 1,069 37 2,431<br />
Operating Profit (loss) $ 165 $ 137 $ 146 $ (37) $ 411<br />
The above table reconciles segment information, which is based on management responsibility, with our Consolidated Summary of<br />
Results. Corporate and unallocated expenses comprise reductions in franchise and license fees and income, general and<br />
administrative expenses, refranchising (gains) and losses and other (income) expense that are not allocated to segments for<br />
performance reporting purposes.<br />
14
YUM! Brands, Inc.<br />
Segment Results<br />
(amounts in millions)<br />
(unaudited)<br />
Year to Date Ended 9/5/09<br />
China<br />
Division YRI<br />
United<br />
States<br />
Corporate and<br />
Unallocated Consolidated<br />
Total revenues $ 2,473 $ 1,830 $ 3,200 $ (32) $ 7,471<br />
Company restaurant expenses 1,909 1,228 2,308 — 5,445<br />
General and administrative expenses 132 228 330 122 812<br />
Franchise and license expenses — 29 45 — 74<br />
Closures and impairment (income) expenses 8 3 20 — 31<br />
Refranchising (gain) loss — — — (9) (9)<br />
Other (income) expense (29) — — (68) (97)<br />
2,020 1,488 2,703 45 6,256<br />
Operating Profit (loss) $ 453 $ 342 $ 497 $ (77) $ 1,215<br />
Year to Date Ended 9/6/08<br />
China<br />
Division YRI<br />
United<br />
States<br />
Corporate and<br />
Unallocated Consolidated<br />
Total revenues $ 2,097 $ 2,184 $ 3,633 $ — $ 7,914<br />
Company restaurant expenses 1,645 1,517 2,760 — 5,922<br />
General and administrative expenses 121 253 384 140 898<br />
Franchise and license expenses — 25 33 5 63<br />
Closures and impairment (income) expenses 3 (3) 9 — 9<br />
Refranchising (gain) loss — — — 16 16<br />
Other (income) expense (32) (1) — (115) (148)<br />
1,737 1,791 3,186 46 6,760<br />
Operating Profit (loss) $ 360 $ 393 $ 447 $ (46) $ 1,154<br />
The above table reconciles segment information, which is based on management responsibility, with our Consolidated Summary of<br />
Results. Corporate and unallocated expenses comprise reductions in franchise and license fees and income, general and<br />
administrative expenses, refranchising (gains) and losses and other (income) expense that are not allocated to segments for<br />
performance reporting purposes.<br />
15
Notes to the Consolidated Summary of Results, Condensed Consolidated Balance Sheets<br />
and Condensed Consolidated Statements of Cash Flows<br />
(amounts in millions, except per share amounts)<br />
(unaudited)<br />
(a) Percentages may not recompute due to rounding.<br />
(b) Amounts presented as of and for the quarter and year to date ended September 5, 2009 are preliminary.<br />
(c) China Division Other (income) expense includes equity income from our investments in unconsolidated affiliates. In the year to date<br />
ended September 5, 2009, Unallocated Other (income) expense includes the gain upon our acquisition of additional ownership in,<br />
and consolidation of, the operating entity that owns the KFCs in Shanghai, China (See note d). In the year to date ended<br />
September 6, 2008, Unallocated Other (income) expense includes the pre-tax gain on the sale of our unconsolidated affiliate in<br />
Japan (see Note g).<br />
(d) On May 4, 2009 we acquired an additional 7% ownership in the entity that operates the KFCs in Shanghai, China for $12 million,<br />
increasing our ownership to 58%. This entity has historically been accounted for as an unconsolidated affiliate. As part of the<br />
acquisition we received additional rights in the governance of the entity such that we began consolidating the entity upon<br />
acquisition. As required by Statement of Financial Accounting Standards (“SFAS”) No. 141(R), “Business Combinations” (“SFAS”<br />
141(R)), we remeasured our previously held 51% ownership in the entity at fair value and recognized a gain of $68 million<br />
accordingly. This gain, which resulted in no related income tax expense, was recorded as unallocated other income during the<br />
quarter ended June 13, 2009 and has been reflected as a Special Item for certain performance measures (see accompanying<br />
reconciliation to reported results). For the quarter and year to date ended September 5, 2009 the consolidation of this entity<br />
increased Company sales by $82 million and $105 million, respectively, and decreased Franchise and license fees and income by<br />
$5 million and $6 million, respectively. The consolidation of this entity positively impacted Operating Profit by $5 million for both the<br />
quarter and year to date ended September 5, 2009. While we have not yet finalized the determination of all identifiable assets and<br />
liabilities assumed upon acquisition, our Condensed Consolidated Balance Sheet at September 5, 2009 reflects consolidation of<br />
this entity, including $60 million in goodwill and $70 million in Noncontrolling interest (which was also required to be remeasured to<br />
fair value at the acquisition date per SFAS 141(R)).<br />
(e) As part of our plan to transform our U.S. business we took several measures in 2008 and are taking similar measures in 2009 that<br />
we do not believe are indicative of our ongoing operations. These measures (“the U.S. business transformation measures”) include:<br />
expansion of our U.S. refranchising, potentially reducing our Company ownership in the U.S. to below 10%; charges relating to G&A<br />
productivity initiatives and realignment of resources (primarily severance and early retirement costs); and investments in our U.S.<br />
Brands made on behalf of our franchisees such as equipment purchases. We have traditionally not allocated refranchising (gains)<br />
losses for segment reporting purposes and will not allocate the costs associated with the productivity initiatives, realignment of<br />
resources and investments in our U.S. Brands to the U.S. segment. Additionally, these items have been reflected as Special Items<br />
for certain performance measures (see accompanying reconciliation to reported results). Investments in our U.S. Brands recorded<br />
in 2009 reflect our reimbursements to KFC franchisees for installation costs of ovens for the national launch of Kentucky Grilled<br />
Chicken and have been recorded as a reduction of Franchise and license fees and income.<br />
(f) During the quarter ended September 5, 2009 we recognized a $10 million refranchising loss as a result of our decision to offer to<br />
refranchise an equity market outside the U.S. This loss, which resulted in no related income tax benefit, was recorded as<br />
refranchising loss which we have traditionally not allocated for segment reporting purposes. The loss has also been reflected as a<br />
Special Item for certain performance measures (see accompanying reconciliation to reported results) given the amount and<br />
strategic nature of refranchising an entire equity market.<br />
(g) During December 2007, we sold our interest in our unconsolidated affiliate in Japan for $128 million in cash (includes the impact of<br />
related foreign currency contracts that were settled in 2007). Our international subsidiary that owned this interest operates on a<br />
fiscal calendar with a period end that is approximately one month earlier than our consolidated period close. Thus, consistent with<br />
our historical treatment of events occurring during the lag period, the pre-tax gain on the sale of this investment was recorded in the<br />
quarter ended March 22, 2008 as other income and was not allocated to any segment for reporting purposes. However, the cash<br />
proceeds from this transaction were transferred from our international subsidiary to the U.S. in December 2007 and were thus<br />
reported on our Consolidated Statement of Cash Flows for the year ended December 29, 2007. Additionally, this transaction was<br />
reflected as a Special Item for certain performance measures (see accompanying reconciliation to reported results).<br />
16
(h) In connection with our U.S. business transformation measures our reported segment results began reflecting increased allocations<br />
of certain expenses in 2009 that were previously reported as corporate and unallocated expenses. While our consolidated results<br />
were not impacted, we believe the revised allocation better aligns costs with accountability of our segment managers. These<br />
revised allocations are being used by our Chairman and Chief Executive Officer, in his role as chief operating decision maker, in his<br />
assessment of operating performance. We have restated segment information for the quarter and year to date ended September 6,<br />
2008 to be consistent with the current period presentation. We expect that on a full year basis approximately $50 million and $5<br />
million of Unallocated and corporate G&A will be reclassified to the U.S. and YRI segments, respectively, as we present 2009<br />
results. The following table summarizes the impact of the revised allocations by segment for the quarter and year to date ended<br />
September 6, 2008:<br />
Increase/(Decrease) Quarter Year to date<br />
U.S. G&A $ 12 $ 36<br />
YRI G&A 1 4<br />
Unallocated and corporate G&A expenses (13) (40)<br />
(i) Effective the beginning of fiscal 2009 we adopted SFAS No. 160, “Noncontrolling Interests in Consolidated Financial Statements”<br />
(“SFAS 160”). SFAS 160 required that net income attributable to the minority interest in the entity that operates the KFCs in Beijing,<br />
China be reported separately on the face of our Consolidated Summary of Results. In 2008 we reported Operating Profit<br />
attributable to the minority interest as an Other expense and the related tax benefit as a reduction to our Income tax provision.<br />
Additionally, SFAS 160 required that the portion of equity in the entity not attributable to the Company be reported within equity,<br />
separately from the Company’s equity, in the Condensed Consolidated Balance Sheet. In 2008 we reported this amount within<br />
Other liabilities and deferred credits. As required, the presentation requirements of SFAS 160 were applied retroactively to the<br />
quarter and year to date ended September 6, 2008. Net income attributable to this noncontrolling interest was $4 million and $7<br />
million in the quarter and year to date ended September 5, 2009, respectively.<br />
17