Multibranding - Yum!
Multibranding - Yum!
Multibranding - Yum!

You also want an ePaper? Increase the reach of your titles
YUMPU automatically turns print PDFs into web optimized ePapers that Google loves.
YUM! BRANDS 2003 ANNUAL CUSTOMER MANIA REPORT<br />
Power<br />
<strong>Yum</strong>!<br />
of
Dear Partners, I’m pleased to report 2003 2003 was was a a year year where<br />
where<br />
we showed the underlying power of our global portfolio of<br />
leading restaurant brands. With continued profitable international<br />
expansion led by dynamic growth in China, combined<br />
with strong momentum at Taco Bell in the United States, we<br />
achieved 13% earnings per share growth prior to special items.<br />
Table of Contents<br />
Infc Dear Partners<br />
7 <strong>Yum</strong>! Dynasty Model<br />
8 Global Powerhouse<br />
10 <strong>Yum</strong>! Restaurants International<br />
continues to be our Growth Engine!<br />
12 Brand Power x5<br />
14 Taco Bell<br />
Think Outside the the Bun<br />
Bun<br />
This growth was achieved in spite of a challenging worldwide environment which included war<br />
in Iraq, SARS in Asia, and a generally soft economy the first half of the year. Highlights include<br />
over $1 billion in operating profit, over $1 billion in cash from operating activities, and nearly<br />
$1 billion in franchise fees. In so doing, we once again achieved one of the industry’s leading<br />
returns on invested capital at 18%. After paying off $2.6 billion in debt the past six years, we<br />
now have the power of an investment-grade quality balance sheet. Given this strong performance<br />
and increasing financial strength, our share price climbed 42% in 2003, and our annual return<br />
to shareholders is 14% since becoming a public company in 1997.<br />
Going forward, we are quite confident we can continue to achieve our goals of growing our<br />
earnings per share at least 10% each year. We have three powerfully unique growth opportunities<br />
that differentiate us from our competition. After reading this report, I hope you’ll agree<br />
that we are NOT YOUR ORDINARY RESTAURANT COMPANY.<br />
Let me explain why we think so.<br />
#1. Driving Profitable GLOBAL Growth<br />
On the international front we have an undeniable competitive advantage and<br />
undeniable growth opportunity with two global brands, KFC and Pizza Hut.<br />
This year we set another record as we opened 1,108 new restaurants outside<br />
the United States. That’s the third year in a row we’ve opened 1,000 or more.<br />
<strong>Yum</strong>! Restaurants International is now our largest and fastest growing division, generating<br />
$441 million in operating profit and 22% growth in 2003. To put this in perspective, the international<br />
team contributed $172 million in 1997, excluding charges for facility actions.<br />
The root of this exciting growth stems from the competitive advantage of the tremendous<br />
infrastructure we already have in place. Today, we have strong local teams around the world,<br />
operate in over 100 countries with established supply chains, and have nearly 600 international<br />
franchisees.<br />
16 Pizza Hut<br />
Gather ’Round the Good Stuff<br />
18 KF KFC KF C What’s Cookin’<br />
20 Long John Silver’s/A&W<br />
22 Power of of Choice<br />
Choice<br />
24 Customer Mania Power<br />
26 100% 100% CHAMPS CHAMPS with with a a Yes!<br />
Yes!<br />
28 Running Running Great Great Restaurants<br />
Restaurants<br />
29 <strong>Yum</strong>! At-a-glance<br />
30 Global Facts<br />
31 Unit Information<br />
32 Power of Results:<br />
<strong>Yum</strong>! Financial Highlights<br />
33 Financials<br />
Inbc Power of Giving Back
We’re continuing to<br />
focus our international<br />
company operations<br />
investment in seven<br />
countries.<br />
We thank our friends from PepsiCo who invested billions of dollars to establish the global network<br />
we inherited for both KFC and Pizza Hut. The happy reality is that it would take years of investment<br />
for any of our competitors to reach our size and scale (with the obvious exception of McDonald’s,<br />
which already makes $1.6 billion outside the U.S., demonstrating the size of the prize).<br />
Our plan is to leverage our big scale markets. We have 11 countries and franchise business units<br />
that have almost 500 restaurants or more. We’re continuing to focus our international company<br />
operations investment in seven of these countries that account for over 70% of our international<br />
operating profit. Our franchise and joint venture partners are driving system growth by opening more<br />
than 70% of our new international restaurants. Importantly, our franchisees are using their capital,<br />
not ours, to grow their business since we strategically elected not to invest in our franchisees’ real<br />
estate, like some other franchisors do. We love the high return franchise business!<br />
The silver bullet in our portfolio has to be China. What a business and what an incredible<br />
opportunity! KFC and Pizza Hut already have 1,000 and 120 restaurants in China, respectively.<br />
We have a senior tenured team that has worked together for over ten years, building<br />
the business from scratch to where we now make $157 million in operating profit, up 42%<br />
versus a year ago.<br />
In addition, we have the unique advantage of owning our own food distribution system that<br />
gives us coverage in every major Chinese province and access to almost the entire 1.3 billion<br />
population. We also have one of the largest real estate teams of any retailer in the world that<br />
opened up 270 new restaurants in 2003. Our China operations are also best in class, with a<br />
highly educated workforce (64% of the restaurant general managers have at least a college<br />
education, the rest are plain smart!). We estimate there are 450 million urban customers who<br />
can afford our food in the fastest growing economy in the world. KFC is already the Chinese<br />
customers’ favorite brand and Pizza Hut is the number one casual dining chain. We just opened<br />
a Taco Bell Grande dine-in format that is off to a great start. The Chinese love our food and<br />
we love China. I’ve said it before and I’ll say it again, there is no doubt in my mind that one<br />
day we will have more restaurants in China than we do in the U.S.<br />
Above: The United Kingdom, one of our<br />
key high-growth markets, accounted<br />
for $97 million in operating profi t in<br />
2003.<br />
Left: Seventeen years after opening<br />
the fi rst KFC in China, <strong>Yum</strong>! Brands<br />
celebrated the opening of its 1,000th<br />
restaurant, located in Beijing.<br />
Right: KFC in China gathered all<br />
of its 1,000 Restaurant General<br />
Managers together as part of its<br />
Annual Convention to mark the<br />
1,000th restaurant milestone.<br />
1.
2.<br />
We are now the leading global developer of new<br />
restaurants. We’ve created the equivalent of a new<br />
division in China, which recently opened its 1,000th<br />
KFC and made $157MM in 2003.<br />
We want to<br />
continue to add<br />
at least 1,000 new units<br />
outside the U.S.,<br />
each year, and do it profitably.<br />
Top: Pizza Hut Korea President<br />
In-soo Cho serves up some of the<br />
new menu items in the world’s<br />
fi rst Pizza Hut Plus, which opened<br />
in Seoul during 2003.<br />
Bottom: A new, 70-item menu highlights<br />
the world’s fi rst Pizza Hut<br />
Plus restaurant in Korea. In addition<br />
to the usual array of pizzas, the<br />
restaurant features a wide variety<br />
of appetizers, salads, pasta and<br />
beverages.<br />
The biggest short-term international challenge we face is turning around our Mexico business.<br />
We have nearly 500 restaurants in Mexico that only made in total about $10 million in 2003,<br />
which is well below expectations. The good news is we have a talented team working hard to turn<br />
around same-store sales in this tough macro environment. In the meantime, we have temporarily<br />
pulled back on new Mexico development while we rebuild our existing business. We have so<br />
many profitable growth opportunities in other countries that we can turn off the capital faucet in<br />
a country, like Mexico, when we have a significant downturn and readily redeploy that capital in<br />
other markets. We want to continue to add at least 1,000 international new units each year AND<br />
we want to do it profitably. Consider this: excluding China, we only have 6,000 KFCs and 4,000<br />
Pizza Huts compared to the 16,000 units McDonald’s has in international markets outside of<br />
China. With this kind of opportunity, we believe that we can continue to profitably grow at our<br />
1,000+ new unit pace for many years without being heroic or foolishly chasing numbers.<br />
Our most significant longer term challenge is developing new markets … getting to scale in<br />
Continental Europe, Brazil and India. This is tough sledding because building consumer awareness<br />
and acceptance takes time. It also takes time to build local operating capability. Our<br />
approach is to be patient and ever mindful of our overall profitability and returns. The promise<br />
is obvious.<br />
Here are key measures for international: 15% operating profit growth per year, at least 7% system<br />
sales growth before foreign currency conversion, 1,000+ new units outside the U.S. and 20%<br />
return on invested capital.<br />
In the U.S., Taco Bell is now the second most profitable QSR brand and just celebrated hitting<br />
the $1 million mark for average unit volumes. In 2003, company same-store sales were up 2%<br />
on top of 7% growth the previous year.<br />
This result is coming from steadily improving operations and exceptional marketing. Taco Bell<br />
is now ranked #2 in QSR Magazine’s Annual Study for overall drive-thru service. And Taco Bell’s<br />
“Think Outside the Bun” advertising campaign and strong new product pipeline is among the<br />
best in the industry.<br />
Our biggest disappointment in the U.S. this year was negative 1% and negative 2% company<br />
same-store sales growth at Pizza Hut and KFC, respectively. However, 2003 was a year of steady<br />
progress at Pizza Hut as the brand showed positive same-store sales growth seven of the last<br />
eight periods in 2003. Most importantly, the Pizza Hut team laid a strong growth foundation<br />
for this year and beyond. The brand was repositioned to target the heart of the pizza category<br />
focusing on the family and the primary decision maker, Mom.
We are the leader in the chicken, pizza, seafood &<br />
Mexican quick service categories.<br />
A new advertising campaign, “Gather ’Round the Good Stuff ,” was launched and is gaining<br />
traction with customers. The new product pipeline has been rebuilt with a record number of<br />
product and concept tests.<br />
Pizza Hut is also steadily improving its operations and is the first one of our brands to achieve<br />
team member turnover of less than 100% for the full year … 99.6% to be exact (the industry<br />
average is nearly 200%).<br />
While KFC is incredibly strong internationally, it is clearly our biggest challenge in the U.S. We<br />
are, however, confident the new management team we put in place is taking the right actions<br />
to turn the brand around.<br />
We plan a major relaunch of KFC in the second half of 2004, featuring a new menu board that<br />
features a roasted line of new products and everyday value meals. We are also emphasizing<br />
the fact that our chicken is brought to our restaurants fresh, not frozen, every day.<br />
Just as importantly for KFC, we are making steady progress in speed of service as we roll out<br />
the same drive-thru program that worked so effectively for Taco Bell. One big advantage we<br />
have is the ability to spread our best practices.<br />
Key measures in the U.S.: At least 7% operating profit growth per year and at least 1–2%<br />
same-store sales growth.<br />
#2. <strong>Multibranding</strong> Great Brands<br />
Our goal is to be the best in the world at providing branded restaurant choice.<br />
We have category-leading brands that are highly successful on a stand-alone<br />
basis. As a result, we are structured with fully staffed marketing and operating<br />
teams who wake up every single day focused on driving each brand’s differentiation,<br />
relevance and energy. Given the power of these individual brands, we<br />
have the opportunity to literally change the quick service restaurant industry<br />
as you know it today by offering two of our great brands in the same restaurant<br />
… we call this strategy multibranding.<br />
<strong>Multibranding</strong> gives us the competitive advantage of branded variety. It is already a big business<br />
for <strong>Yum</strong>!, accounting for 12% of our U.S. traditional restaurant base and generating almost<br />
$185 million in U.S. company store profits and franchise fees. Our learnings this year make<br />
With the acquisition of A&W and<br />
Long John Silver’s in 2002, we tripled<br />
our multibrand potential in the U.S.<br />
No one else has our brand portfolio<br />
power.<br />
<strong>Multibranding</strong><br />
gives us the competitive<br />
advantage of<br />
branded variety.<br />
3.
4.<br />
We are more confident than ever that multibranding<br />
is potentially the biggest sales and profit driver in the<br />
restaurant industry since the drive-thru window.<br />
us more confident than ever that multibranding is potentially the biggest sales and profit driver<br />
in the restaurant industry since the introduction of the drive-thru window.<br />
We started with combinations of KFC/Taco Bell and Taco Bell/Pizza Hut Express. We learned that<br />
we were able to add significant incremental average sales per unit, dramatically improving our<br />
unit cash flows. Our franchisees then pioneered multibrand combinations of KFC and Taco Bell<br />
with Long John Silver’s, the country’s leading seafood restaurant, and A&W All American Food,<br />
which offers pure-beef hamburgers and hot dogs along with its signature Root Beer Float. Based<br />
on outstanding customer feedback and results, we acquired Long John Silver’s and A&W in<br />
2002. With this acquisition we tripled our multibranding potential in the U.S.<br />
We can now open high return new restaurants in trade areas that used to be too expensive or<br />
did not have enough population density to allow us to go to market with one brand. With multibranding,<br />
we believe we can take both KFC and Taco Bell to 8,000 units in the U.S. compared<br />
to the over 5,000 each we have today. As we expand, we expect to take volumes to an average<br />
of at least $1.1 million per restaurant.<br />
One of the most exciting learnings we had in 2003, is that Long John Silver’s is performing<br />
even better than expected …we call it our hidden jewel. That’s because there is no national<br />
fish competitor in the QSR industry and consequently there is pent-up consumer demand for<br />
seafood. In addition to outstanding sales results with KFC and Taco Bell, we have created a<br />
Long John Silver’s/A&W combination that allows us to expand into “home-run” trade areas<br />
where we know demand is high and KFC and Taco Bell are already there. The results have led<br />
us to a “fish first” strategy with the goal of making Long John Silver’s a national brand.<br />
I’m also pleased to report that we have created on our own a new multibrand concept called<br />
WingStreet, which is a tasty line of flavored bone-in and bone-out chicken wings. We believe that<br />
WingStreet can be an ideal multibrand partner for Pizza Hut’s delivery service. Initial customer<br />
response is promising. We also acquired Pasta Bravo, a California fast casual chain with an<br />
outstanding line of pastas at great value, to be a partner brand with Pizza Hut’s traditional<br />
dine-in restaurants. Franchise testing is underway. We are confident multibranding will be every<br />
bit as successful at Pizza Hut as it has been for our other brands.<br />
In last year’s report, I stated that the biggest multibranding challenge is building the operating<br />
capability to successfully run these restaurants. That’s still a fact. With branded variety comes<br />
complexity. However, we have structured and invested to drive execution and it’s paying off.<br />
We now have a fully dedicated team of operating experts who have improved back of house<br />
Top: The popularity of the Long<br />
John Silver’s brand grew in 2003<br />
as it became the partner-of-choice<br />
in <strong>Yum</strong>!’s new Multibrand restaurants.<br />
This year, <strong>Yum</strong>! has adopted<br />
a “fi sh fi rst” strategy of using the<br />
Multibrand development concept to<br />
get Long John Silver’s distribution up<br />
to at least 3,000 units and make it a<br />
national brand.<br />
Bottom: <strong>Multibranding</strong> offers our<br />
customers more choice and convenience<br />
by bringing together two of<br />
our great brands under one roof.
Customer Mania is about having a Yes! attitude,<br />
culture and mindset 100% of the time.<br />
integration and systems, value engineered our facilities, developed WOW building designs<br />
and most importantly, improved people capability. While execution still remains our number<br />
one challenge, we are getting better and better. Improved margins and customer measures<br />
are evidence. Further proof in the pudding is that 50% of our multibranding units are being<br />
opened by franchisees who are putting their own hard-earned money into the game because<br />
they believe that the payout is there.<br />
Again, this multibranding opportunity is unique to <strong>Yum</strong>! We clearly have first mover advantage.<br />
No one else has our brand portfolio power, plus our operational learnings put us well ahead<br />
of the pack.<br />
<strong>Multibranding</strong> key measures: 500+ U.S. multibrand additions per year and at least mid-teen<br />
internal rates of return.<br />
#3. Running Great Restaurants<br />
While we have pockets of excellence around the globe, our customers are<br />
telling us we could only give ourselves a “C” or mediocre grade in operations<br />
execution. We’re making progress as we’ve climbed from the bottom to the<br />
middle of the pack versus competition, but mediocrity is miserable from our<br />
point of view. The bright side is we now have the key processes in place that<br />
are necessary to be a great restaurant operating company. We have standardized<br />
and are now implementing our best operating practices around the world:<br />
Customer Mania Training, CHAMPS (which measures operational basics like<br />
Cleanliness, Hospitality, Accuracy, Maintenance, Product Quality and Speed),<br />
Balanced Scorecard, CHAMPS Excellence Review and Bench Planning. The<br />
key now is to execute these tools that we know work with urgency.<br />
As we do, we are fixated on two key measures that reflect the kind of consistency we want to<br />
drive across <strong>Yum</strong>! Brands:<br />
1) SAME-STORE SALES GROWTH IN EVERY STORE.<br />
2) 100% CHAMPS WITH A YES! ATTITUDE IN EVERY STORE.<br />
Why are these two measures so important? If we are driving same-store sales growth, we<br />
are doing a better job of satisfying more customers. If we are achieving 100% CHAMPS with a<br />
Yes! attitude, we are giving our customers the basic experience they deserve and expect. Of<br />
course, the opposite is true when we don’t.<br />
If we’re achieving<br />
100% CHAMPS with a<br />
Yes! attitude, we’re giving<br />
our customers the experience<br />
they deserve and expect.<br />
At A&W All American Food, customers<br />
keep coming back for our pure 100%<br />
ground beef burgers served hot, fresh<br />
and sizzling every time. Our delicious<br />
Double Bacon Cheeseburger,<br />
pictured below, is our number one<br />
selling burger!<br />
5.
6.<br />
We are are anything anything but but your your ordinary ordinary restaurant company.<br />
Our goal is to be the<br />
best restaurant operator<br />
in our industry.<br />
DavidC. Novak<br />
Chairman and Chief<br />
Executive Offi cer<br />
<strong>Yum</strong>! Brands, Inc.<br />
Exciting products are constantly<br />
coming through the pipeline at <strong>Yum</strong>!’s<br />
individual brands. One such product<br />
is Taco Bell’s Cheesy Gordita Crunch,<br />
delivering the dynamic contrast of a<br />
crunchy taco shell inside a warm, soft<br />
Gordita fl atbread held together with a<br />
melted three-cheese blend.<br />
We obviously have a major opportunity to improve. For example, at Taco Bell where we had<br />
our best U.S. company same-store sales growth of +2% in 2003, only 66% of our restaurants<br />
had sales growth and only 42% of the CHAMPS scores reached 100%. We have uneven performance<br />
like this at every brand in almost every country in the world. This only shows us how<br />
much upside we have to grow by Running Great Restaurants.<br />
We are striving to train 840,000 team members across our system once a quarter on how<br />
to be Customer Maniacs. We began this training this year and turnover is down, complaints<br />
are down, and compliments are up. CHAMPS scores are improving. We’re making progress<br />
but we know we can and must get better. Our goal is to be the best restaurant operator in<br />
our industry.<br />
As we march ahead, our entire organization is focused on building what we call the <strong>Yum</strong>!<br />
Dynasty, driving consistent results year after year, which is a trademark of truly great companies<br />
and rising shareholder value. On the next page you can see the roadmap we’ve laid out<br />
for dynasty-like performance, along with some of my handwritten comments I always include<br />
in my New Year’s letter to our restaurant teams.<br />
What you can’t see in our numbers, but I hope you can get a sense of in this report, is the power<br />
of the worldwide culture we are building. It’s a high energy, people capability first, customer<br />
mania culture that is centered on spirited recognition that drives performance. If you talk to<br />
our people, you’d hear a universal conviction that the culture we are building is our true secret<br />
weapon. I’m confident we will execute our unique strategies because our outstanding people<br />
and our tremendous franchisees are galvanized around building our business the right way.<br />
In particular, I especially want to thank the Restaurant General Managers who have driven their<br />
same-store sales and achieved 100% CHAMPS scores. You are our number one leaders for a<br />
reason. Only RGMs can build the team of Customer Maniacs that can satisfy our customers.<br />
I appreciate your daily focus to deliver 100% CHAMPS every shift and your passion to build a<br />
team of 100% Customer Maniacs. I tell everyone the basic truth of our business: “Show me a<br />
great RGM and I’ll show you a great restaurant.” That’s because customers see the difference<br />
in the service and we see the difference in our profits.<br />
I’d also like to thank our dedicated Board of Directors, especially Ron Daniel and John Weinberg<br />
who retired this year, for their contributions and passion for helping us build dynasty-like<br />
performance.<br />
We have the power of <strong>Yum</strong>! and a great future. I hope you agree we are anything but your<br />
ordinary restaurant company.<br />
YUM! TO YOU!<br />
DavidC. Novak<br />
Chairman and Chief Executive Officer<br />
<strong>Yum</strong>! Brands, Inc.
global<br />
“power
house”
10.<br />
I’m very pleased that our international<br />
business continues to set<br />
new records in terms of revenues,<br />
operating profits and new unit<br />
development. In 2003, we achieved<br />
$2.7 billion in revenues, operating<br />
profits of $441 million and return<br />
on invested capital of 20%.<br />
What’s more, <strong>Yum</strong>! Restaurants International is a growth<br />
engine. We’ve added more than 1,000 new international<br />
restaurants a year over the past three years, including<br />
1,108 new international restaurant openings in 2003, our<br />
best year yet. We’ve achieved this growth while more than<br />
doubling our operating profits since <strong>Yum</strong>! Brands became<br />
a public company in 1997.<br />
We believe that no other restaurant company has the kind<br />
of opportunity that we do outside of the United States. We<br />
continue to focus our international company operations<br />
investment in seven key countries that account for over 70%<br />
of our international operating profit. Each of these markets is<br />
well established with powerful brands, powerful local teams<br />
and even more powerful growth potential. Our franchise and<br />
joint venture partners are driving system growth by opening<br />
more than 70% of our new international restaurants. They<br />
are using their capital, not ours, because they also see the<br />
tremendous growth potential of our global brands.<br />
With over 12,000 units in over 100 countries and territories<br />
generating 22% operating profit growth, it’s easy to see why<br />
our international business truly is a global powerhouse.<br />
<strong>Yum</strong>! Restaurants International<br />
continues to be our Growth Engine!<br />
Operating Profi ts (in dollars)<br />
Mexico<br />
$10MM<br />
South Korea<br />
$33MM<br />
Pete Bassi, Chairman, <strong>Yum</strong>! Restaurants International<br />
Australia/New Zealand<br />
$44MM<br />
UK<br />
$97MM<br />
China<br />
$157MM
China continues to be our Rising Star, driving doubledigit<br />
sales growth for the fifth consecutive year and<br />
record operating profit up over 42% in 2003.<br />
rising star<br />
Since opening the first KFC restaurant in Beijing in 1987, China continues to be the rising star of our international business.<br />
In 2003, we celebrated the opening of our 120th Pizza Hut restaurant and recently, the opening of our 1,000th KFC — and we<br />
continue to add over 200 restaurants a year. KFC is the leading restaurant brand in China and is widening the gap between<br />
our nearest competitor. In fact, a J.D. Powers survey two years ago rated KFC as the leading brand in any category — among<br />
every company doing business in China! And we’re proud Pizza Hut also has become the leader in the casual dining category.<br />
We also opened our first Taco Bell Grande restaurant in 2003, introducing the Chinese people to the great taste of Mexican<br />
food! All of this progress, and we aren’t even close to reaching our full potential there. There’s no doubt in our mind that<br />
China is going to be a global economic powerhouse for the longer term. In fact, we want to be the dominant Quick Service<br />
Restaurant leader in every major category in China, and we have the infrastructure and the leaders to make sure that our<br />
star continues to rise!<br />
Asia has become a dominant marketplace<br />
for <strong>Yum</strong>! Brands products. While<br />
Pizza Hut and KFC are long-time<br />
players in Asia, Taco Bell strengthened<br />
its position in the market in May 2003<br />
with the opening of its fi rst Taco Bell<br />
in China — a table-service restaurant<br />
called Taco Bell Grande.<br />
Above right: Sam Su (center), President,<br />
<strong>Yum</strong>! Restaurants China, helps celebrate<br />
the 1,000th KFC in that country.<br />
11.
“brand
power”<br />
x5
14.<br />
“ Think Outside the Bun.”
2003 was another solid year for Taco Bell —<br />
filled with terrific products and results. Our<br />
Customer Mania culture helped drive company<br />
same-store sales growth of 2% — and for the<br />
first time — our system average unit volume<br />
® exceeded $1,000,000.<br />
Mexican-inspired products like our delicious tacos, filling<br />
burritos, signature quesadillas, and innovative Border Bowls®<br />
had customers coming back for that “Taco Bell taste” you can’t<br />
get anywhere else. And 2004 promises some great specialty<br />
items as part of our new Big Bell Value Menu.<br />
The Taco Bell team is also delighting our customers with<br />
a more consistent, satisfying experience every time they<br />
visit — and we’re seeing particular progress during Late Night.<br />
We’re proud of the fact that QSR Magazine rated us second<br />
in the overall drive-thru experience in their 2003 Drive-Thru<br />
Survey. And even our internal operations measurement — or<br />
CHAMPS performance — tells us that we’re on the right track<br />
and providing a more consistent customer experience.<br />
We’re thrilled to see our customer compliments up 59% over<br />
last year — and our employees are telling us they’re more satisfied<br />
as well! In fact, we’re proud our team member turnover is<br />
down to 107% in 2003 from 221% in 2001.<br />
I hope you’ll agree we’ve made solid progress this year, but<br />
we believe many opportunities remain — and we’re committed<br />
to even better results in 2004. It’s our passion around People<br />
Capability, Operations Excellence,<br />
Innovative Products and Marketing,<br />
that will entice more and more hungry<br />
customers to Think Outside the Bun!<br />
Emil Brolick<br />
President and Chief Concept Offi cer, Taco Bell<br />
15.
16.<br />
“ Gather ’Round the Good Stuff.”<br />
Despite a challenging environment in<br />
2003, Pizza Hut made steady progress<br />
in the second half of the year by growing<br />
company same-store sales in seven of<br />
the last eight periods. This was due, in<br />
large part, to the success of a brand new<br />
and exciting marketing campaign that<br />
invites our customers to “Gather ’Round<br />
the Good Stuff .”<br />
Our new advertising, products and promotions reinforce that<br />
we’re the family pizza company for nearly 50 million Pizza Hut<br />
customers each week. In 2003, we introduced family-friendly<br />
products like our first-to-market, lower fat Fit ’N Delicious pizzas. And we launched some family-focused promotions, like<br />
our DVD offer with every pizza purchase at menu price... giving<br />
our customers another fun way to gather around our delicious<br />
pizzas. We also tested a range of new products that we’ll take<br />
to market in 2004, like the recently launched 4ForAll® pizza,<br />
offering four separate pizzas in one box.<br />
I’m also proud Pizza Hut achieved the lowest team member<br />
turnover in the industry, at 99.6%. Our leaders have made great<br />
strides in delivering 100% CHAMPS with a Yes! attitude to each<br />
of our customers, and the results are not going unnoticed. In fact,<br />
customers in the 2003 Customer Satisfaction report from the<br />
University of Michigan rated Pizza Hut 7% better than in 2002.<br />
We’re going to keep working hard to convince more and more<br />
customers to “Gather ’Round the Good<br />
Stuff ” with Pizza Hut pizzas.<br />
Peter Hearl<br />
President and Chief Concept Offi cer, Pizza Hut
17.
18.<br />
KFC What’s Cookin’
2003 was a challenging year for KFC. Early<br />
in the year we had some success with Honey<br />
BBQ Boneless Wings, which drove samestore<br />
sales by 6%, however our sales for the<br />
balance of the year declined. After listening<br />
to the voice of our customers, we have identified<br />
the critical issues that have caused our customers to visit<br />
us less frequently. Simply put, our customers told us we need to<br />
be more Relevant, and more Reliable. We’re going to respond by<br />
working hard to rebuild that trust, and re-earn customer loyalty.<br />
We have a plan in place for a fresh, exciting KFC, one that our<br />
customers will consider Relevant and Reliable. We began that<br />
journey toward the end of the year by introducing ads that invite<br />
our customers to KFC What’s Cookin’, which got people talking<br />
about our unbeatable fried chicken. We then were named as<br />
one of the top 10 fastest drive-thru restaurants in America by<br />
QSR Magazine, a major win on the operations front. Building<br />
on this momentum, in 2004 we will be introducing new, delicious<br />
non-fried products, outstanding value meals, better-run<br />
restaurants, new menu boards and improved product packaging.<br />
And we’re not going to stop there….You’ll see a whole new<br />
advertising campaign that will remind our customers that our<br />
fried chicken is kitchen-fresh. And one of America’s hottest<br />
race car drivers, Dale Earnhardt Jr., will be behind the wheel<br />
of the new KFC car, convincing our customers to rush to KFC<br />
this summer for our Finger Lickin’ Good fried chicken.<br />
As you can see, there’s a lot cookin’<br />
at KFC.<br />
Gregg Dedrick<br />
President and Chief Concept Offi cer, KFC<br />
19.
20.<br />
“ Surfs up... Time for a Frosty Float.”
Surf’s Up. Long John Silver’s is the clear<br />
leader in quick-service seafood, with a<br />
commanding 35% category share. We<br />
plan to dive in to even bigger growth<br />
through multibranding, which will make<br />
us a true national powerhouse.<br />
We drove our U.S. company same-store sales growth 3% in 2003<br />
and will be the key multibrand partner for the other <strong>Yum</strong>! brands<br />
going forward. In fact, Long John Silver’s will be the multibrand<br />
partner in about one half of the 500 multibrand additions which<br />
we expect will open in 2004. This “Fish First” strategy gives<br />
us a lot of new opportunities for future growth.<br />
In 2003, our Fish and Shrimp Treasure Chest Family Meal<br />
was a huge success, increasing sales<br />
of our family meals by 22%. We also<br />
set an all-time weekly sales record<br />
for the Lenten season — $17,000 per<br />
restaurant — the highest weekly sales<br />
in our brand’s history! And we made it<br />
easier to eat our shrimp on the go with<br />
our new Bucket of Crunchy Shrimp<br />
promotion. We’re proud of our heritage of offering signature<br />
batter-dipped products to millions of seafood lovers for nearly<br />
35 years. With multibranding, the Surf’s Up! to create shrimp<br />
and seafood excitement in the years ahead.<br />
A&W All American Food has been offering<br />
our signature frosty root beer floats, 100%<br />
pure beef hamburgers, French fries, onion<br />
rings and chili dogs for nearly 85 years.<br />
When you’re the longest-running quick service restaurant chain<br />
in the country, folks have lots of fond memories of A&W. Today,<br />
as a multibranding growth partner, we offer our delicious food<br />
as “Hometown American Favorites Made Fun.” We’re capitalizing<br />
on our nostalgia by inviting our customers to come in and<br />
ring our bell every time our teammates deliver on our Customer<br />
Mania Promise. And if you haven’t tasted one of our frosty root<br />
beer floats lately, drop by your hometown A&W to rediscover<br />
how sweet it can be!<br />
Steve Davis<br />
President and Chief Executive Offi cer, Long John Silver’s, Inc. and<br />
Chief Executive Offi cer, A&W Restaurants, Inc.<br />
21.
22.<br />
“po pow
1 + 1 = 3 <strong>Multibranding</strong> gives us the competitive<br />
advantage of branded variety. We want to be the<br />
best in the world at providing customers branded<br />
restaurant choice and convenience.<br />
er er” of<br />
choice<br />
<strong>Multibranding</strong>, combining one or<br />
more brands in the same restaurant,<br />
is the biggest innovation in the<br />
Quick Service Restaurant industry<br />
since the advent of the drive-thru<br />
window. And our customers told us loud<br />
and clear that we can break away from the<br />
pack by offering two of our great brands in<br />
the same restaurant.<br />
Since opening our first multibrand restaurant in<br />
1992, this successful concept has now grown to<br />
more than 2,100 multibrand units in the U.S. today, or<br />
12% of the system, accounting for almost 14% of our profits<br />
with higher average unit volumes and higher cash flows than standalone<br />
units. To show you how serious we are about this concept, we and<br />
our franchisees plan to build, convert or rebuild another 500 restaurants in<br />
2004 with the potential for over 10,000 stores in the years to come.<br />
One reason for the strong growth potential is that this concept enables us to build in trade areas<br />
that could not support just a single brand. And, when you add a new concept to an existing restaurant,<br />
operators get increased sales from the new concepts while strengthening the base business too. That’s why our multibrand<br />
company stores are generating between $1.2 to $1.3 million in average unit volumes. In 2003, multibranding was responsible<br />
for $185 million in profit and fees and we expect to double that — to $400 million — by 2006. So as you can see, when we<br />
give our customers more branded choice and convenience, they come back to the great taste of <strong>Yum</strong>! more often!<br />
23.
customer<br />
mania<br />
“<br />
pow<br />
w
er”
26.<br />
Speed<br />
Cleanliness<br />
We think we have the<br />
most talented Customer Maniacs<br />
in the industry. Meet some of them!<br />
Top, left to right: Van Hang, Ramona Macias<br />
Middle: Roxie Padot, Jeff Stricklin,<br />
Brenda Lederer Bottom: Mitch McCulloch<br />
Product Quality<br />
Maintenance<br />
Accuracy<br />
Hospitality
Our formula for success is simple: put people capability<br />
first. When we do that, we’ll satisfy our customers<br />
better than anyone and generate more profits.<br />
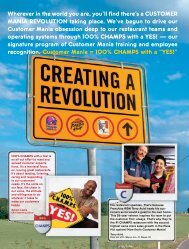
Around the globe, Building People Capability means we’re driving our Customer Mania culture deep<br />
to our restaurant teams and operating systems through 100% CHAMPS with a Yes! — our signature<br />
program of Customer Mania training and employee recognition. Everything we do — from hiring<br />
and training, to developing and retaining our leaders — is done with one purpose in mind: be the<br />
best at satisfying our customers better than anyone else. On these two pages, please meet some<br />
of the very best Customer Maniacs in the world!<br />
Cleanliness Sparkle. That’s what Roxie Padot’s restaurant does. With 28 perfect 100% CHAMPS<br />
scores in a row, this 22-year veteran knows how to run great restaurants. During her career that<br />
started as a cashier, Roxie has developed a real Customer Mania focus for keeping her customers<br />
happy and her store clean. She drives that home to her team with three-times-a-day CHAMPS<br />
Alert checks. She agrees with the Colonel, “If you have time to lean, you have time to clean.”<br />
Roxie Padot, Restaurant General Manager, KFC, AJS Associates franchisee<br />
Hospitality “Come on in, we’re family here.” It’s easy to see RGM Brenda Lederer’s approach to<br />
her customers and team when they’re in her restaurant. This 16-year veteran sees the people in her<br />
restaurant as more than an order — they are her friends. With a near perfect score on her CHAMPS<br />
review and a 4% same-store sales increase in 2003, you can tell that this Customer Maniac loves<br />
being in her restaurant. Brenda Lederer, Restaurant General Manager, A&W All American Food,<br />
Larry Blakley franchisee<br />
Accuracy “Accuracy is a team effort,” says RGM Ramona Macias. “Everyone has to get it right.”<br />
That’s why Ramona uses her Customer Mania training to keep her team focused on their individual<br />
roles in satisfying customers. She rewards team members with lots of praise and everyone in her<br />
restaurant — from cooks to cashiers — is cross-trained so they can fill a void at a moment’s notice.<br />
With an overall CHAMPS score of 99% and sales up nearly 6% in 2003, you can see it’s a true team<br />
effort. Ramona Macias, Restaurant General Manager, Long John Silver’s<br />
Maintenance RGM Mitch McCulloch knows that well- maintained equipment means delicious<br />
pizzas every time. And to prove it, Mitch and his team have been driving strong, double-digit sales<br />
growth in 2003. He says the perfect scores his restaurant repeatedly earns on Maintenance are<br />
a direct result of keeping everybody in the restaurant involved. Mitch posts a checklist that monitors<br />
not just the food supply but also keeps track of the equipment. That’s how he and his team<br />
repeatedly put smiles on their customers’ faces! Mitch McCulloch, Restaurant General Manager,<br />
Pizza Hut, High Plains Pizza franchisee<br />
Product Quality “<strong>Yum</strong>!” RGM Jeff Stricklin’s customers say that again and again. It must be why<br />
Jeff’s same-store sales were up an incredible 20% in 2003. He and his Taco Bell team recorded<br />
16 perfect consecutive 100% CHAMPS scores in a row — and he’s still going! That’s over a year of<br />
satisfying customers with delicious food in a great environment. In just two short years, Jeff has<br />
turned his Taco Bell into one of the top performers in the country. How did he do it? By driving a<br />
passionate Customer Mania culture and placing a strong emphasis on delicious product — every<br />
time! Jeff Stricklin, Restaurant General Manager, Taco Bell<br />
Speed Don’t blink. Because RGM Van Hang makes things happen in his restaurant — fast.<br />
Among the top 2% of all Pizza Hut operators, Van closed out 2003 with same-store sales up 4%<br />
and an overall CHAMPS score of 93%. Van’s restaurant can be a very busy place, and he credits<br />
the intensity of his team — many who’ve been there for 10–14 years — in keeping things running<br />
smooth and fast. Now, there are some dedicated Customer Maniacs! Van Hang, Restaurant General<br />
Manager, Pizza Hut<br />
Anne Byerlein<br />
Chief People Offi cer<br />
<strong>Yum</strong>! Brands, Inc.<br />
27.
28.<br />
Running Great Restaurants<br />
Aylwin B. Lewis<br />
President, Chief <strong>Multibranding</strong><br />
and Operating Officer<br />
<strong>Yum</strong>! Brands, Inc.<br />
100% CHAMPS with a Yes! and<br />
Same-Store Sales Growth in Every Store<br />
At <strong>Yum</strong>! Brands we’re building an operating culture of 840,000 Customer Maniacs with<br />
one purpose: satisfying our customers better than any other restaurant company. The<br />
true power of Running Great Restaurants is in giving a trusted customer experience — each<br />
and every time. To do that, we must live and breathe 100% CHAMPS with a Yes! attitude.<br />
When you are a customer in our restaurants, we want you to receive every letter of<br />
CHAMPS: Cleanliness, Hospitality, Accuracy, Maintenance, Product Quality and Speed.<br />
If we miss one of the letters, your service isn’t as good as it should be.<br />
This is the beginning of our fourth year of utilizing our operational framework, and we<br />
are beginning our third year of customer and sales mania training each quarter in every<br />
restaurant. Our Chief Operating Officers are fully vested in driving our operational culture<br />
deep into each of our companies. We recognize that it is our daily leadership intentions<br />
around the basics that will allow us to achieve the Run Great Restaurant vision.<br />
I’m proud of the progress we made in 2003: Our CHAMPS scores are increasing and our<br />
customer complaints are down. Our external measures are beginning to improve and it<br />
also shows in our people. Our turnover rates are among the lowest in the industry and<br />
we are more confident than ever that a stable environment is so important to continue<br />
to drive our Run Great Restaurant mission around the globe.<br />
While we still have work to do to fulfill our vision of being the best restaurant operators<br />
in the industry, our path to greatness is very clear. Hire, train and promote only<br />
Customer Maniacs. Execute the basics with passion and urgency. Lead and coach each<br />
restaurant in a one-system fashion as if it were our only one. We know that when we<br />
execute 100% CHAMPS with a Yes! attitude, our people become an unstoppable force<br />
for growing the business<br />
Aylwin B. Lewis<br />
President, Chief <strong>Multibranding</strong> and Operating Officer<br />
<strong>Yum</strong>! Brands, Inc.<br />
Customer Mania means delivering<br />
100% CHAMPS with a Yes! attitude<br />
every day. It’s the smile on our face<br />
and the smile in our voice. It’s putting<br />
the customer fi rst in everything we do.<br />
When we do that, our people become<br />
an unstoppable force for growing the<br />
business.
<strong>Yum</strong>! At-a-glance<br />
Source: Crest<br />
®<br />
U.S. Sales by Daypart U.S. Sales by Distribution Channel<br />
Dinner 59% Lunch 34% Dine Out 80%<br />
Snacks/Breakfast 7% Dine In 20%<br />
Dinner 64% Lunch 27% Dine Out 72%<br />
Snacks/Breakfast 9% Dine In 28%<br />
Dinner 43% Lunch 45% Dine Out 73%<br />
Snacks/Breakfast 12% Dine In 27%<br />
Dinner 54% Lunch 40% Dine Out 58%<br />
Snacks/Breakfast 6% Dine In 42%<br />
Dinner 27% Lunch 49% Dine Out 43%<br />
Snacks/Breakfast 24% Dine In 57%<br />
29.
30.<br />
Global Facts<br />
Worldwide Sales<br />
(in billions) 5-year<br />
2003 2002 2001 2000 1999 growth (a)<br />
United States<br />
KFC Company sales $ 1.4 $ 1.4 $ 1.4 $ 1.4 $ 1.5 (3%)<br />
Franchisee sales (b) 3.5 3.4 3.3 3.0 2.8 7%<br />
Pizza Hut Company sales $ 1.6 $ 1.5 $ 1.5 $ 1.8 $ 2.1 (8%)<br />
Franchisee sales (b) 3.5 3.6 3.5 3.2 2.9 8%<br />
Taco Bell Company sales $ 1.6 $ 1.6 $ 1.4 $ 1.4 $ 1.6 (5%)<br />
Franchisee sales (b) 3.8 3.6 3.5 3.7 3.6 4%<br />
Long John Silver’s (c) Company sales $ 0.5 $ 0.3 NM<br />
Franchisee sales (b) 0.3 0.2 NM<br />
A&W (c) Company sales $ — $ — NM<br />
Franchisee sales (b) 0.2 0.2 NM<br />
Total U.S. Company sales $ 5.1 $ 4.8 $ 4.3 $ 4.6 $ 5.2 (5%)<br />
Franchisee sales (b) 11.3 11.0 10.3 9.9 9.3 6%<br />
International<br />
KFC Company sales $ 1.7 $ 1.5 $ 1.2 $ 1.1 $ 1.1 8%<br />
Franchisee sales (b) 4.6 3.9 3.8 3.9 3.5 10%<br />
Pizza Hut Company sales $ 0.6 $ 0.6 $ 0.6 $ 0.6 $ 0.7 (1%)<br />
Franchisee sales (b) 2.4 2.2 2.0 2.0 1.9 6%<br />
Taco Bell Company sales $ — $ — $ — $ — $ — NM<br />
Franchisee sales (b) 0.1 0.2 0.1 0.1 0.1 3%<br />
Long John Silver’s (c) Company sales $ — $ — NM<br />
Franchisee sales (b) — — NM<br />
A&W (c) Company sales $ — $ — NM<br />
Franchisee sales (b) 0.1 — NM<br />
Total International Company sales $ 2.3 $ 2.1 $ 1.8 $ 1.7 $ 1.8 5%<br />
Franchisee sales (b) 7.2 6.3 5.9 6.0 5.5 8%<br />
Worldwide<br />
International System Sales (a)<br />
by Key Market<br />
Year ended 2003<br />
Company sales $ 7.4 $ 6.9 $ 6.1 $ 6.3 $ 7.0 (3%)<br />
Franchisee sales (b) 18.5 17.3 16.2 15.9 14.8 7%<br />
(a) Compounded annual growth rate; totals for U.S., International and Worldwide exclude the impact of Long John Silver’s and A&W.<br />
(b) Franchisee sales represents the combined estimated sales of unconsolidated affiliate and franchise and license restaurants. Franchisee sales, which are not included in our<br />
Company sales, generate franchise and license fees (typically at rates between 4% and 6%) that are included in our revenues.<br />
(c) Beginning May 7, 2002, includes Long John Silver’s and A&W, which were added when we acquired Yorkshire Global Restaurants, Inc.<br />
China has achieved<br />
double-digit system sales<br />
growth for the<br />
fifth consecutive year.<br />
China 12%<br />
Franchise Markets (b) 28%<br />
Japan/Canada 20%<br />
U.K. 15%<br />
Australia/New Zealand 9%<br />
South Korea 4%<br />
Other 7%<br />
Mexico 3%<br />
Future Growth Markets (c) 2%<br />
International Operating Profit by Key Market<br />
Year ended 2003 (in millions)<br />
China $ 157<br />
Franchise Markets (b) 109<br />
Japan/Canada 60<br />
U.K. 97<br />
Australia/New Zealand 44<br />
South Korea 33<br />
Other 21<br />
Mexico 10<br />
Future Growth Markets (c) (30)<br />
Headquarters General & Administrative Costs (60)<br />
$ 441<br />
(a) System sales represents the combined sales of Company, unconsolidated affiliates, franchise and license restaurants.<br />
(b) Includes franchise-only markets in the remainder of Asia, Continental Europe, Carribean/Latin America, Middle East/<br />
Southern Africa.<br />
(c) Includes KFC Germany, KFC Netherlands, KFC France, KFC Brazil and India.
Unit Information<br />
Worldwide System Units<br />
Year-end 2003 2002 %B(W) change<br />
Company 7,854 7,526 4<br />
Unconsolidated affl iates 1,512 2,148 (30)<br />
Franchisees 21,471 20,724 4<br />
Licensees 2,362 2,526 (6)<br />
Total 33,199 32,924 1<br />
5-year.<br />
Year-end 2003 2002 2001 2000 1999 growth .(a)(b)<br />
United States<br />
KFC 5,524 5,472 5,399 5,364 5,231 2<br />
Pizza Hut 7,523 7,599 7,719 7,927 8,084 (2)<br />
Taco Bell 5,989 6,165 6,444 6,746 6,879 (3)<br />
Long John Silver’s 1,204 1,221 NM<br />
A&W 576 665 NM<br />
Total U.S. (c) 20,822 21,126 19,562 20,037 20,194 (1)<br />
International<br />
KFC 7,354 6,890 6,416 5,974 5,595 7<br />
Pizza Hut 4,560 4,431 4,272 4,157 3,961 3<br />
Taco Bell 249 267 239 249 232 2<br />
Long John Silver’s 31 28 NM<br />
A&W 183 182 NM<br />
Total International 12,377 11,798 10,927 10,380 9,788 5<br />
Total (c) 33,199 32,924 30,489 30,417 29,982 1<br />
(a) Compounded annual growth rate; total U.S., International and Worldwide exclude the impact of Long John Silver’s and A&W.<br />
(b) Compounded annual growth rate excludes the impact of transferring 30 units from Taco Bell U.S. to Taco Bell International in 2002.<br />
(c) Includes 6 and 4 Yan Can units in 2003 and 2002, respectively.<br />
Breakdown of Worldwide System Units<br />
Unconsolidated<br />
Year-end 2003 Company Affiliate Franchised Licensed Total<br />
United States<br />
KFC 1,252 — 4,204 68 5,524<br />
Pizza Hut 1,776 — 4,624 1,123 7,523<br />
Taco Bell 1,284 — 3,743 962 5,989<br />
Long John Silver’s 701 — 502 1 1,204<br />
A&W 81 — 493 2 576<br />
Total U.S. (a) 5,094 6 13,566 2,156 20,822<br />
International<br />
KFC 1,685 773 4,835 61 7,354<br />
Pizza Hut 1,021 733 2,708 98 4,560<br />
Taco Bell 54 — 150 45 249<br />
Long John Silver’s — — 30 1 31<br />
A&W — — 182 1 183<br />
Total International 2,760 1,506 7,905 206 12,377<br />
Total 7,854 1,512 21,471 2,362 33,199<br />
(a) Includes 6 Yan Can units.<br />
Worldwide Units<br />
Year-end 2003 (in thousands)<br />
<strong>Yum</strong>! Brands<br />
McDonald’s<br />
Subway<br />
Burger King<br />
Wendy’s<br />
Domino’s Pizza<br />
Dairy Queen<br />
7<br />
6<br />
9<br />
11<br />
21<br />
33<br />
31<br />
31.
32.<br />
Financial Highlights<br />
(In millions, millions, except per share amounts)<br />
Year-end 2003<br />
2003 2002<br />
2002 % B(W) change<br />
Company sales $ $ 7,441<br />
7,441 $ $ 6,891<br />
6,891 8<br />
Franchise and and license license fees<br />
fees 939<br />
939 866<br />
866 9<br />
Total revenues $ 8,380 $ 7,757 8<br />
Operating profit $ 1,059 $ 1,030 3<br />
Earnings before before special special items<br />
items $ 628 $ 566 11<br />
Special items, items, net of tax (11) 17<br />
17 NM<br />
Net income $ 617 $ 583 6<br />
Wrench litigation $ (42) $ $ — — NM<br />
NM<br />
AmeriServe and and other other (charges) (charges) credits<br />
credits 26 27<br />
27 NM<br />
Cumulative effect of accounting change (2) —<br />
— NM<br />
Special items<br />
items (18) 27<br />
27 NM<br />
Income tax on special items 7 (10)<br />
(10) NM<br />
Special items, items, net of tax $ (11) $ $ 17 17 NM<br />
NM<br />
Diluted earnings per per common common share:<br />
share:<br />
Earnings before before special special items<br />
items $ 2.06 $ $ 1.82 1.82 13<br />
13<br />
Special items, items, net of tax (0.04) 0.06 NM<br />
Reported $ 2.02 $ $ 1.88 1.88 7<br />
7<br />
Cash flows provided by operating activities $ 1,053 $ 1,088 (3)<br />
Average U.S. Sales per System Unit (a)<br />
(In thousands)<br />
thousands)<br />
Year-end 2003 2002 2001 2000 1999 5-year 5-year growth<br />
growth (b)<br />
KFC $ $898 $ 898 $ $898 898 $865 $ 865 $833 $ 833 $ $837 837 2%<br />
Pizza Hut 748 748 748 724 724 712 712<br />
696 3%<br />
Taco Bell 1,005 964 964 890 890 896 896<br />
918 2%<br />
(a) Excludes license units.<br />
(b) Compounded annual growth rate.<br />
It’s amazing when you think about it. In just seven short years<br />
since our founding, we lowered our overall debt to $2.1 billion<br />
by the end of 2003. That’s down from the $4.7 billion worth<br />
of debt we started out with in the fall of 1997. Meanwhile,<br />
we have significantly grown our cash flow and realized high<br />
returns on invested capital thanks mainly to the strong<br />
performance of our international business. In fact, we’ve<br />
moved from having one of the lowest returns on invested<br />
capital — 8% — in 1997, to having today one of the highest<br />
returns in the quick service restaurant industry — 18%.<br />
How did we do it? As you’ve read in this Report, we have<br />
established a global operating culture with the platforms<br />
and systems in place to execute our base business better<br />
and better. And our focus on daily leadership around these<br />
tools is paying off. Our metrics are improving: We’re driving<br />
restaurant margins and same-store sales growth. In addition,<br />
we continue to focus on new franchise development without<br />
having to invest any of our own capital. We receive nearly<br />
“power power”<br />
of<br />
$1 billion a year in franchise fees. We also continue to focus<br />
on our high-return international expansion. Domestically, we<br />
are the multibranding leader and with our “Fish First” multibranding<br />
strategy, we are leveraging our Long John Silver’s<br />
brand to create greater national scale — nearly tripling our<br />
multibranding opportunities. We will also continue to improve<br />
our capital spending effectiveness around the globe, paying<br />
attention to where we spend our money, how we spend it, and<br />
what the returns look like. All in all, we are spending smarter<br />
and making sure that with each decision,<br />
we’re acting wisely on behalf of<br />
our shareholders.<br />
Dave Deno, Chief Financial Offi cer<br />
<strong>Yum</strong>! Brands, Inc.<br />
results
Management’s Discussion and Analysis of Financial Condition<br />
and Results of Operations<br />
INTRODUCTION AND OVERVIEW<br />
YUM! Brands, Inc. and Subsidiaries (collectively referred<br />
to as “YUM” or the “Company”) comprises the worldwide<br />
operations of KFC, Pizza Hut, Taco Bell, Long John Silver’s<br />
(“LJS”) and A&W All-American Food Restaurants (“A&W”)<br />
(collectively “the Concepts”) and is the world’s largest<br />
quick service restaurant (“QSR”) company based on the<br />
number of system units. LJS and A&W were added when<br />
YUM acquired Yorkshire Global Restaurants, Inc. (“YGR”)<br />
on May 7, 2002. With 12,377 international units, YUM is<br />
the second largest QSR company outside the U.S. YUM<br />
became an independent, publicly-owned company on<br />
October 6, 1997 (the “Spin-off Date”) via a tax-free distribution<br />
of our Common Stock (the “Distribution” or “Spin-off”)<br />
to the shareholders of our former parent, PepsiCo, Inc.<br />
(“PepsiCo”).<br />
Through its Concepts, YUM develops, operates,<br />
franchises and licenses a system of both traditional and<br />
non-traditional QSR restaurants. Traditional units feature<br />
dine-in, carryout and, in some instances, drive-thru or<br />
delivery services. Non-traditional units, which are typically<br />
licensed outlets, include express units and kiosks which<br />
have a more limited menu and operate in non-traditional<br />
locations like malls, airports, gasoline service stations,<br />
convenience stores, stadiums, amusement parks and<br />
colleges, where a full-scale traditional outlet would not be<br />
practical or efficient.<br />
The retail food industry, in which the Company<br />
competes, is made up of supermarkets, supercenters,<br />
warehouse stores, convenience stores, coffee shops,<br />
snack bars, delicatessens and restaurants (including the<br />
QSR segment), and is intensely competitive with respect<br />
to food quality, price, service, convenience, location and<br />
concept. The industry is often affected by changes in<br />
consumer tastes; national, regional or local economic conditions;<br />
currency fluctuations; demographic trends; traffic<br />
patterns; the type, number and location of competing food<br />
retailers and products; and disposable purchasing power.<br />
Each of the Concepts competes with international, national<br />
and regional restaurant chains as well as locally-owned<br />
restaurants, not only for customers, but also for management<br />
and hourly personnel, suitable real estate sites and<br />
qualified franchisees.<br />
The Company is focused on five long-term measures<br />
identified as essential to our growth and progress. These<br />
five measures and related key performance indicators are<br />
as follows:<br />
International expansion<br />
International system-sales growth (local currency)<br />
Number of new international restaurant openings<br />
Net international unit growth<br />
Multibrand innovation and expansion<br />
Number of multibrand restaurant locations<br />
Number of multibrand units added<br />
Number of franchise multibrand units added<br />
<strong>Yum</strong>! Brands Inc. 33.<br />
Portfolio of category-leading U.S. brands<br />
U.S. blended same-store sales growth<br />
U.S. system-sales growth<br />
Global franchise fees<br />
New restaurant openings by franchisees<br />
Franchise fee growth<br />
Strong cash generation and returns<br />
Cash generated from all sources<br />
Cash generated from all sources after capital<br />
spending<br />
Restaurant margins<br />
Our progress against these measures is discussed<br />
throughout the Management’s Discussion and Analysis<br />
(“MD&A”).<br />
All references to per share and share amounts in the<br />
following MD&A have been adjusted to reflect the two-forone<br />
stock split distributed on June 17, 2002.<br />
This MD&A should be read in conjunction with<br />
our Consolidated Financial Statements on pages 48<br />
through 51 and the Cautionary Statements on page 47. All<br />
Note references herein refer to the Notes to the Consolidated<br />
Financial Statements on pages 52 through 74. Tabular<br />
amounts are displayed in millions except per share and unit<br />
count amounts, or as otherwise specifically identified.<br />
FACTORS AFFECTING COMPARABILITY OF 2003 RESULTS TO<br />
2002 RESULTS AND 2002 RESULTS TO 2001 RESULTS<br />
YGR Acquisition<br />
On May 7, 2002, the Company completed its acquisition of<br />
YGR, the parent company of LJS and A&W. See Note 4 for<br />
a discussion of the acquisition.<br />
As of the date of the acquisition, YGR consisted of 742<br />
and 496 company and franchise LJS units, respectively, and<br />
127 and 742 company and franchise A&W units, respectively.<br />
In addition, 133 multibranded LJS/A&W restaurants<br />
were included in the LJS unit totals. Except as discussed in<br />
certain sections of the MD&A, the impact of the acquisition<br />
on our results of operations in 2003 and 2002 was not<br />
significant relative to the comparable prior year period.<br />
Amendment of Sale-Leaseback Agreements<br />
As discussed in Note 14, on August 15, 2003 we amended<br />
two sale-leaseback agreements assumed in our 2002<br />
acquisition of YGR such that the agreements now qualify<br />
for sale-leaseback accounting. There was no gain or loss<br />
recorded as a result of this transaction; however, restaurant<br />
margins decreased by approximately $3 million for<br />
the year ended December 27, 2003 as a result of the two<br />
amended agreements being accounted for as operating<br />
leases subsequent to the amendment. The decrease in<br />
restaurant margin was largely offset by a similar decrease<br />
in interest expense.
34.<br />
Wrench Litigation<br />
We recorded expense of $42 million in 2003. See Note 24<br />
for a discussion of the Wrench litigation.<br />
AmeriServe and Other Charges (Credits)<br />
We recorded income of $26 million in 2003, $27 million<br />
in 2002 and $3 million in 2001. See Note 7 for a detailed<br />
discussion of AmeriServe and other charges (credits).<br />
Store Portfolio Strategy<br />
From time to time we sell Company restaurants to existing<br />
and new franchisees where geographic synergies can be<br />
obtained or where their expertise can generally be leveraged<br />
to improve our overall operating performance, while<br />
retaining Company ownership of key U.S. and International<br />
markets. Such refranchisings reduce our reported Company<br />
sales and restaurant profits while increasing our franchise<br />
fees. Proceeds from refranchising increase the level of cash<br />
available to fund discretionary spending.<br />
The following table summarizes our refranchising<br />
activities:<br />
2003 2002 2001<br />
Number of units refranchised 228 174 233<br />
Refranchising proceeds, pre-tax $ 92 $ 81 $ 111<br />
Refranchising net gains, pre-tax (a) $ 4 $ 19 $ 39<br />
(a) 2003 includes charges of approximately $16 million to write down the carrying<br />
value of our Puerto Rican business to reflect the then current estimates<br />
of its fair value. The charges were recorded as a refranchising loss. 2001<br />
includes $12 million of previously deferred refranchising gains and a charge of<br />
$11 million to mark to market the net assets of our Singapore business, which<br />
was sold during 2002 at a price approximately equal to its carrying value.<br />
In addition to our refranchising program, from time to time<br />
we close restaurants that are poor performing, we relocate<br />
restaurants to a new site within the same trade area or we<br />
consolidate two or more of our existing units into a single<br />
unit (collectively “store closures”).<br />
The following table summarizes Company store closure<br />
activities:<br />
2003 2002 2001<br />
Number of units closed 287 224 270<br />
Store closure costs<br />
Impairment charges for stores<br />
$ 6 $ 15 $ 17<br />
to be closed $ 12 $ 9 $ 5<br />
The impact on operating profit arising from our refranchising<br />
and Company store closures is the net of (a) the estimated<br />
reduction in restaurant profit, which reflects the decrease in<br />
Company sales, and general and administrative expenses<br />
and (b) the estimated increase in franchise fees from the<br />
stores refranchised. The amounts presented below reflect<br />
the estimated impact from stores that were operated by<br />
us for all or some portion of the respective previous year<br />
and were no longer operated by us as of the last day of<br />
the respective year. The amounts do not include results<br />
from new restaurants that we open in connection with a<br />
relocation of an existing unit or any incremental impact<br />
upon consolidation of two or more of our existing units<br />
into a single unit.<br />
The following table summarizes the estimated impact<br />
on revenue of refranchising and Company store closures:<br />
U.S.<br />
2003<br />
International<br />
Worldwide<br />
Decreased sales $ (148) $ (120) $ (268)<br />
Increased franchise fees 1 5 6<br />
Decrease in total revenues $ (147) $ (115) $ (262)<br />
U.S.<br />
2002<br />
International<br />
Worldwide<br />
Decreased sales $ (214) $ (90) $ (304)<br />
Increased franchise fees 4 4 8<br />
Decrease in total revenues $ (210) $ (86) $ (296)<br />
The following table summarizes the estimated impact<br />
on operating profit of refranchising and Company store<br />
closures:<br />
2003<br />
U.S.<br />
International<br />
Worldwide<br />
Decreased restaurant profit $ (18) $ (15) $ (33)<br />
Increased franchise fees<br />
Decreased general and<br />
1 5 6<br />
administrative expenses — 6 6<br />
Decrease in operating profit $ (17) $ (4) $ (21)<br />
U.S.<br />
2002<br />
International<br />
Worldwide<br />
Decreased restaurant profit $ (23) $ (5) $ (28)<br />
Increased franchise fees<br />
Decreased general and<br />
4 4 8<br />
administrative expenses<br />
(Decrease) increase in<br />
1 2 3<br />
operating profit $ (18) $ 1 $ (17)<br />
Impact of Recently Adopted Accounting Pronouncement<br />
Effective December 30, 2001, the Company adopted<br />
Statement of Financial Accounting Standards (“SFAS”)<br />
No. 142, “Goodwill and Other Intangible Assets” (“SFAS<br />
142”), in its entirety. In accordance with the requirements<br />
of SFAS 142, we ceased amortization of goodwill and<br />
indefinite-lived intangibles as of December 30, 2001. The<br />
following table summarizes the favorable effect of SFAS<br />
142 on restaurant profit, restaurant margin and operating<br />
profit had SFAS 142 been effective in 2001.<br />
Year Ended December 29, 2001<br />
Inter-<br />
U.S. national Worldwide<br />
Restaurant profit $ 21 $ 11 $ 32<br />
Restaurant margin (%) 0.5 0.6 0.5<br />
Operating profit $ 22 $ 16 $ 38
Additionally, if SFAS 142 had been effective in 2001,<br />
reported net income would have increased approximately<br />
$26 million and diluted earnings per common share (“EPS”)<br />
would have increased $0.09.<br />
SFAS 142 requires that goodwill and indefinite-lived<br />
intangibles be evaluated for impairment on an annual basis<br />
or as impairment indicators exist. In accordance with this<br />
requirement, we recognized impairment of approximately<br />
$5 million in both 2003 and 2002.<br />
WORLDWIDE RESULTS OF OPERATIONS<br />
% B/(W) % B/(W)<br />
vs. vs.<br />
2003 2002 2002 2001<br />
Revenues<br />
Company sales $ 7,441 8 $ 6,891 12<br />
Franchise and license fees 939 9 866 6<br />
Total revenues $ 8,380 8 $ 7,757 12<br />
Company restaurant margin $ 1,104 — $ 1,101 22<br />
% of Company sales 14.8% (1.2) ppts. 16.0% 1.2 )ppts.<br />
Operating profit 1,059 3 1,030 16<br />
Interest expense, net 173 (1) 172 (8)<br />
Income tax provision<br />
Income before cumulative<br />
268 3 275 (15)<br />
effect of accounting change<br />
Cumulative effect of accounting<br />
618 6 583 18<br />
change, net of tax (1) NM — —<br />
Net income $ 617 6 $ 583 18<br />
Diluted earnings per share (a) $ 2.02 7 $ 1.88 16<br />
(a) See Note 6 for the number of shares used in this calculation. See Note 12 for a<br />
discussion of the proforma impact of SFAS 142 on EPS in 2001.<br />
WORLDWIDE RESTAURANT UNIT ACTIVITY<br />
<strong>Yum</strong>! Brands Inc. 35.<br />
Worldwide Multibrand Restaurants Company Franchise Total<br />
Balance at Dec. 28, 2002 888 1,087 1,975<br />
Balance at Dec. 27, 2003 1,096 1,249 2,345<br />
The franchise unit counts include both franchisee and<br />
unconsolidated affiliate multibrand units. Multibrand conversions<br />
increase the sales and points of distribution for the<br />
second brand added to a restaurant but do not result in an<br />
additional unit count. Similarly, a new multibrand restaurant,<br />
while increasing sales and points of distribution for two<br />
brands, results in just one additional unit count.<br />
For 2003 and 2002, Company multibrand unit gross<br />
additions were 235 and 216, respectively. For 2003 and<br />
2002, franchise multibrand unit gross additions were 194<br />
and 166, respectively.<br />
WORLDWIDE SYSTEM SALES GROWTH<br />
System Sales Growth 2003 2002<br />
Worldwide 7% 8%<br />
System sales growth includes the results of all restaurants<br />
regardless of ownership, including company-owned, franchise,<br />
unconsolidated affiliate and license restaurants.<br />
Sales of franchise, unconsolidated affiliate and license<br />
restaurants generate franchise and license fees for the<br />
company (typically at a rate of 4% to 6% of sales). Franchise,<br />
unconsolidated affiliate and license restaurants sales<br />
are not included in company sales on the Consolidated<br />
Statements of Income; however, the fees are included in<br />
the Company’s revenues. We believe system sales growth<br />
Company<br />
Unconsolidated<br />
Affiliates Franchisees Licensees Total<br />
Balance at Dec. 29, 2001 6,435 2,000 19,263 2,791 30,489<br />
New Builds 585 165 748 146 1,644<br />
Acquisitions (a) 905 41 1,164 (3) 2,107<br />
Refranchising (174) (14) 188 — —<br />
Closures (224) (46) (649) (409) (1,328)<br />
Other (1) 2 10 1 12<br />
Balance at Dec. 28, 2002 7,526 2,148 20,724 2,526 32,924<br />
New Builds 454 176 868 272 1,770<br />
Acquisitions 389 (736) 345 2 —<br />
Refranchising (228) (1) 227 2 —<br />
Closures (287) (75) (691) (388) (1,441)<br />
Other — — (2) (52) (54)<br />
Balance at Dec. 27, 2003 7,854 1,512 21,471 2,362 33,199<br />
% of Total 24% 4% 65% 7% 100%<br />
(a) Includes units that existed at the date of the acquisition of YGR on May 7, 2002.
36.<br />
is useful to investors as a significant indicator of the<br />
overall strength of our business as it incorporates all of<br />
our revenue drivers, company and franchise same store<br />
sales as well as net unit development.<br />
System sales increased 7% for 2003, after a 2% favorable<br />
impact from foreign currency translation. Excluding<br />
the favorable impact of both foreign currency translation<br />
and the YGR acquisition, system sales increased 3%. The<br />
increase was driven by new unit development, partially<br />
offset by store closures.<br />
System sales increased 8% in 2002. The impact from<br />
foreign currency translation was not significant. Excluding<br />
the favorable impact of the YGR acquisition, system sales<br />
increased 5%. The increase resulted from new unit development<br />
and same store sales growth, partially offset by<br />
store closures.<br />
WORLDWIDE REVENUES<br />
Company sales increased $550 million or 8% in 2003, after<br />
a 1% favorable impact from foreign currency translation.<br />
Excluding the favorable impact of both foreign currency<br />
translation and the YGR acquisition, Company sales<br />
increased 4%. The increase was driven by new unit development,<br />
partially offset by store closures and refranchising.<br />
Franchise and license fees increased $73 million<br />
or 9% in 2003, after a 3% favorable impact from foreign<br />
currency translation. Excluding the impact of foreign<br />
currency translation and the favorable impact of the YGR<br />
acquisition, franchise and license fees increased 5%. The<br />
increase was driven by new unit development, royalty rate<br />
increases and same store sales growth, partially offset by<br />
store closures.<br />
Company sales increased $753 million or 12% in<br />
2002. The impact from foreign currency translation was<br />
not significant. Excluding the favorable impact of the YGR<br />
acquisition, Company sales increased 6%. The increase<br />
was driven by new unit development and same store sales<br />
growth. The increase was partially offset by refranchising<br />
and store closures.<br />
Franchise and license fees increased $51 million or 6%<br />
in 2002. The impact from foreign currency translation was<br />
not significant. Excluding the favorable impact of the YGR<br />
acquisition, franchise and license fees increased 4%. The<br />
increase was driven by new unit development and same<br />
store sales growth, partially offset by store closures.<br />
WORLDWIDE COMPANY RESTAURANT MARGIN<br />
2003 2002 2001<br />
Company sales 100.0% 100.0% 100.0%<br />
Food and paper 30.9 30.6 31.1<br />
Payroll and employee benefits<br />
Occupancy and other<br />
27.2 27.2 27.1<br />
operating expenses 27.1 26.2 27.0<br />
Company restaurant margin 14.8% 16.0% 14.8%<br />
Restaurant margin as a percentage of sales decreased<br />
approximately 120 basis points in 2003. U.S. restaurant<br />
margin decreased approximately 140 basis points and<br />
International restaurant margin decreased approximately<br />
50 basis points.<br />
Restaurant margin as a percentage of sales increased<br />
approximately 120 basis points in 2002. The increase<br />
included the favorable impact of approximately 50 basis<br />
points from the adoption of SFAS 142, partially offset by<br />
the unfavorable impact of approximately 15 basis points<br />
from the YGR acquisition. U.S. restaurant margin increased<br />
approximately 80 basis points and International restaurant<br />
margin increased approximately 210 basis points.<br />
The changes in U.S. and International restaurant<br />
margin for 2003 and 2002 are discussed in the respective<br />
sections.<br />
WORLDWIDE GENERAL AND ADMINISTRATIVE EXPENSES<br />
General and administrative expenses increased $32 million<br />
or 3% in 2003, including a 1% unfavorable impact from<br />
foreign currency translation. Excluding the unfavorable<br />
impact from both foreign currency translation and the YGR<br />
acquisition, general and administrative expenses were flat<br />
year to date. Lower management incentive compensation<br />
costs were offset by increases in expenses associated with<br />
international restaurant expansion and pension expense.<br />
General and administrative expenses increased<br />
$117 million or 15% in 2002. Excluding the unfavorable<br />
impact of the YGR acquisition, general and administrative<br />
expenses increased 10%. The increase was driven by<br />
higher compensation-related costs and higher corporate<br />
and project spending.<br />
WORLDWIDE FRANCHISE AND LICENSE EXPENSES<br />
Franchise and license expenses decreased $21 million or<br />
42% in 2003. The decrease was primarily attributable to<br />
lower allowances for doubtful franchise and license fee<br />
receivables, primarily at Taco Bell.<br />
Franchise and license expenses decreased $10 million<br />
or 18% in 2002. The decrease was primarily attributable<br />
to lower allowances for doubtful franchise and license fee<br />
receivables and the favorable impact of lapping support<br />
costs related to the financial restructuring of certain<br />
Taco Bell franchisees in 2001. The decrease was partially<br />
offset by higher marketing support costs in certain international<br />
markets.<br />
WORLDWIDE OTHER (INCOME) EXPENSE<br />
2003<br />
Equity income from investments in<br />
2002 2001<br />
unconsolidated affiliates $ (39) $ (29) $ (26)<br />
Foreign exchange net (gain) loss (2) (1) 3<br />
Other (income) expense $ (41) $ (30) $ (23)
The increase in other (income) expense in 2003 was<br />
primarily driven by the improved operating performance of<br />
our unconsolidated affiliates, particularly in China.<br />
WORLDWIDE FACILITY ACTIONS<br />
We recorded a net loss from facility actions of $36 million,<br />
$32 million and $1 million in 2003, 2002 and 2001,<br />
respectively. See the Store Portfolio Strategy section for<br />
more detail of our refranchising and closure activities and<br />
Note 7 for a summary of the components of facility actions<br />
by reportable operating segment.<br />
WORLDWIDE OPERATING PROFIT<br />
% B/(W) % B/(W)<br />
vs. vs.<br />
2003 2002 2002 2001<br />
United States $ 812 1 $ 802 15<br />
International<br />
Unallocated and corporate<br />
441 22 361 19<br />
expenses<br />
Unallocated other income<br />
(179) — (178) (20)<br />
(expense) (3) NM (1) NM<br />
Unallocated facility actions gain 4 NM 19 NM<br />
Wrench litigation<br />
AmeriServe and other (charges)<br />
(42) NM — —<br />
credits 26 NM 27 NM<br />
Operating profit $ 1,059 3 $ 1,030 16<br />
The changes in U.S. and International operating profit for<br />
2003 and 2002 are discussed in the respective sections.<br />
Unallocated and corporate expenses increased<br />
$1 million in 2003 and $30 million or 20% in 2002. The<br />
2002 increase was primarily driven by higher compensationrelated<br />
costs and higher corporate and project spending.<br />
Unallocated facility actions comprises refranchising<br />
gains (losses) which are not allocated to the U.S. or<br />
International segments for performance reporting purposes.<br />
See Note 7 for further discussion.<br />
WORLDWIDE INTEREST EXPENSE, NET<br />
2003 2002 2001<br />
Interest expense $ 185 $ 180 $ 172<br />
Interest income (12) (8) (14)<br />
Interest expense, net $ 173 $ 172 $ 158<br />
Interest expense increased $5 million or 3% in 2003.<br />
Excluding the impact of the YGR acquisition, interest<br />
expense decreased 6%. The decrease was primarily due<br />
to a decrease in our average debt outstanding.<br />
Interest expense increased $8 million or 5% in 2002.<br />
Excluding the impact of the YGR acquisition, interest<br />
expense decreased 12%. The decrease was driven by<br />
a reduction in our average debt balance partially offset<br />
by an increase in our average interest rate. Our average<br />
interest rate increased due to a reduction in our variablerate<br />
borrowings using proceeds from the issuance of longer<br />
term, fixed-rate notes.<br />
WORLDWIDE INCOME TAXES<br />
<strong>Yum</strong>! Brands Inc. 37.<br />
2003 2002 2001<br />
Reported<br />
Income taxes $ 268 $ 275 $ 241<br />
Effective tax rate 30.2% 32.1% 32.8%<br />
The reconciliation of income taxes calculated at the U.S.<br />
federal tax statutory rate to our effective tax rate is set<br />
forth below:<br />
2003 2002 2001<br />
U.S. federal statutory tax rate<br />
State income tax, net of federal<br />
35.0% 35.0% 35.0%<br />
tax benefit<br />
Foreign and U.S. tax effects<br />
1.8 2.0 2.1<br />
attributable to foreign operations (3.6) (2.8) (0.7)<br />
Adjustments to reserves and prior years<br />
Foreign tax credit amended<br />
(1.7) (1.8) (1.8)<br />
return benefit<br />
Valuation allowance additions<br />
(4.1) — —<br />
(reversals) 2.8 — (1.7)<br />
Other, net — (0.3) (0.1)<br />
Effective tax rate 30.2% 32.1% 32.8%<br />
Income taxes and the effective tax rate as shown above<br />
reflect tax on all amounts included in our results of operations<br />
except for the income tax benefit of approximately<br />
$1 million on the $2 million cumulative effect adjustment<br />
recorded in the year ended December 27, 2003 due to the<br />
adoption of SFAS 143.<br />
The 2003 effective tax rate decreased 1.9 percentage<br />
points to 30.2%. The decrease in the effective tax rate was<br />
primarily due to a 4.1 percentage point benefit of amending<br />
certain prior U.S. income tax returns to claim credit for<br />
foreign taxes paid in prior years. The returns were amended<br />
upon our determination that it was more beneficial to claim<br />
credit for such taxes than to deduct such taxes, as had<br />
been done when the returns were originally filed. In future<br />
years, we anticipate continuing to claim credit for foreign<br />
taxes paid in the then current year, as we have done in 2003<br />
and 2002. However, the amended return benefit recognized<br />
in 2003 is non-recurring.<br />
The decrease in the 2003 effective tax rate was<br />
partially offset by the recognition of valuation allowances for<br />
certain deferred tax assets whose realization is no longer<br />
considered more likely than not. The valuation allowances<br />
recognized primarily related to deferred tax assets in Mexico<br />
and Thailand. See Note 22 for a discussion of valuation<br />
allowances.<br />
The 2002 effective tax rate decreased 0.7 percentage<br />
points to 32.1%. The decrease in the effective tax rate<br />
was primarily due to our claiming credit against our current<br />
and future U.S. income tax liability for foreign taxes paid<br />
in 2002, as opposed to deducting such taxes on our U.S.<br />
income tax returns as was done in 2001. This decrease was<br />
partially offset by the impact of lapping valuation allowance<br />
reversals recorded in 2001.<br />
In 2003 and 2002, the effective tax rate attributable to<br />
foreign operations was lower than the U.S. federal statutory
38.<br />
rate primarily due to the benefit of claiming credit against<br />
our current and future U.S. income tax liability for foreign<br />
taxes paid.<br />
Adjustments to reserves and prior years include<br />
the effects of the reconciliation of income tax amounts<br />
recorded in our Consolidated Statements of Income to<br />
amounts reflected on our tax returns, including any adjustments<br />
to the Consolidated Balance Sheets. Adjustments<br />
to reserves and prior years also includes changes in tax<br />
reserves established for potential exposure we may incur<br />
if a taxing authority takes a position on a matter contrary<br />
to our position. We evaluate these reserves, including<br />
interest thereon, on a quarterly basis to insure that they<br />
have been appropriately adjusted for events that we believe<br />
may impact our exposure.<br />
U.S. RESTAURANT UNIT ACTIVITY<br />
U.S. RESULTS OF OPERATIONS<br />
% B/(W) % B/(W)<br />
vs. vs.<br />
2003 2002 2002 2001<br />
Revenues<br />
Company sales $ 5,081 6 $ 4,778 11<br />
Franchise and license fees 574 1 569 5<br />
Total revenues $ 5,655 6 $ 5,347 11<br />
Company restaurant margin $ 739 (3) $ 764 18<br />
% of Company sales 14.6% (1.4) ppts. 16.0% 0.8 )ppts.<br />
Operating profit $ 812 1 $ 802 15<br />
Company<br />
Unconsolidated<br />
Affiliates .(a) Franchisees Licensees Total<br />
Balance at Dec. 29, 2001 4,284 — 12,733 2,545 19,562<br />
New Builds 210 4 233 136 583<br />
Acquisitions (b) 899 — 1,001 (3) 1,897<br />
Refranchising (47) — 47 — —<br />
Closures (153) — (351) (382) (886)<br />
Other (c) — — — (30) (30)<br />
Balance at Dec. 28, 2002 5,193 4 13,663 2,266 21,126<br />
New Builds 142 3 245 259 649<br />
Acquisitions 106 — (108) 2 —<br />
Refranchising (150) — 148 2 —<br />
Closures (197) (1) (386) (373) (957)<br />
Other — — 4 — 4<br />
Balance at Dec. 27, 2003 5,094 6 13,566 2,156 20,822<br />
% of Total<br />
(a) Represents Yan Can units.<br />
25% — 65% 10% 100%<br />
(b) Includes units that existed at the date of the acquisition of YGR on May 7, 2002.<br />
(c) Represents licensee units transferred from U.S. to International.<br />
U.S. Multibrand Restaurants Company Franchise Total<br />
Balance at Dec. 28, 2002 844 973 1,817<br />
Balance at Dec. 27, 2003 1,032 1,116 2,148<br />
For 2003 and 2002, Company multibrand unit gross additions<br />
were 222 and 212, respectively. For 2003 and 2002,<br />
franchise multibrand unit gross additions were 160 and<br />
153, respectively.<br />
U.S. SYSTEM SALES GROWTH<br />
System Sales Growth 2003 2002<br />
U.S. 3% 9%<br />
System sales increased 3% for 2003. Excluding the favorable<br />
impact of the YGR acquisition, system sales increased<br />
1%. The increase was driven by new unit development,<br />
partially offset by store closures.<br />
System sales increased 9% in 2002. Excluding the favorable<br />
impact of the YGR acquisition, system sales increased<br />
4%. The increase resulted from same store sales growth and<br />
new unit development, partially offset by store closures.<br />
U.S. REVENUES<br />
Company sales increased $303 million or 6% in 2003.<br />
Excluding the favorable impact of the YGR acquisition,<br />
company sales increased 2%. The increase was driven by<br />
new unit development, partially offset by store closures<br />
and refranchising.<br />
Franchise and license fees increased $5 million or 1%<br />
in 2003. Excluding the favorable impact of the YGR acquisition,<br />
franchise and license fees remained essentially flat
as a decrease primarily driven by store closures was largely<br />
offset by new unit development.<br />
Company sales increased $491 million or 11% in<br />
2002. Excluding the favorable impact of the YGR acquisition,<br />
company sales increased 3%. The increase was driven<br />
by new unit development and same store sales growth.<br />
The increase was partially offset by store closures and<br />
refranchising.<br />
Franchise and license fees increased $29 million or<br />
5% in 2002. Excluding the favorable impact of the YGR<br />
acquisition, franchise and license fees increased 3%. The<br />
increase was driven by same store sales growth and new<br />
unit development, partially offset by store closures.<br />
U.S. SAME STORE SALES<br />
U.S. same store sales includes only company restaurants<br />
that have been open one year or more. U.S. blended same<br />
store sales include KFC, Pizza Hut, and Taco Bell company<br />
owned restaurants only. U.S. same store sales for Long John<br />
Silver’s and A&W restaurants are not included. Following are<br />
the same store sales growth results by brand:<br />
2003<br />
Same Average<br />
Store Trans- Guest<br />
Sales actions Check<br />
KFC (2)% (4)% 2%<br />
Pizza Hut (1)% (4)% 3%<br />
Taco Bell 2% 1%<br />
2002<br />
1%<br />
Same Average<br />
Store Trans- Guest<br />
Sales actions Check<br />
KFC — (2)% 2%<br />
Pizza Hut — (2)% 2%<br />
Taco Bell 7% 4% 3%<br />
For 2003, blended Company same store sales were flat<br />
due to a decrease in transactions offset by an increase in<br />
average guest check. For 2002, blended Company same<br />
store sales were up 2% due to increases in both transactions<br />
and average guest check.<br />
U.S. COMPANY RESTAURANT MARGIN<br />
2003 2002 2001<br />
Company sales 100.0% 100.0% 100.0%<br />
Food and paper 28.8 28.2 28.6<br />
Payroll and employee benefits<br />
Occupancy and other operating<br />
31.0 30.9 30.6<br />
expenses 25.6 24.9 25.6<br />
Company restaurant margin 14.6% 16.0% 15.2%<br />
Restaurant margin as a percentage of sales decreased<br />
approximately 140 basis points in 2003. The decrease<br />
was primarily driven by increased occupancy expenses<br />
<strong>Yum</strong>! Brands Inc. 39.<br />
due to higher rent, primarily due to additional rent expense<br />
associated with the amended YGR sale-leaseback agreements,<br />
and utilities. The higher food and paper costs were<br />
primarily due to the impact of unfavorable discounting and<br />
product mix. Also contributing to the decrease was higher<br />
labor costs, primarily driven by low single-digit increases<br />
in wage rates.<br />
Restaurant margin as a percentage of sales increased<br />
approximately 80 basis points in 2002. The increase<br />
includes the favorable impact of approximately 50 basis<br />
points from the adoption of SFAS 142, which was partially<br />
offset by the unfavorable impact of approximately 20 basis<br />
points from the YGR acquisition. The increase was primarily<br />
driven by the favorable impact of same store sales growth<br />
on margin and lower food and paper costs, partially offset by<br />
an increase in labor costs. The decrease in food and paper<br />
costs was primarily driven by cheese costs. The increase in<br />
labor costs was primarily driven by wage rates.<br />
U.S. OPERATING PROFIT<br />
Operating profit increased $10 million or 1% in 2003.<br />
Excluding the favorable impact of the YGR acquisition,<br />
operating profit was flat compared to 2002. Decreases<br />
driven by lower margins as a result of increased occupancy<br />
expenses and the impact of unfavorable discounting and<br />
product mix shift on food and paper costs were offset by<br />
lower franchise and license and general and administrative<br />
expenses.<br />
Operating profit increased $107 million or 15% in<br />
2002, including a 3% favorable impact from the adoption<br />
of SFAS 142. Excluding the favorable impact of both SFAS<br />
142 and the YGR acquisition, operating profit increased<br />
9%. The increase was driven by same store sales growth<br />
and the favorable impact of lapping franchise support costs<br />
related to the restructuring of certain Taco Bell franchisees<br />
in 2001. The increase was partially offset by higher restaurant<br />
operating costs, primarily due to higher labor costs, and<br />
the unfavorable impact of refranchising and store closures.<br />
The higher labor costs were driven by wage rates.<br />
INTERNATIONAL RESULTS OF OPERATIONS<br />
% B/(W) % B/(W)<br />
vs. vs.<br />
2003 2002 2002 2001<br />
Revenue<br />
Company sales $ 2,360 12 $ 2,113 14<br />
Franchise and license fees 365 23 297 8<br />
Total revenues $ 2,725 13 $ 2,410 13<br />
Company restaurant margin $ 365 8 $ 337 31<br />
% of Company sales 15.5% (0.5) ppts. 16.0% 2.1 )ppts.<br />
Operating profit $ 441 22 $ 361 19
40.<br />
INTERNATIONAL RESTAURANT UNIT ACTIVITY<br />
Unconsolidated<br />
Company Affiliates Franchisees Licensees Total<br />
Balance at Dec. 29, 2001 2,151 2,000 6,530 246 10,927<br />
New Builds 375 161 515 10 1,061<br />
Acquisitions (a) 6 41 163 — 210<br />
Refranchising (127) (14) 141 — —<br />
Closures (71) (46) (298) (27) (442)<br />
Other (b) (1) 2 10 31 42<br />
Balance at Dec. 28, 2002 2,333 2,144 7,061 260 11,798<br />
New Builds 312 173 623 13 1,121<br />
Acquisitions 283 (736) 453 — —<br />
Refranchising (78) (1) 79 — —<br />
Closures (90) (74) (305) (15) (484)<br />
Other (c) — — (6) (52) (58)<br />
Balance at Dec. 27, 2003 2,760 1,506 7,905 206 12,377<br />
% of Total<br />
(a) Includes units that existed at the date of the acquisition of YGR on May 7, 2002.<br />
(b) Primarily represents licensee units transferred from U.S. to International in 2002.<br />
(c) Represents an adjustment of previously reported amounts.<br />
22% 12% 64% 2% 100%<br />
International<br />
Multibrand Restaurants Company Franchise Total<br />
Balance at Dec. 28, 2002 44 114 158<br />
Balance at Dec. 27, 2003 64 133 197<br />
For 2003 and 2002, Company multibrand unit gross additions<br />
were 13 and 4, respectively. Company multibrand<br />
restaurants at December 27, 2003 also include 9 units<br />
acquired during the year from an unconsolidated affiliate.<br />
For 2003 and 2002, franchise multibrand unit gross additions<br />
were 34 and 13, respectively.<br />
INTERNATIONAL SYSTEM SALES GROWTH<br />
System Sales Growth 2003 2002<br />
International 14% 8%<br />
System sales increased 14% in 2003, after a 7% favorable<br />
impact from foreign currency translation. The increase was<br />
driven by new unit development, partially offset by store<br />
closures.<br />
System sales increased 8% in 2002, after a 1% unfavorable<br />
impact from foreign currency translation. Excluding<br />
the impact of foreign currency translation and the favorable<br />
impact of the YGR acquisition, system sales increased 8%.<br />
The increase was driven by new unit development and same<br />
store sales growth, partially offset by store closures.<br />
INTERNATIONAL REVENUES<br />
Company sales increased $247 million or 12% in 2003,<br />
after a 4% favorable impact from foreign currency translation.<br />
The increase was driven by new unit development,<br />
partially offset by refranchising, same store sales declines<br />
and store closures.<br />
Franchise and license fees increased $68 million or<br />
23% in 2003, after a 9% favorable impact from foreign<br />
currency translation. The increase was driven by new unit<br />
development, royalty rate increases and same store sales<br />
growth, partially offset by store closures.<br />
Company sales increased $262 million or 14% in 2002,<br />
after a 1% favorable impact from foreign currency translation.<br />
The increase was driven by new unit development, partially<br />
offset by refranchising and store closures. The unfavorable<br />
impact of refranchising primarily resulted from the sale of<br />
the Singapore business in the third quarter of 2002.<br />
Franchise and license fees increased $22 million or<br />
8% in 2002, after a 1% unfavorable impact from foreign<br />
currency translation. Excluding the impact of foreign<br />
currency translation and the favorable impact of the YGR<br />
acquisition, franchise and license fees increased 8%. The<br />
increase was driven by new unit development and same<br />
store sales growth, partially offset by store closures.<br />
INTERNATIONAL COMPANY RESTAURANT MARGIN<br />
2003 2002 2001<br />
Company sales 100.0% 100.0% 100.0%<br />
Food and paper 35.5 36.1 36.9<br />
Payroll and employee benefits<br />
Occupancy and other<br />
19.0 18.7 19.1<br />
operating expenses 30.0 29.2 30.1<br />
Company restaurant margin 15.5% 16.0% 13.9%
Restaurant margin as a percentage of sales decreased<br />
approximately 50 basis points in 2003, including a 20 basis<br />
points unfavorable impact from foreign currency translation.<br />
The remaining decrease was driven by the impact on margin<br />
of same store sales declines. These decreases were partially<br />
offset by the impact of supply chain savings initiatives on the<br />
cost of food and paper (principally in China), and the cessation<br />
of depreciation expense of approximately $9 million for<br />
the Puerto Rico business which is held for sale.<br />
Restaurant margin as a percentage of sales increased<br />
approximately 210 basis points in 2002, including the<br />
favorable impact of approximately 60 basis points from<br />
the adoption of SFAS 142. The increase was primarily driven<br />
by the favorable impact of lower restaurant operating costs<br />
and the elimination of lower average margin units through<br />
store closures. Lower restaurant operating costs primarily<br />
resulted from lower food and paper costs, partially offset<br />
by higher labor costs.<br />
INTERNATIONAL OPERATING PROFIT<br />
Operating profit increased $80 million or 22% in 2003,<br />
including a 7% favorable impact from foreign currency<br />
translation. The remaining increase was driven by new unit<br />
development and the impact of supply chain savings initiatives<br />
on the cost of food and paper, partially offset by the<br />
impact of same store sales declines on margins and higher<br />
general and administrative expenses.<br />
Operating profit increased $56 million or 19% in 2002.<br />
Excluding the impact of foreign currency translation and the<br />
favorable impact from the adoption of SFAS 142, operating<br />
profit increased 13%. The increase was driven by new unit<br />
development and the favorable impact of lower restaurant<br />
operating costs, primarily lower cost of food and paper. The<br />
increase was partially offset by higher general and administrative<br />
expenses, primarily compensation-related costs.<br />
CONSOLIDATED CASH FLOWS<br />
Net cash provided by operating activities was<br />
$1,053 million compared to $1,088 million in 2002. The<br />
decrease was primarily driven by $130 million in voluntary<br />
contributions to our funded pension plan in 2003, partially<br />
offset by higher net income.<br />
In 2002, net cash provided by operating activities<br />
was $1,088 million compared to $832 million in 2001.<br />
Excluding the impact of the AmeriServe bankruptcy reorganization<br />
process, cash provided by operating activities was<br />
$1,043 million versus $704 million in 2001. The increase<br />
was driven by higher net income and timing of tax receipts<br />
and payments.<br />
Net cash used in investing activities was $519 million<br />
versus $885 million in 2002. The decrease in cash used<br />
was driven by the $275 million acquisition of YGR in 2002<br />
and lower capital spending in 2003.<br />
<strong>Yum</strong>! Brands Inc. 41.<br />
In 2002, net cash used in investing activities was<br />
$885 million versus $503 million in 2001. The increase in<br />
cash used was primarily due to the acquisition of YGR and<br />
higher capital spending in 2002, partially offset by the acquisition<br />
of fewer restaurants from franchisees in 2002.<br />
Net cash used in financing activities was $475 million<br />
versus $187 million in 2002. The increase was driven by<br />
higher net debt repayments and higher shares repurchased<br />
in 2003.<br />
In 2002, net cash used in financing activities was<br />
$187 million versus $352 million in 2001. The decrease is<br />
primarily due to lower debt repayments and higher proceeds<br />
from stock option exercises versus 2001, partially offset<br />
by higher shares repurchased in 2002.<br />
CONSOLIDATED FINANCIAL CONDITION<br />
Assets increased $220 million or 4% to $5.6 billion<br />
primarily due to a net increase in property, plant and<br />
equipment, driven by capital expenditures in excess of<br />
depreciation and asset dispositions. The decrease in<br />
the allowance for doubtful accounts from $42 million to<br />
$28 million was primarily the result of the write-off of receivables<br />
previously fully reserved.<br />
Liabilities decreased $306 million or 6% to $4.5 billion<br />
primarily due to the repayment of amounts under our Credit<br />
Facility, decreased short-term borrowings and the reduction<br />
in long-term debt as a result of the amendment of<br />
certain sale-leaseback agreements (see Note 14). These<br />
decreases were partially offset by an increase in accounts<br />
payable and other current liabilities primarily due to the<br />
accrual of $42 million related to the Wrench litigation.<br />
LIQUIDITY AND CAPITAL RESOURCES<br />
Operating in the QSR industry allows us to generate<br />
substantial cash flows from the operations of our company<br />
stores and from our franchise operations, which require a<br />
limited YUM investment. In each of the last two fiscal years,<br />
net cash provided by operating activities has exceeded $1<br />
billion. These cash flows have allowed us to fund our<br />
discretionary spending, while at the same time reducing<br />
our long-term debt balances. We expect these levels of net<br />
cash provided by operating activities to continue in the foreseeable<br />
future. Our discretionary spending includes capital<br />
spending for new restaurants, acquisitions of restaurants<br />
from franchisees and repurchases of shares of our common<br />
stock. Though a decline in revenues could adversely impact<br />
our cash flows from operations, we believe our operating<br />
cash flows, our ability to reduce discretionary spending,<br />
and our borrowing capacity will allow us to meet our cash<br />
requirements in 2004 and beyond.<br />
Our primary bank credit agreement comprises a senior<br />
unsecured Revolving Credit Facility (the “Credit Facility”)<br />
which matures on June 25, 2005. On December 26,<br />
2003, we voluntarily reduced our maximum borrowings
42.<br />
under the Credit Facility from $1.2 billion to $1.0 billion.<br />
At December 27, 2003, our unused Credit Facility totaled<br />
$737 million, net of outstanding letters of credit of<br />
$263 million. There were no borrowings outstanding under<br />
the Credit Facility at December 27, 2003. Our Credit Facility<br />
contains financial covenants relating to maintenance of<br />
leverage and fixed charge coverage ratios. The Credit<br />
Facility also contains affirmative and negative covenants<br />
including, among other things, limitations on certain additional<br />
indebtedness, guarantees of indebtedness, level of<br />
cash dividends, aggregate non-U.S. investment and certain<br />
other transactions as defined in the agreement. We were in<br />
compliance with all covenants at December 27, 2003, and<br />
do not anticipate that the covenants will impact our ability<br />
to borrow under our Credit Facility for its remaining term.<br />
The remainder of our long-term debt primarily comprises<br />
senior unsecured notes. Amounts outstanding under senior<br />
unsecured notes were $1.85 billion at December 27, 2003.<br />
The first of these notes, in the amount of $350 million,<br />
matures in 2005. We currently anticipate that our net cash<br />
provided by operating activities will permit us to make a<br />
significant portion of this $350 million payment without<br />
borrowing additional amounts.<br />
We estimate that capital spending will be approximately<br />
$770 million and refranchising proceeds will be approximately<br />
$100 million in 2004. In November 2003, our Board<br />
of Directors authorized a new $300 million share repurchase<br />
program. At December 27, 2003, we had remaining<br />
capacity to repurchase, through May 21, 2005, up to<br />
$294 million of our outstanding Common Stock (excluding<br />
applicable transaction fees) under this program.<br />
In addition to any discretionary spending we may<br />
choose to make, significant contractual obligations and<br />
payments as of December 27, 2003 included:<br />
Less than More than<br />
Total 1 Year 1–3 Years 3–5 Years 5 Years<br />
Long-term debt (a) $ 1,930 $ 1 $ 553 $ 254 $ 1,122<br />
Capital leases (b) 192 15 29 26 122<br />
Operating leases (b) 2,484 320 540 431 1,193<br />
Purchase obligations (c) Other long-term liabilities reflected on our<br />
162 124 26 7 5<br />
Consolidated Balance Sheet under GAAP 31 — 17 5 9<br />
Total contractual obligations $ 4,799 $ 460 $ 1,165 $ 723 $ 2,451<br />
(a) Excludes a fair value adjustment of $29 million included in debt related to interest rate swaps that hedge the fair value of a portion of our debt. See Note 14.<br />
(b) These obligations, which are shown on a nominal basis, relate to approximately 5,900 restaurants. See Note 15.<br />
(c) Purchase obligations include agreements to purchase goods or services that are enforceable and legally binding on us and that specify all significant terms, including: fixed<br />
or minimum quantities to be purchased; fixed, minimum or variable price provisions; and the approximate timing of the transaction. We have excluded agreements that are<br />
cancelable without penalty. Purchase obligations relate primarily to purchases of property, plant and equipment as well as marketing, information technology, maintenance,<br />
consulting and other agreements.<br />
We have not included obligations under our pension and<br />
postretirement benefit plans in the contractual obligations<br />
table. Our funding policy regarding our funded pension plan<br />
is to contribute amounts necessary to satisfy minimum<br />
pension funding requirements plus such additional amounts<br />
from time to time as are determined to be appropriate to<br />
improve the plan’s funded status. The pension plan’s funded<br />
status is affected by many factors including discount rates<br />
and the performance of plan assets. We are not required to<br />
make minimum pension funding payments in 2004, but we<br />
may make discretionary contributions during the year based<br />
on our estimate of the plan’s expected September 30, 2004<br />
funded status. During 2003, we made voluntary pension<br />
contributions of $130 million to our funded plan, none<br />
of which represented minimum funding requirements.<br />
Our postretirement plan is not required to be funded in<br />
advance, but is pay as you go. We made postretirement<br />
benefit payments of $4 million in 2003.<br />
Also excluded from the contractual obligations table<br />
are payments we may make for employee health and property<br />
and casualty losses for which we are self-insured. The<br />
majority of our recorded liability for self-insured employee<br />
health and property and casualty losses represents<br />
estimated reserves for incurred claims that have yet to be<br />
filed or settled.<br />
OFF-BALANCE SHEET ARRANGEMENTS<br />
At December 27, 2003, we had provided approximately<br />
$32 million of partial guarantees of two franchisee loan<br />
pools, both of which were implemented prior to spin-off,<br />
related primarily to the Company’s historical refranchising<br />
programs and, to a lesser extent, franchisee development<br />
of new restaurants. The total loans outstanding under<br />
these loan pools were approximately $123 million at<br />
December 27, 2003. In support of these guarantees, we<br />
have posted $32 million of letters of credit. We also provide<br />
a standby letter of credit of $23 million under which we<br />
could potentially be required to fund a portion of one of the<br />
franchisee loan pools. Any funding under the guarantees or<br />
letters of credit would be secured by the franchisee loans<br />
and any related collateral. We believe that we have appropriately<br />
provided for our estimated probable exposures under<br />
these contingent liabilities. These provisions were primarily<br />
charged to facility actions. New loans are not currently being<br />
added to either loan pool.
We have guaranteed certain lines of credit and<br />
loans of Unconsolidated Affiliates totaling $28 million at<br />
December 27, 2003. Our Unconsolidated Affiliates had total<br />
revenues of over $1.5 billion for the year ended December 27,<br />
2003 and assets and debt of approximately $858 million<br />
and $41 million, respectively, at December 27, 2003.<br />
OTHER SIGNIFICANT KNOWN EVENTS,<br />
TRENDS OR UNCERTAINTIES EXPECTED TO IMPACT<br />
2004 OPERATING PROFIT COMPARISONS WITH 2003<br />
New Accounting Pronouncements Not Yet Adopted<br />
See Note 2.<br />
Canada Unconsolidated Affiliate Dissolution<br />
On November 10, 2003 our Unconsolidated Affiliate that<br />
previously operated 479 KFC, 236 Pizza Hut and 18<br />
Taco Bell restaurants in Canada was dissolved. We owned<br />
50% of this Unconsolidated Affiliate prior to its dissolution<br />
and accounted for our interest under the equity method.<br />
Upon dissolution, the Company assumed operation and<br />
acquired all associated assets of the Pizza Huts, as well<br />
as 17 Taco Bells and 5 KFCs. The Company also acquired<br />
the real estate associated with 140 KFCs for which the<br />
Company will not be the operator. Our former partner in the<br />
Unconsolidated Affiliate acquired full ownership of all other<br />
assets, as well as the franchise rights to operate 474 KFCs<br />
and one Taco Bell. Our former partner retained 10 KFCs and<br />
sold the remainder of these assets and franchise rights<br />
acquired to a newly-formed, publicly-held Income Trust in<br />
Canada, of which our former partner now holds a minority<br />
interest. The Company leases land and buildings for KFCs<br />
it does not operate to the Income Trust under operating and<br />
capital lease agreements through 2018. The Company will<br />
continue to receive a franchise royalty from the KFCs operated<br />
by our former partner and the Income Trust.<br />
The Company realized an immaterial gain upon dissolution<br />
of the Unconsolidated Affiliate. This gain was realized<br />
as the fair value of our increased ownership in the assets<br />
received was greater than our carrying value in those<br />
assets, and was net of expenses associated with the<br />
dissolution of the Unconsolidated Affiliate.<br />
The impact of the restructuring on our 2003 results of<br />
operations was not significant. As a result of the restructuring,<br />
2004 Company sales are expected to increase by<br />
approximately $165 million and franchise fees are expected<br />
to decrease by approximately $10 million. The impact on<br />
net income is not expected to be material.<br />
Amendment of Sale-Leaseback Agreements<br />
As discussed in Note 14 and on page 33 of this MD&A,<br />
in 2003 we amended two sale-leaseback agreements<br />
assumed in our 2002 acquisition of YGR. We estimate the<br />
impact of these amendments in 2004 to be a decrease in<br />
restaurant profit of $8 million and a decrease in interest<br />
expense of $10 million.<br />
<strong>Yum</strong>! Brands Inc. 43.<br />
Puerto Rico Business Held for Sale<br />
Our Puerto Rican business has been held for sale since the<br />
fourth quarter of 2002. While a sale of the Puerto Rican<br />
business has not yet occurred, we continue to believe that<br />
it is probable that a sale will occur during 2004. Sales<br />
and restaurant profits of the Puerto Rican business were<br />
$187 million and $34 million in 2003.<br />
Contingent Lease Guarantees<br />
Under terms of our separation agreements at the time of<br />
the Spin-off, we indemnified PepsiCo for any losses incurred<br />
related to their guarantees of lease agreements of certain<br />
non-core businesses which were sold prior to the Spinoff.<br />
Two of these businesses, Chevys Mexican Restaurant<br />
(Chevys) and Hot ’n Now (HNN) filed for bankruptcy protection<br />
in October 2003 and January 2004, respectively. While<br />
we cannot presently determine our liability under these<br />
indemnities, if any, we do not expect the amount to have a<br />
material impact on our Consolidated Financial Statements.<br />
Any costs incurred will be charged to AmeriServe and other<br />
charges (credits). See Note 24 for further discussion.<br />
Pension Plan Funded Status<br />
Certain of our employees are covered under noncontributory<br />
defined benefit pension plans. The most significant of these<br />
plans was amended in 2001 such that employees hired<br />
after September 30, 2001 are no longer eligible to participate.<br />
As of our September 30, 2003 measurement date,<br />
these plans had a projected benefit obligation (“PBO”) of<br />
$629 million, an accumulated benefit obligation (“ABO”) of<br />
$563 million and a fair value of plan assets of $438 million.<br />
As a result of the $125 million underfunded status of the<br />
plans relative to the ABO at September 30, 2003, we have<br />
recorded a $101 million charge to shareholders’ equity (net<br />
of tax of $61 million) as of December 27, 2003.<br />
The PBO and ABO reflect the actuarial present value<br />
of all benefits earned to date by employees. The PBO<br />
incorporates assumptions as to future compensation<br />
levels while the ABO reflects only current compensation<br />
levels. Due to the relatively long time frame over which<br />
benefits earned to date are expected to be paid, our<br />
PBO and ABO are highly sensitive to changes in discount<br />
rates. We measured our PBO and ABO using a discount<br />
rate of 6.25% at September 30, 2003. A 50 basis point<br />
increase in this discount rate would have decreased our<br />
PBO by approximately $58 million at September 30, 2003.<br />
Conversely, a 50 basis point decrease in this discount rate<br />
would have increased our PBO by approximately $60 million<br />
at September 30, 2003.<br />
Our expected long-term rate of return on plan assets is<br />
8.5%. We believe that this assumption is appropriate given<br />
the composition of our plan assets and historical market<br />
returns thereon. Given no change to the market-related<br />
value of our plan assets as of September 30, 2003, a one<br />
percentage point increase or decrease in our expected rate<br />
of return on plan assets assumption would decrease or
44.<br />
increase, respectively, our 2004 pension plan expense by<br />
approximately $4 million.<br />
The losses our plan assets have experienced, along<br />
with the decrease in discount rates, have largely contributed<br />
to the unrecognized actuarial loss of $230 million<br />
in our plans as of September 30, 2003. For purposes of<br />
determining 2003 expense our funded status was such<br />
that we recognized $6 million of unrecognized actuarial<br />
loss in 2003. We will recognize approximately $19 million<br />
of unrecognized actuarial loss in 2004. Given no change to<br />
the assumptions at our September 30, 2003 measurement<br />
date, actuarial loss recognition will remain at an amount<br />
near that to be recognized in 2004 over the next few years<br />
before it begins to gradually decline.<br />
In total, we expect pension expense to increase<br />
approximately $14 million to $54 million in 2004. We have<br />
incorporated this incremental expense into our operating<br />
plans and outlook. The increase is driven by the recognition<br />
of actuarial losses as discussed in the preceding paragraph<br />
and an increase in interest cost because of the higher PBO.<br />
Service cost will also increase as a result of the lower<br />
discount rate, though, as previously mentioned, the plans<br />
are closed to new participants. A 50 basis point change in<br />
our discount rate assumption of 6.25% at September 30,<br />
2003 would impact our 2004 pension expense by approximately<br />
$11 million.<br />
We do not believe that the underfunded status of the<br />
pension plans will materially affect our financial position or<br />
cash flows in 2004 or future years. Given current funding<br />
levels and discount rates we would anticipate making contributions<br />
to fully fund the pension plans over the course of<br />
the next five years. We believe our cash flows from operating<br />
activities of approximately $1 billion per year are<br />
sufficient to allow us to make necessary contributions to<br />
the plans, and anticipated fundings have been incorporated<br />
into our cash flow projections. We have included known<br />
and expected increases in our pension expense as well as<br />
future expected plan contributions in our operating plans<br />
and outlook.<br />
Avian Flu<br />
In several Asian markets, including Thailand, Taiwan,<br />
South Korea, Japan, Indonesia, Malaysia, Singapore and<br />
certain sections of China, avian flu has impacted retail<br />
sales trends and sales trends at KFC through March 5,<br />
2004. Based on information as of March 5, 2004, the<br />
Company believes that the most likely effect of avian flu<br />
outbreaks in these markets, some of which are completely<br />
franchised markets, will be short term. Additionally, the<br />
Company currently does not expect that the avian flu<br />
outbreak will materially affect its chicken supply in Asia or<br />
other markets.<br />
Our most significant market that has been affected by<br />
the avian flu is China. As we have previously stated, if the<br />
avian flu outbreak were to affect the entire country of China<br />
for up to two months (through the end of March 2004) with<br />
sales declines in the range of 20% at KFC, 2004 diluted EPS<br />
results for the Company would be unfavorably impacted by<br />
up to $0.02. We have incorporated this potential unfavorable<br />
impact in our operating plans and outlook.<br />
AmeriServe and Other Charges (Credits)<br />
During 2004, we expect to recover approximately $10 million<br />
related to recoveries from the AmeriServe bankruptcy reorganization<br />
process. We expect that this will substantially<br />
complete our recoveries related to the AmeriServe bankruptcy<br />
reorganization process. See Note 7 for a detailed<br />
discussion of AmeriServe and other charges (credits).<br />
CRITICAL ACCOUNTING POLICIES<br />
Our reported results are impacted by the application of<br />
certain accounting policies that require us to make subjective<br />
or complex judgments. These judgments involve<br />
estimations of the effect of matters that are inherently<br />
uncertain and may significantly impact our quarterly or<br />
annual results of operations or financial condition. Changes<br />
in the estimates and judgements could significantly affect<br />
our results of operations, financial condition and cash flows<br />
in future years. A description of what we consider to be our<br />
most significant critical accounting policies follows.<br />
Impairment or Disposal of Long-Lived Assets<br />
We evaluate our long-lived assets for impairment at the<br />
individual restaurant level. Restaurants held and used are<br />
evaluated for impairment on a semi-annual basis or whenever<br />
events or circumstances indicate that the carrying<br />
amount of a restaurant may not be recoverable (including<br />
a decision to close a restaurant). Our semi-annual test<br />
includes those restaurants that have experienced two<br />
consecutive years of operating losses. These impairment<br />
evaluations require an estimation of cash flows over the<br />
remaining useful life of the primary asset of the restaurant,<br />
which can be for a period of over 20 years, and any terminal<br />
value. We limit assumptions about important factors such<br />
as sales growth and margin improvement to those that are<br />
supportable based upon our plans for the unit and actual<br />
results at comparable restaurants.<br />
If the long-lived assets of a restaurant on a held and<br />
used basis are not recoverable based upon forecasted,<br />
undiscounted cash flows, we write the assets down to their<br />
fair value. This fair value is determined by discounting the<br />
forecasted cash flows, including terminal value, of the<br />
restaurant at an appropriate rate. The discount rate used<br />
is our cost of capital, adjusted upward when a higher risk<br />
is believed to exist.<br />
When it is probable that we will sell a restaurant,<br />
we write down the restaurant to its fair value. We often<br />
refranchise restaurants in groups and therefore perform<br />
impairment evaluations at the group level. Fair value is<br />
based on the expected sales proceeds less applicable<br />
transaction costs. Estimated sales proceeds are based<br />
on the most relevant of historical sales multiples or bids
from buyers, and have historically been reasonably accurate<br />
estimations of the proceeds ultimately received.<br />
See Note 2 for a further discussion of our policy<br />
regarding the impairment or disposal of long-lived assets.<br />
Impairment of Investments in Unconsolidated Affiliates<br />
We record impairment charges related to an investment<br />
in an unconsolidated affiliate whenever events or<br />
circumstances indicate that a decrease in the value of an<br />
investment has occurred which is other than temporary. In<br />
addition, we evaluate our investments in unconsolidated<br />
affiliates for impairment when they have experienced two<br />
consecutive years of operating losses. Our impairment<br />
measurement test for an investment in an unconsolidated<br />
affiliate is similar to that for our restaurants except that we<br />
use discounted cash flows after interest and taxes instead<br />
of discounted cash flows before interest and taxes as used<br />
for our restaurants. The fair value of our investments in<br />
unconsolidated affiliates is generally significantly in excess<br />
of their carrying value.<br />
See Note 2 for a further discussion of our policy<br />
regarding the impairment of investments in unconsolidated<br />
affiliates.<br />
Impairment of Goodwill and Indefinite-Lived<br />
Intangible Assets<br />
We evaluate goodwill and indefinite-lived intangible assets<br />
for impairment on an annual basis or more often if an event<br />
occurs or circumstances change that indicates impairment<br />
might exist. Goodwill is evaluated for impairment through<br />
the comparison of fair value of our reporting units to their<br />
carrying values. Our reporting units are our operating<br />
segments in the U.S. and our business management units<br />
internationally (typically individual countries). Fair value is<br />
the price a willing buyer would pay for the reporting unit,<br />
and is generally estimated by discounting expected future<br />
cash flows from the reporting units over twenty years plus<br />
an expected terminal value. We limit assumptions about<br />
important factors such as sales growth and margin improvement<br />
to those that are supportable based upon our plans<br />
for the reporting unit.<br />
For 2003, there was no impairment of goodwill identified<br />
during our annual impairment testing. For our reporting<br />
units with goodwill, the fair value is generally significantly<br />
in excess of the recorded carrying value. Thus, we do not<br />
believe that we have material goodwill that is at risk to be<br />
impaired given current business performance. For 2002,<br />
we impaired $5 million of goodwill related to the Pizza Hut<br />
France reporting unit.<br />
Our impairment test for indefinite-lived intangible<br />
assets consists of a comparison of the fair value of the<br />
asset with its carrying amount. Our indefinite-lived intangible<br />
assets consist of values assigned to trademarks/brands<br />
of which we have acquired ownership (or the right to a<br />
perpetual royalty-free license in the case of A&W). We<br />
believe the value of these trademarks/brands is derived<br />
<strong>Yum</strong>! Brands Inc. 45.<br />
from the royalty we avoid, in the case of Company stores, or<br />
receive, in the case of franchise stores, due to our ownership<br />
of or royalty-free license of the trademarks/brands.<br />
Thus, anticipated sales are the most important assumption<br />
in valuing trademarks/brands. We limit assumptions about<br />
sales growth, as well as other factors impacting the fair<br />
value calculation, to those that are supportable based on<br />
our plans for the applicable Concept.<br />
The most significant recorded trademark/brand assets<br />
resulted when we acquired YGR in 2002. Upon this acquisition,<br />
$140 million and $72 million were allocated to the<br />
LJS and A&W trademarks/brands, respectively. The results<br />
generated to date from the YGR acquisition on an overall<br />
basis have met our expectations. We also now believe<br />
opportunities exist beyond those assumed in justification<br />
of our acquisition price with regard to increased penetration<br />
of LJS, for both stand-alone units and as a multibrand<br />
partner. Accordingly, we now believe our system’s development<br />
capital, at least through the term of our current<br />
projections, will be primarily directed towards LJS.<br />
The decision to focus short-term development on<br />
increased penetration of LJS and discretionary capital<br />
spending limits have resulted in less than originally planned<br />
development of A&W in the near term. Additionally, while we<br />
continue to view A&W as a viable multibrand partner, subsequent<br />
to acquisition we decided to close or refranchise all<br />
Company-owned A&W restaurants that we had acquired.<br />
These restaurants were low-volume, mall-based units, that<br />
were inconsistent with the remainder of our Companyowned<br />
portfolio. We incorporated these plans into our fair<br />
value estimates of the LJS and A&W trademarks/brands in<br />
2003. As sales projections for LJS were in excess of those<br />
originally assumed when valuing the LJS trademark/brand,<br />
the trademark/brand’s current fair value is in excess of its<br />
carrying value. Both the decision to close the Companyowned<br />
A&W units and the decision to focus on short-term<br />
development opportunities at LJS negatively impacted the<br />
fair value of the A&W trademark/brand. Accordingly, we<br />
recorded a charge of $5 million in 2003 to write the value<br />
of A&W trademark/brand down to its fair value.<br />
While we believe the sales assumptions used in our<br />
determination of the fair value of the A&W trademark/brand<br />
are reasonable and consistent with our operating plans<br />
and forecasts, fluctuations in the assumptions would<br />
have impacted our impairment calculation. If the long-term<br />
rate of sales growth used in our determination of the fair<br />
value of the A&W trademark/brand would have been one<br />
percentage point higher, the trademark/brand would not<br />
have been impaired. Alternatively, if the long-term rate of<br />
sales growth would have been one percentage point lower,<br />
additional impairment of approximately $4 million would<br />
have been recognized.<br />
See Note 2 for a further discussion of our policies<br />
regarding goodwill and indefinite-lived intangible assets.
46.<br />
Allowances for Franchise and License Receivables<br />
and Contingent Liabilities<br />
We reserve a franchisee’s or licensee’s entire receivable<br />
balance based upon pre-defined aging criteria and upon<br />
the occurrence of other events that indicate that we may<br />
not collect the balance due. As a result of reserving using<br />
this methodology, we have an immaterial amount of receivables<br />
that are past due that have not been reserved for at<br />
December 27, 2003. See Note 2 for a further discussion of<br />
our policies regarding franchise and license operations.<br />
Primarily as a result of our refranchising efforts, we<br />
remain liable for certain lease assignments and guarantees.<br />
We record a liability for our exposure under these<br />
lease assignments and guarantees when such exposure is<br />
probable and estimable. At December 27, 2003, we have<br />
recorded an immaterial liability for our exposure which we<br />
consider to be probable and estimable. The potential total<br />
exposure under such leases is significant, with $326 million<br />
representing the present value of the minimum payments of<br />
the assigned leases at December 27, 2003, discounted at<br />
our pre-tax cost of debt. Current franchisees are the primary<br />
lessees under the vast majority of these leases. We generally<br />
have cross-default provisions with these franchisees<br />
that would put them in default of their franchise agreement<br />
in the event of non-payment under the lease. We believe<br />
these cross-default provisions significantly reduce the risk<br />
that we will be required to make payments under these<br />
leases and, historically, we have not been required to make<br />
such payments in significant amounts. See Note 24 for a<br />
further discussion of our lease guarantees.<br />
Self-Insured Property and Casualty Losses<br />
We record our best estimate of the remaining cost to settle<br />
incurred self-insured property and casualty claims. The estimate<br />
is based on the results of an independent actuarial<br />
study and considers historical claim frequency and severity<br />
as well as changes in factors such as our business environment,<br />
benefit levels, medical costs and the regulatory<br />
environment that could impact overall self-insurance costs.<br />
Additionally, a risk margin to cover unforeseen events that<br />
may occur over the several years it takes for claims to settle<br />
is included in our reserve, increasing our confidence level<br />
that the recorded reserve is adequate.<br />
See Note 24 for a further discussion of our insurance<br />
programs.<br />
Income Tax Valuation Allowances and Tax Reserves<br />
At December 27, 2003, we have a valuation allowance of<br />
$183 million primarily to reduce our net operating loss and<br />
tax credit carryforwards of $231 million to an amount that<br />
will more likely than not be realized. These net operating<br />
loss and tax credit carryforwards exist in many state and<br />
foreign jurisdictions and have varying carryforward periods<br />
and restrictions on usage. The estimation of future taxable<br />
income in these state and foreign jurisdictions and our<br />
resulting ability to utilize net operating loss and tax credit<br />
carryforwards can significantly change based on future<br />
events, including our determinations as to the feasibility<br />
of certain tax planning strategies. Thus, recorded valuation<br />
allowances may be subject to material future changes.<br />
As a matter of course, we are regularly audited by<br />
federal, state and foreign tax authorities. We provide<br />
reserves for potential exposures when we consider it<br />
probable that a taxing authority may take a sustainable<br />
position on a matter contrary to our position. We evaluate<br />
these reserves, including interest thereon, on a quarterly<br />
basis to insure that they have been appropriately adjusted<br />
for events that may impact our ultimate payment for such<br />
exposures.<br />
See Note 22 for a further discussion of our income<br />
taxes.<br />
QUANTITATIVE AND QUALITATIVE DISCLOSURES<br />
ABOUT MARKET RISK<br />
The Company is exposed to financial market risks associated<br />
with interest rates, foreign currency exchange rates<br />
and commodity prices. In the normal course of business<br />
and in accordance with our policies, we manage these risks<br />
through a variety of strategies, which may include the use<br />
of derivative financial and commodity instruments to hedge<br />
our underlying exposures. Our policies prohibit the use of<br />
derivative instruments for trading purposes, and we have<br />
procedures in place to monitor and control their use.<br />
Interest Rate Risk<br />
We have a market risk exposure to changes in interest rates,<br />
principally in the United States. We attempt to minimize this<br />
risk and lower our overall borrowing costs through the utilization<br />
of derivative financial instruments, primarily interest<br />
rate swaps. These swaps are entered into with financial<br />
institutions and have reset dates and critical terms that<br />
match those of the underlying debt. Accordingly, any change<br />
in market value associated with interest rate swaps is offset<br />
by the opposite market impact on the related debt.<br />
At December 27, 2003 and December 28, 2002, a<br />
hypothetical 100 basis point increase in short-term interest<br />
rates would result in a reduction of approximately $3 million<br />
and $6 million, respectively, in annual income before<br />
income taxes. The estimated reductions are based upon<br />
the level of variable rate debt and assume no changes in the<br />
volume or composition of debt. In addition, the fair value of<br />
our derivative financial instruments at December 27, 2003<br />
and December 28, 2002 would decrease approximately<br />
$5 million and $8 million, respectively. The fair value of<br />
our Senior Unsecured Notes at December 27, 2003<br />
and December 28, 2002 would decrease approximately<br />
$87 million and $93 million, respectively. Fair value was<br />
determined by discounting the projected cash flows.
Foreign Currency Exchange Rate Risk<br />
International operating profit constitutes approximately 36%<br />
of our operating profit in 2003, excluding unallocated and<br />
corporate expenses. In addition, the Company’s net asset<br />
exposure (defined as foreign currency assets less foreign<br />
currency liabilities) totaled approximately $1.3 billion as<br />
of December 27, 2003. Operating in international markets<br />
exposes the Company to movements in foreign currency<br />
exchange rates. The Company’s primary exposures result<br />
from our operations in Asia-Pacific, the Americas and<br />
Europe. Changes in foreign currency exchange rates would<br />
impact the translation of our investments in foreign operations,<br />
the fair value of our foreign currency denominated<br />
financial instruments and our reported foreign currency<br />
denominated earnings and cash flows. For the fiscal year<br />
ended December 27, 2003, operating profit would have<br />
decreased $49 million if all foreign currencies had uniformly<br />
weakened 10% relative to the U.S. dollar. The estimated<br />
reduction assumes no changes in sales volumes or local<br />
currency sales or input prices.<br />
We attempt to minimize the exposure related to our<br />
investments in foreign operations by financing those<br />
investments with local currency debt when practical and<br />
holding cash in local currencies when possible. In addition,<br />
we attempt to minimize the exposure related to foreign<br />
currency denominated financial instruments by purchasing<br />
goods and services from third parties in local currencies<br />
when practical. Consequently, foreign currency denominated<br />
financial instruments consist primarily of intercompany<br />
short-term receivables and payables. At times, we utilize<br />
forward contracts to reduce our exposure related to these<br />
foreign currency denominated financial instruments. The<br />
notional amount and maturity dates of these contracts<br />
match those of the underlying receivables or payables<br />
such that our foreign currency exchange risk related to<br />
these instruments is eliminated.<br />
Commodity Price Risk<br />
We are subject to volatility in food costs as a result of<br />
market risk associated with commodity prices. Our ability<br />
to recover increased costs through higher pricing is, at<br />
times, limited by the competitive environment in which we<br />
operate. We manage our exposure to this risk primarily<br />
through pricing agreements as well as, on a limited basis,<br />
commodity future and option contracts. Commodity future<br />
and option contracts entered into for the fiscal years<br />
ended December 27, 2003, and December 28, 2002, did<br />
not significantly impact our financial position, results of<br />
operations or cash flows.<br />
<strong>Yum</strong>! Brands Inc. 47.<br />
CAUTIONARY STATEMENTS<br />
From time to time, in both written reports and oral statements,<br />
we present “forward-looking statements” within the<br />
meaning of Section 27A of the Securities Act of 1933, as<br />
amended, and Section 21E of the Securities Exchange Act<br />
of 1934, as amended. The statements include those identified<br />
by such words as “may,” “will,” “expect,” “project,”<br />
“anticipate,” “believe,” “plan” and other similar terminology.<br />
These “forward-looking statements” reflect our current<br />
expectations regarding future events and operating and<br />
financial performance and are based upon data available at<br />
the time of the statements. Actual results involve risks and<br />
uncertainties, including both those specific to the Company<br />
and those specific to the industry, and could differ materially<br />
from expectations.<br />
Company risks and uncertainties include, but are not<br />
limited to, potentially substantial tax contingencies related<br />
to the Spin-off, which, if they occur, require us to indemnify<br />
PepsiCo, Inc.; changes in effective tax rates; our debt<br />
leverage and the attendant potential restriction on our<br />
ability to borrow in the future; potential unfavorable variances<br />
between estimated and actual liabilities; our ability<br />
to secure distribution of products and equipment to our<br />
restaurants on favorable economic terms and our ability to<br />
ensure adequate supply of restaurant products and equipment<br />
in our stores; effects and outcomes of legal claims<br />
involving the Company; the effectiveness of operating initiatives<br />
and advertising and promotional efforts; the ongoing<br />
financial viability of our franchisees and licensees; the<br />
success of our refranchising strategy; volatility of actuarially<br />
determined losses and loss estimates; and adoption of new<br />
or changes in accounting policies and practices including<br />
pronouncements promulgated by standard setting bodies.<br />
Industry risks and uncertainties include, but are not<br />
limited to, economic and political conditions in the countries<br />
and territories where we operate, including effects of war<br />
and terrorist activities; changes in legislation and governmental<br />
regulation; new product and concept development<br />
by us and/or our food industry competitors; changes in<br />
commodity, labor, and other operating costs; changes in<br />
competition in the food industry; publicity which may impact<br />
our business and/or industry; severe weather conditions;<br />
volatility of commodity costs; increases in minimum wage<br />
and other operating costs; availability and cost of land and<br />
construction; consumer preferences, spending patterns<br />
and demographic trends; political or economic instability<br />
in local markets and changes in currency exchange and<br />
interest rates; the impact that any widespread illness or<br />
general health concern may have on our business and/or<br />
the economy of the countries in which we operate.
48.<br />
Consolidated Statements of Income<br />
Fiscal years ended December 27, 2003, December 28, 2002 and December 29, 2001<br />
(in millions, except per share data) 2003 2002 2001<br />
Revenues<br />
Company sales $ 7,441 $ 6,891 $ 6,138<br />
Franchise and license fees 939 866 815<br />
8,380 7,757 6,953<br />
Costs and Expenses, net<br />
Company restaurants<br />
Food and paper 2,300 2,109 1,908<br />
Payroll and employee benefits 2,024 1,875 1,666<br />
Occupancy and other operating expenses 2,013 1,806 1,658<br />
6,337 5,790 5,232<br />
General and administrative expenses 945 913 796<br />
Franchise and license expenses 28 49 59<br />
Facility actions 36 32 1<br />
Other (income) expense (41) (30) (23)<br />
Wrench litigation 42 — —<br />
AmeriServe and other charges (credits) (26) (27) (3)<br />
Total costs and expenses, net 7,321 6,727 6,062<br />
Operating Profit 1,059 1,030 891<br />
Interest expense, net 173 172 158<br />
Income Before Income Taxes and Cumulative Effect of Accounting Change 886 858 733<br />
Income tax provision 268 275 241<br />
Income before Cumulative Effect of Accounting Change 618 583 492<br />
Cumulative effect of accounting change, net of tax (1) — —<br />
Net Income $ 617 $ 583 $ 492<br />
Basic Earnings Per Common Share $ 2.10 $ 1.97 $ 1.68<br />
Diluted Earnings Per Common Share $ 2.02 $ 1.88 $ 1.62<br />
See accompanying Notes to Consolidated Financial Statements.
Consolidated Statements of Cash Flows<br />
Fiscal years ended December 27, 2003, December 28, 2002 and December 29, 2001<br />
<strong>Yum</strong>! Brands Inc. 49.<br />
(in millions) 2003 2002 2001<br />
Cash Flows — Operating Activities<br />
Net income<br />
Adjustments to reconcile net income to net cash provided by operating activities:<br />
$ 617 $ 583 $ 492<br />
Cumulative effect of accounting change, net of tax 1 — —<br />
Depreciation and amortization 401 370 354<br />
Facility actions 36 32 1<br />
Wrench litigation 42 — —<br />
AmeriServe and other charges (credits) (3) — (6)<br />
Contributions to defined benefit pension plans (132) (26) (48)<br />
Other liabilities and deferred credits 17 (12) 37<br />
Deferred income taxes (23) 21 (72)<br />
Other non-cash charges and credits, net<br />
Changes in operating working capital, excluding effects of acquisitions and dispositions:<br />
32 36 15<br />
Accounts and notes receivable 2 32 116<br />
Inventories (1) 11 (8)<br />
Prepaid expenses and other current assets — 19 (3)<br />
Accounts payable and other current liabilities (32) (37) (13)<br />
Income taxes payable 96 59 (33)<br />
Net change in operating working capital 65 84 59<br />
Net Cash Provided by Operating Activities 1,053 1,088 832<br />
Cash Flows — Investing Activities<br />
Capital spending (663) (760) (636)<br />
Proceeds from refranchising of restaurants 92 81 111<br />
Acquisition of Yorkshire Global Restaurants, Inc. — (275) —<br />
Acquisition of restaurants from franchisees (41) (13) (108)<br />
Short-term investments 13 9 27<br />
Sales of property, plant and equipment 46 58 57<br />
Other, net 34 15 46<br />
Net Cash Used in Investing Activities (519) (885) (503)<br />
Cash Flows — Financing Activities<br />
Proceeds from Senior Unsecured Notes<br />
Revolving Credit Facility activity, by original maturity<br />
— 398 842<br />
Three months or less, net (153) 59 (943)<br />
Proceeds from long-term debt — — 1<br />
Repayments of long-term debt (17) (511) (258)<br />
Short-term borrowings-three months or less, net (137) (15) 58<br />
Repurchase shares of common stock (278) (228) (100)<br />
Employee stock option proceeds 110 125 58<br />
Other, net — (15) (10)<br />
Net Cash Used in Financing Activities (475) (187) (352)<br />
Effect of Exchange Rate on Cash and Cash Equivalents 3 4 —<br />
Net Increase (Decrease) in Cash and Cash Equivalents 62 20 (23)<br />
Cash and Cash Equivalents — Beginning of Year 130 110 133<br />
Cash and Cash Equivalents — End of Year $ 192 $ 130 $ 110<br />
See accompanying Notes to Consolidated Financial Statements.
50.<br />
Consolidated Balance Sheets<br />
December 27, 2003 and December 28, 2002<br />
(in millions) 2003 2002<br />
ASSETS<br />
Current Assets<br />
Cash and cash equivalents $ 192 $ 130<br />
Short-term investments, at cost 15 27<br />
Accounts and notes receivable, less allowance: $28 in 2003 and $42 in 2002 169 168<br />
Inventories 67 63<br />
Assets classified as held for sale 96 111<br />
Prepaid expenses and other current assets 102 110<br />
Deferred income taxes 165 121<br />
Total Current Assets 806 730<br />
Property, plant and equipment, net 3,280 3,037<br />
Goodwill 521 485<br />
Intangible assets, net 357 364<br />
Investments in unconsolidated affiliates 184 229<br />
Other assets 472 555<br />
Total Assets $ 5,620 $ 5,400<br />
LIABILITIES AND SHAREHOLDERS’ EQUITY<br />
Current Liabilities<br />
Accounts payable and other current liabilities $ 1,213 $ 1,166<br />
Income taxes payable 238 208<br />
Short-term borrowings 10 146<br />
Total Current Liabilities 1,461 1,520<br />
Long-term debt 2,056 2,299<br />
Other liabilities and deferred credits 983 987<br />
Total Liabilities 4,500 4,806<br />
Shareholders’ Equity<br />
Preferred stock, no par value, 250 shares authorized; no shares issued<br />
Common stock, no par value, 750 shares authorized; 292 shares and<br />
— —<br />
294 shares issued in 2003 and 2002, respectively 916 1,046<br />
Retained earnings (accumulated deficit) 414 (203)<br />
Accumulated other comprehensive income (loss) (210) (249)<br />
Total Shareholders’ Equity 1,120 594<br />
Total Liabilities and Shareholders’ Equity $ 5,620 $ 5,400<br />
See accompanying Notes to Consolidated Financial Statements.
Consolidated Statements of Shareholders’ Equity (Deficit)<br />
and Comprehensive Income<br />
Fiscal years ended December 27, 2003, December 28, 2002 and December 29, 2001<br />
<strong>Yum</strong>! Brands Inc. 51.<br />
Retained Accumulated<br />
Earnings Other<br />
Issued Common Stock (Accumulated Comprehensive<br />
(in millions) Shares Amount Deficit) Income (Loss) Total<br />
Balance at December 30, 2000 294 $ 1,133 $ (1,278) $ (177) $ (322)<br />
Net income 492 492<br />
Foreign currency translation adjustment<br />
Net unrealized loss on derivative instruments<br />
(5) (5)<br />
(net of tax benefits of $1 million)<br />
Minimum pension liability adjustment<br />
(1) (1)<br />
(net of tax benefits of $14 million) (24) (24)<br />
Comprehensive Income 462<br />
Repurchase of shares of common stock<br />
Employee stock option exercises<br />
(5) (100) (100)<br />
(includes tax benefits of $13 million) 4 58 58<br />
Compensation-related events 6 6<br />
Balance at December 29, 2001 293 $ 1,097 $ (786) $ (207) $ 104<br />
Net income 583 583<br />
Foreign currency translation adjustment<br />
Net unrealized loss on derivative instruments<br />
6 6<br />
(net of tax benefits of $1 million)<br />
Minimum pension liability adjustment<br />
(1) (1)<br />
(net of tax benefits of $29 million) (47) (47)<br />
Comprehensive Income 541<br />
Repurchase of shares of common stock<br />
Employee stock option exercises<br />
(8) (228) (228)<br />
(includes tax benefits of $49 million) 9 174 174<br />
Compensation-related events 3 3<br />
Balance at December 28, 2002 294 $ 1,046 $ (203) $ (249) $ 594<br />
Net income<br />
Foreign currency translation adjustment<br />
617 617<br />
arising during the period<br />
Foreign currency translation adjustment<br />
67 67<br />
included in net income<br />
Minimum pension liability adjustment<br />
2 2<br />
(net of tax benefits of $18 million) (30) (30)<br />
Comprehensive Income 656<br />
Repurchase of shares of common stock<br />
Employee stock option exercises<br />
(9) (278) (278)<br />
(includes tax benefits of $26 million) 7 136 136<br />
Compensation-related events 12 12<br />
Balance at December 27, 2003 292 $ 916 $ 414 $ (210) $ 1,120<br />
See accompanying Notes to Consolidated Financial Statements.
52.<br />
Notes to Consolidated Financial Statements<br />
(Tabular amounts in millions, except share data)<br />
note 1<br />
DESCRIPTION OF BUSINESS<br />
YUM! Brands, Inc. and Subsidiaries (collectively referred<br />
to as “YUM” or the “Company”) comprises the worldwide<br />
operations of KFC, Pizza Hut, Taco Bell and since May 7,<br />
2002, Long John Silver’s (“LJS”) and A&W All-American Food<br />
Restaurants (“A&W”) (collectively the “Concepts”), which<br />
were added when we acquired Yorkshire Global Restaurants,<br />
Inc. (“YGR”). YUM is the world’s largest quick service restaurant<br />
company based on the number of system units, with over<br />
33,000 units in more than 100 countries and territories of<br />
which approximately 37% are located outside the U.S. YUM<br />
was created as an independent, publicly-owned company on<br />
October 6, 1997 (the “Spin-off Date”) via a tax-free distribution<br />
by our former parent, PepsiCo, Inc. (“PepsiCo”), of our<br />
Common Stock (the “Distribution” or “Spin-off”) to its shareholders.<br />
References to YUM throughout these Consolidated<br />
Financial Statements are made using the first person notations<br />
of “we,” “us “ or “our.”<br />
Through our widely-recognized Concepts, we develop,<br />
operate, franchise and license a system of both traditional<br />
and non-traditional quick service restaurants. Each Concept<br />
has proprietary menu items and emphasizes the preparation<br />
of food with high quality ingredients as well as unique<br />
recipes and special seasonings to provide appealing, tasty<br />
and attractive food at competitive prices. Our traditional<br />
restaurants feature dine-in, carryout and, in some instances,<br />
drive-thru or delivery service. Non-traditional units, which<br />
are principally licensed outlets, include express units and<br />
kiosks which have a more limited menu and operate in nontraditional<br />
locations like airports, gasoline service stations,<br />
convenience stores, stadiums, amusement parks and<br />
colleges, where a full-scale traditional outlet would not be<br />
practical or efficient. We are actively pursuing the strategy<br />
of multibranding, where two or more of our Concepts are<br />
operated in a single unit. In addition, we are testing multibranding<br />
options involving one of our Concepts and either a<br />
concept in development, such as Pasta Bravo, or a concept<br />
not owned or affiliated with YUM.<br />
note 2<br />
SUMMARY OF SIGNIFICANT ACCOUNTING POLICIES<br />
Our preparation of the accompanying Consolidated Financial<br />
Statements in conformity with accounting principles generally<br />
accepted in the United States of America requires us<br />
to make estimates and assumptions that affect reported<br />
amounts of assets and liabilities, disclosure of contingent<br />
assets and liabilities at the date of the financial<br />
statements, and the reported amounts of revenues and<br />
expenses during the reporting period. Actual results could<br />
differ from the estimates.<br />
Principles of Consolidation and Basis of Preparation<br />
Intercompany accounts and transactions have been eliminated.<br />
Certain investments in businesses that operate our<br />
Concepts are accounted for by the equity method. Generally,<br />
we possess 50% ownership of and 50% voting rights over<br />
these affiliates. Our lack of majority voting rights precludes<br />
us from controlling these affiliates, and thus we do not<br />
consolidate these affiliates. Our share of the net income or<br />
loss of those unconsolidated affiliates is included in other<br />
(income) expense.<br />
We participate in various advertising cooperatives with<br />
our franchisees and licensees. In certain of these cooperatives<br />
we possess majority voting rights, and thus control<br />
the cooperatives. As the contributions to the cooperatives<br />
are designated for advertising expenditures, any cash<br />
held by these cooperatives is considered restricted and<br />
is included in prepaid expenses and other current assets.<br />
Such restricted cash was approximately $34 million and<br />
$44 million at December 27, 2003 and December 28,<br />
2002, respectively. As the contributions to these cooperatives<br />
are designated and segregated for advertising, we<br />
act as an agent for the franchisees and licensees with<br />
regard to these contributions. Thus, in accordance with<br />
Statement of Financial Accounting Standards (“SFAS”)<br />
No. 45, “Accounting for Franchise Fee Revenue,” we do not<br />
reflect franchisee and licensee contributions to these cooperatives<br />
in our Consolidated Statements of Income.<br />
Fiscal Year<br />
Our fiscal year ends on the last Saturday in December<br />
and, as a result, a fifty-third week is added every five or six<br />
years. Fiscal year 2000 included 53 weeks. The Company’s<br />
next fiscal year with 53 weeks will be 2005. The first three<br />
quarters of each fiscal year consist of 12 weeks and the<br />
fourth quarter consists of 17 weeks in fiscal years with 53<br />
weeks and 16 weeks in fiscal years with 52 weeks. Our<br />
subsidiaries operate on similar fiscal calendars with period<br />
end dates suited to their businesses. The subsidiaries’<br />
period end dates are within one week of YUM’s period end<br />
date with the exception of our international businesses,<br />
which close one period or one month earlier to facilitate<br />
consolidated reporting.<br />
Reclassifications<br />
We have reclassified certain items in the accompanying<br />
Consolidated Financial Statements and Notes thereto for<br />
prior periods to be comparable with the classification for the<br />
fiscal year ended December 27, 2003. These reclassifications<br />
had no effect on previously reported net income.<br />
Franchise and License Operations<br />
We execute franchise or license agreements for each unit<br />
which sets out the terms of our arrangement with the<br />
franchisee or licensee. Our franchise and license agreements<br />
typically require the franchisee or licensee to pay<br />
an initial, non-refundable fee and continuing fees based<br />
upon a percentage of sales. Subject to our approval and<br />
payment of a renewal fee, a franchisee may generally renew<br />
the franchise agreement upon its expiration.<br />
We recognize initial fees as revenue when we have<br />
performed substantially all initial services required by the
franchise or license agreement, which is generally upon the<br />
opening of a store. We recognize continuing fees as earned.<br />
We recognize renewal fees in income when a renewal agreement<br />
becomes effective. We include initial fees collected<br />
upon the sale of a restaurant to a franchisee in refranchising<br />
gains (losses). Fees for development rights are capitalized<br />
and amortized over the life of the development agreement.<br />
We incur expenses that benefit both our franchise and<br />
license communities and their representative organizations<br />
and our company operated restaurants. These expenses,<br />
along with other costs of servicing of franchise and license<br />
agreements are charged to general and administrative<br />
expenses as incurred. Certain direct costs of our franchise<br />
and license operations are charged to franchise and<br />
license expenses. These costs include provisions for estimated<br />
uncollectible fees, franchise and license marketing<br />
funding, amortization expense for franchise related intangible<br />
assets and certain other direct incremental franchise<br />
and license support costs. Franchise and license expenses<br />
also includes rental income from subleasing restaurants to<br />
franchisees net of the related occupancy costs.<br />
We monitor the financial condition of our franchisees<br />
and licensees and record provisions for estimated losses<br />
on receivables when we believe that our franchisees or<br />
licensees are unable to make their required payments.<br />
While we use the best information available in making our<br />
determination, the ultimate recovery of recorded receivables<br />
is also dependent upon future economic events and other<br />
conditions that may be beyond our control. Included in<br />
franchise and license expense in 2003 is a net benefit for<br />
uncollectible franchise and license receivables of $3 million<br />
as we were able to recover previously reserved receivables<br />
in excess of provisions made. Net provisions for uncollectible<br />
franchise and license receivables of $15 million and<br />
$24 million were included in franchise and license expense<br />
in 2002 and 2001, respectively.<br />
Direct Marketing Costs<br />
We report substantially all of our direct marketing costs in<br />
occupancy and other operating expenses. We charge direct<br />
marketing costs to expense ratably in relation to revenues<br />
over the year in which incurred and, in the case of advertising<br />
production costs, in the year the advertisement is first<br />
shown. Deferred direct marketing costs, which are classified<br />
as prepaid expenses, consist of media and related advertising<br />
production costs which will generally be used for the<br />
first time in the next fiscal year. To the extent we participate<br />
in advertising cooperatives, we expense our contributions<br />
as incurred. At the end of 2003 and 2002, we had deferred<br />
marketing costs of $3 million and $8 million, respectively.<br />
Our advertising expenses were $419 million, $384 million<br />
and $328 million in 2003, 2002 and 2001, respectively.<br />
Research and Development Expenses<br />
Research and development expenses, which we expense as<br />
incurred, are reported in general and administrative expenses.<br />
Research and development expenses were $26 million in<br />
2003 and $23 million in both 2002 and 2001.<br />
<strong>Yum</strong>! Brands Inc. 53.<br />
Impairment or Disposal of Long-Lived Assets<br />
Effective December 30, 2001, the Company adopted<br />
SFAS No. 144, “Accounting for the Impairment or Disposal<br />
of Long-Lived Assets” (“SFAS 144”). SFAS 144 retained<br />
many of the fundamental provisions of SFAS No. 121,<br />
“Accounting for the Impairment of Long-Lived Assets and<br />
for Long-Lived Assets to Be Disposed Of” (“SFAS 121”), but<br />
resolved certain implementation issues associated with that<br />
Statement. The adoption of SFAS 144 did not have a material<br />
impact on the Consolidated Financial Statements.<br />
In accordance with SFAS 144, we review our long-lived<br />
assets related to each restaurant to be held and used in<br />
the business, including any allocated intangible assets<br />
subject to amortization, semi-annually for impairment, or<br />
whenever events or changes in circumstances indicate that<br />
the carrying amount of a restaurant may not be recoverable.<br />
We evaluate restaurants using a “two-year history<br />
of operating losses” as our primary indicator of potential<br />
impairment. Based on the best information available, we<br />
write down an impaired restaurant to its estimated fair<br />
market value, which becomes its new cost basis. We generally<br />
measure estimated fair market value by discounting<br />
estimated future cash flows. In addition, when we decide<br />
to close a restaurant it is reviewed for impairment and<br />
depreciable lives are adjusted. The impairment evaluation<br />
is based on the estimated cash flows from continuing<br />
use through the expected disposal date and the expected<br />
terminal value.<br />
The Company has adopted SFAS No. 146, “Accounting<br />
for Costs Associated with Exit or Disposal Activities”<br />
(“SFAS 146”), effective for exit or disposal activities that<br />
were initiated after December 31, 2002. Costs addressed<br />
by SFAS 146 include costs to terminate a contract that is<br />
not a capital lease, costs of involuntary employee termination<br />
benefits pursuant to a one-time benefit arrangement,<br />
costs to consolidate facilities and costs to relocate<br />
employees. SFAS 146 changes the timing of expense recognition<br />
for certain costs we incur while closing restaurants<br />
or undertaking other exit or disposal activities; however,<br />
the timing difference is not typically significant in length.<br />
Adoption of SFAS 146 did not have a material impact on<br />
our Consolidated Financial Statements for the year ended<br />
December 27, 2003.<br />
Store closure costs include costs of disposing of the<br />
assets as well as other facility-related expenses from previously<br />
closed stores. These store closure costs are generally<br />
expensed as incurred. Additionally, at the date we cease<br />
using a property under an operating lease, we record a<br />
liability for the net present value of any remaining lease<br />
obligations, net of estimated sublease income, if any.<br />
Refranchising gains (losses) includes the gains or<br />
losses from the sales of our restaurants to new and existing<br />
franchisees and the related initial franchise fees, reduced by<br />
transaction costs and direct administrative costs of refranchising.<br />
In executing our refranchising initiatives, we most<br />
often offer groups of restaurants. We classify restaurants
54.<br />
as held for sale and suspend depreciation and amortization<br />
when (a) we make a decision to refranchise; (b) the stores<br />
can be immediately removed from operations; (c) we have<br />
begun an active program to locate a buyer; (d) significant<br />
changes to the plan of sale are not likely; and (e) the sale<br />
is probable within one year. We recognize estimated losses<br />
on refranchisings when the restaurants are classified as<br />
held for sale. We recognize gains on restaurant refranchisings<br />
when the sale transaction closes, the franchisee has a<br />
minimum amount of the purchase price in at-risk equity, and<br />
we are satisfied that the franchisee can meet its financial<br />
obligations. If the criteria for gain recognition are not met,<br />
we defer the gain to the extent we have a remaining financial<br />
exposure in connection with the sales transaction. Deferred<br />
gains are recognized when the gain recognition criteria are<br />
met or as our financial exposure is reduced. When we<br />
make a decision to retain a store previously held for sale,<br />
we revalue the store at the lower of its (a) net book value<br />
at our original sale decision date less normal depreciation<br />
and amortization that would have been recorded during the<br />
period held for sale or (b) its current fair market value. This<br />
value becomes the store’s new cost basis. We charge (or<br />
credit) any difference between the store’s carrying amount<br />
and its new cost basis to refranchising gains (losses).<br />
When we make a decision to close a store previously held<br />
for sale, we reverse any previously recognized refranchising<br />
loss and then record impairment and store closure costs as<br />
described above. Refranchising gains (losses) also include<br />
charges for estimated exposures related to those partial<br />
guarantees of franchisee loan pools and contingent lease<br />
liabilities which arose from refranchising activities. These<br />
exposures are more fully discussed in Note 24.<br />
SFAS 144 also requires the results of operations of a<br />
component entity that is classified as held for sale or has<br />
been disposed of be reported as discontinued operations<br />
in the Consolidated Statements of Income if certain conditions<br />
are met. These conditions include elimination of the<br />
operations and cash flows of the component entity from<br />
the ongoing operations of the Company and no significant<br />
continuing involvement by the Company in the operations<br />
of the component entity after the disposal transaction. The<br />
results of operations of stores meeting both these conditions<br />
that were disposed of in 2003 or 2002 or classified<br />
as held for sale at December 27, 2003 or December 28,<br />
2002 were not material for any of the three years ended<br />
December 27, 2003.<br />
Considerable management judgment is necessary<br />
to estimate future cash flows, including cash flows from<br />
continuing use, terminal value, closure costs, sublease<br />
income, and refranchising proceeds. Accordingly, actual<br />
results could vary significantly from our estimates.<br />
Impairment of Investments in Unconsolidated Affiliates<br />
We record impairment charges related to an investment<br />
in an unconsolidated affiliate whenever events or<br />
circumstances indicate that a decrease in the value of an<br />
investment has occurred which is other than temporary. In<br />
addition, we evaluate our investments in unconsolidated<br />
affiliates for impairment when they have experienced two<br />
consecutive years of operating losses. Our impairment<br />
measurement test for an investment in an unconsolidated<br />
affiliate is similar to that for our restaurants except that we<br />
use discounted cash flows after interest and taxes instead<br />
of discounted cash flows before interest and taxes as used<br />
for our restaurants.<br />
Considerable management judgment is necessary to<br />
estimate future cash flows. Accordingly, actual results could<br />
vary significantly from our estimates.<br />
Asset Retirement Obligations<br />
Effective December 29, 2002, the Company adopted<br />
SFAS No. 143, “Accounting for Asset Retirement<br />
Obligations” (“SFAS 143”). SFAS 143 addresses the<br />
financial accounting and reporting for legal obligations<br />
associated with the retirement of tangible long-lived assets<br />
and the associated asset retirement costs. As a result of<br />
obligations under certain leases that are within the scope<br />
of SFAS 143, the Company recorded a cumulative effect<br />
adjustment of $2 million ($1 million after tax) which did<br />
not have a material effect on diluted earnings per common<br />
share. The adoption of SFAS 143 also did not have a material<br />
impact on our Consolidated Financial Statements for<br />
the year ended December 27, 2003. If SFAS 143 had been<br />
adopted as of the beginning of 2002 or 2001, the cumulative<br />
effect adjustment would not have been materially<br />
different from that recorded on December 29, 2002.<br />
Financial Instruments with Characteristics of both<br />
Liabilities and Equity<br />
The Company has adopted SFAS No. 150, “Accounting for<br />
Certain Financial Instruments with Characteristics of both<br />
Liabilities and Equity” (“SFAS 150”). SFAS 150 establishes<br />
standards for how an issuer classifies and measures three<br />
classes of freestanding financial instruments with characteristics<br />
of both liabilities and equity. It requires that an<br />
issuer classify a financial instrument that is within its scope<br />
as a liability (or an asset in some circumstances). SFAS 150<br />
was effective for financial instruments entered into or modified<br />
after May 31, 2003, and otherwise was effective at the<br />
beginning of the first interim period beginning after June 15,<br />
2003. The Company has not entered into or modified any<br />
financial instruments within the scope of SFAS 150 since<br />
May 31, 2003, nor does it currently hold any significant<br />
financial instruments within its scope.<br />
Guarantees<br />
The Company has adopted Financial Accounting Standards<br />
Board (“FASB”) Interpretation No. 45, “Guarantor’s<br />
Accounting and Disclosure Requirements for Guarantees,<br />
Including Indirect Guarantees of Indebtedness to Others, an<br />
interpretation of FASB Statements No. 5, 57 and 107 and a
escission of FASB Interpretation No. 34” (“FIN 45”). FIN 45<br />
elaborates on the disclosures to be made by a guarantor<br />
in its interim and annual financial statements about its<br />
obligations under guarantees issued. FIN 45 also clarifies<br />
that a guarantor is required to recognize, at inception of<br />
a guarantee, a liability for the fair value of certain obligations<br />
undertaken. The initial recognition and measurement<br />
provisions were applicable to certain guarantees issued<br />
or modified after December 31, 2002. While the nature of<br />
our business results in the issuance of certain guarantees<br />
from time to time, the adoption of FIN 45 did not have a<br />
material impact on our Consolidated Financial Statements<br />
for the year ended December 27, 2003.<br />
We have also issued guarantees as a result of<br />
assigning our interest in obligations under operating leases<br />
as a condition to the refranchising of certain Company<br />
restaurants. Such guarantees are subject to the requirements<br />
of SFAS No. 145, “Rescission of FASB Statements<br />
No. 4, 44, and 64, Amendment of FASB Statement No. 13,<br />
and Technical Corrections” (“SFAS 145”). We recognize a<br />
liability for the fair value of such lease guarantees under<br />
SFAS 145 at their inception, with the related expense being<br />
included in refranchising gains (losses).<br />
Cash and Cash Equivalents<br />
Cash equivalents represent funds we have temporarily<br />
invested (with original maturities not exceeding three<br />
months) as part of managing our day-to-day operating cash<br />
receipts and disbursements.<br />
Inventories<br />
We value our inventories at the lower of cost (computed on<br />
the first-in, first-out method) or net realizable value.<br />
Property, Plant and Equipment<br />
We state property, plant and equipment at cost less<br />
accumulated depreciation and amortization, impairment<br />
writedowns and valuation allowances. We calculate depreciation<br />
and amortization on a straight-line basis over the<br />
estimated useful lives of the assets as follows: 5 to 25<br />
years for buildings and improvements, 3 to 20 years for<br />
machinery and equipment and 3 to 7 years for capitalized<br />
software costs. As discussed above, we suspend depreciation<br />
and amortization on assets related to restaurants that<br />
are held for sale.<br />
Internal Development Costs and Abandoned Site Costs<br />
We capitalize direct costs associated with the site acquisition<br />
and construction of a Company unit on that site,<br />
including direct internal payroll and payroll-related costs.<br />
Only those site-specific costs incurred subsequent to the<br />
time that the site acquisition is considered probable are<br />
capitalized. If we subsequently make a determination that<br />
a site for which internal development costs have been capitalized<br />
will not be acquired or developed, any previously<br />
capitalized internal development costs are expensed and<br />
included in general and administrative expenses.<br />
<strong>Yum</strong>! Brands Inc. 55.<br />
Goodwill and Intangible Assets<br />
The Company has adopted SFAS No. 141, “Business<br />
Combinations” (“SFAS 141”). SFAS 141 requires the use<br />
of the purchase method of accounting for all business<br />
combinations and modifies the application of the purchase<br />
accounting method. Goodwill represents the excess of the<br />
cost of a business acquired over the net of the amounts<br />
assigned to assets acquired, including identifiable intangible<br />
assets, and liabilities assumed. SFAS 141 specifies<br />
criteria to be used in determining whether intangible assets<br />
acquired in a business combination must be recognized<br />
and reported separately from goodwill. We base amounts<br />
assigned to goodwill and other identifiable intangible assets<br />
on independent appraisals or internal estimates.<br />
The Company has also adopted SFAS No. 142,<br />
“Goodwill and Other Intangible Assets” (“SFAS 142”).<br />
SFAS 142 eliminates the requirement to amortize goodwill<br />
and indefinite-lived intangible assets, addresses the<br />
amortization of intangible assets with a defined life, and<br />
addresses impairment testing and recognition for goodwill<br />
and indefinite-lived intangible assets. As a result of adopting<br />
SFAS 142, we ceased amortization of goodwill and indefinitelived<br />
intangible assets beginning December 30, 2001. Prior<br />
to the adoption of SFAS 142, we amortized goodwill on a<br />
straight-line basis up to 20 years and indefinite-lived intangible<br />
assets on a straight-line basis over 3 to 40 years. We<br />
evaluate the remaining useful life of an intangible asset that<br />
is not being amortized each reporting period to determine<br />
whether events and circumstances continue to support an<br />
indefinite useful life. If an intangible asset that is not being<br />
amortized is subsequently determined to have a finite useful<br />
life, we amortize the intangible asset prospectively over its<br />
estimated remaining useful life. Amortizable intangible<br />
assets continue to be amortized on a straight-line basis<br />
over 3 to 40 years. As discussed above, we suspend amortization<br />
on those intangible assets with a defined life that<br />
are allocated to restaurants that are held for sale.<br />
In accordance with the requirements of SFAS 142,<br />
goodwill has been assigned to reporting units for<br />
purposes of impairment testing. Our reporting units are<br />
our operating segments in the U.S. (see Note 23) and<br />
our business management units internationally (typically<br />
individual countries). Goodwill impairment tests consist<br />
of a comparison of each reporting unit’s fair value with<br />
its carrying value. The fair value of a reporting unit is the<br />
amount for which the unit as a whole could be sold in a<br />
current transaction between willing parties. We generally<br />
estimate fair value based on discounted cash flows. If the<br />
carrying value of a reporting unit exceeds its fair value,<br />
goodwill is written down to its implied fair value. We have<br />
selected the beginning of our fourth quarter as the date<br />
on which to perform our ongoing annual impairment test<br />
for goodwill. For 2003, there was no impairment of goodwill<br />
identified during our annual impairment testing. For 2002,<br />
goodwill assigned to the Pizza Hut France reporting unit was
56.<br />
deemed impaired and written off. The charge of $5 million<br />
was recorded in facility actions.<br />
For indefinite-lived intangible assets, our impairment<br />
test consists of a comparison of the fair value of an intangible<br />
asset with its carrying amount. Fair value is the price a<br />
willing buyer would pay for the intangible asset and is generally<br />
estimated by discounting the expected future cash flows<br />
associated with the intangible asset. We also perform our<br />
annual test for impairment of our indefinite-lived intangible<br />
assets at the beginning of our fourth quarter. Our indefinitelived<br />
intangible assets consist of values assigned to certain<br />
trademarks/brands we have acquired. When determining<br />
the fair value, we limit assumptions about important factors<br />
such as sales growth to those that are supportable based<br />
on our plans for the trademark/brand. As discussed in<br />
Note 12, we recorded a $5 million charge in 2003 as a<br />
result of the impairment of an indefinite-lived intangible<br />
asset. This charge was recorded in facility actions.<br />
See Note 12 for further discussion of SFAS 142.<br />
Stock-Based Employee Compensation<br />
At December 27, 2003, the Company had four stockbased<br />
employee compensation plans in effect, which are<br />
described more fully in Note 18. The Company accounts<br />
for those plans under the recognition and measurement<br />
principles of Accounting Principles Board Opinion No. 25,<br />
“Accounting for Stock Issued to Employees,” and related<br />
Interpretations. No stock-based employee compensation<br />
cost is reflected in net income, as all options granted under<br />
those plans had an exercise price equal to the market value<br />
of the underlying common stock on the date of grant. The<br />
following table illustrates the effect on net income and<br />
earnings per share if the Company had applied the fair<br />
value recognition provisions of SFAS No. 123 “Accounting<br />
for Stock-Based Compensation,” to stock-based employee<br />
compensation.<br />
2003 2002 2001<br />
Net Income, as reported<br />
Deduct: Total stock-based employee<br />
compensation expense determined<br />
under fair value based method for<br />
$ 617 $ 583 $ 492<br />
all awards, net of related tax effects (36) (39) (37)<br />
Net income, pro forma<br />
Basic Earnings per Common Share<br />
581 544 455<br />
As reported $ 2.10 $ 1.97 $ 1.68<br />
Pro forma<br />
Diluted Earnings per Common Share<br />
1.98 1.84 1.55<br />
As reported $ 2.02 $ 1.88 $ 1.62<br />
Pro forma 1.91 1.76 1.50<br />
Derivative Financial Instruments<br />
Our policy prohibits the use of derivative instruments for<br />
trading purposes, and we have procedures in place to<br />
monitor and control their use. Our use of derivative instruments<br />
has included interest rate swaps and collars, treasury<br />
locks and foreign currency forward contracts. In addition, on<br />
a limited basis we utilize commodity futures and options<br />
contracts. Our interest rate and foreign currency derivative<br />
contracts are entered into with financial institutions while<br />
our commodity derivative contracts are exchange traded.<br />
We account for derivative financial instruments in<br />
accordance with SFAS No. 133, “Accounting for Derivative<br />
Instruments and Hedging Activities” (“SFAS 133”) as<br />
amended by SFAS No. 149, “Amendment of Statement 133<br />
on Derivative Instruments and Hedging Activities<br />
(“SFAS 149”). SFAS 133 requires that all derivative instruments<br />
be recorded on the Consolidated Balance Sheet at<br />
fair value. The accounting for changes in the fair value (i.e.,<br />
gains or losses) of a derivative instrument is dependent upon<br />
whether the derivative has been designated and qualifies<br />
as part of a hedging relationship and further, on the type<br />
of hedging relationship. For derivative instruments that are<br />
designated and qualify as a fair value hedge, the gain or<br />
loss on the derivative instrument as well as the offsetting<br />
gain or loss on the hedged item attributable to the hedged<br />
risk are recognized in the results of operations. For derivative<br />
instruments that are designated and qualify as a cash<br />
flow hedge, the effective portion of the gain or loss on the<br />
derivative instrument is reported as a component of other<br />
comprehensive income (loss) and reclassified into earnings<br />
in the same period or periods during which the hedged transaction<br />
affects earnings. Any ineffective portion of the gain or<br />
loss on the derivative instrument is recorded in the results of<br />
operations immediately. For derivative instruments not designated<br />
as hedging instruments, the gain or loss is recognized<br />
in the results of operations immediately. See Note 16 for a<br />
discussion of our use of derivative instruments, management<br />
of credit risk inherent in derivative instruments and fair value<br />
information related to debt and interest rate swaps.<br />
New Accounting Pronouncements Not Yet Adopted<br />
In January 2003, the FASB issued Interpretation No. 46,<br />
“Consolidation of Variable Interest Entities, an interpretation<br />
of ARB No. 51” (“FIN 46”). FIN 46 was subsequently revised<br />
in December 2003. FIN 46 addresses the consolidation of<br />
entities whose equity holders have either (a) not provided<br />
sufficient equity at risk to allow the entity to finance its own<br />
activities or (b) do not possess certain characteristics of a<br />
controlling financial interest. FIN 46 requires the consolidation<br />
of these entities, known as variable interest entities<br />
(“VIEs”), by the primary beneficiary of the entity. The primary<br />
beneficiary is the entity, if any, that is subject to a majority of<br />
the risk of loss from the VIE’s activities, entitled to receive<br />
a majority of the VIEs residual returns, or both. FIN 46 is<br />
effective for all entities at the end of the first reporting period<br />
ending after March 15, 2004 (the quarter ending March 20,<br />
2004 for the Company). FIN 46 was effective for specialpurpose<br />
entities (as defined by FIN 46) at the end of the first<br />
reporting period ending after December 15, 2003, which did<br />
not impact the Consolidated Financial Statements. FIN 46<br />
requires certain disclosures in financial statements issued<br />
after December 31, 2003, if it is reasonably possible that<br />
the Company will consolidate or disclose information about<br />
VIEs when FIN 46 becomes effective.
FIN 46 excludes from its scope businesses (as defined<br />
by FIN 46) unless certain conditions exist. We believe the<br />
franchise entities which operate our restaurants, including<br />
our Unconsolidated Affiliates, meet the definition of a business.<br />
Thus, we are currently evaluating whether any of the<br />
aforementioned conditions exist that would subject any of<br />
our franchisees, including our Unconsolidated Affiliates, to<br />
the provisions of FIN 46, requiring us to determine if they<br />
are VIEs, and, if so, whether we are the primary beneficiary.<br />
We do not possess any ownership interests in our franchisees<br />
except for our investments in various Unconsolidated<br />
Affiliates accounted for under the equity method (see<br />
Note 24 for further description). Additionally, we generally<br />
do not provide financial support to our franchisees in a<br />
typical franchise relationship. While we continue to evaluate<br />
the applicability of FIN 46 to our franchise relationships, at<br />
this time we do not believe that the required consolidation<br />
of franchise entities, if any, would materially impact our<br />
Financial Statements.<br />
The Company, along with representatives of the<br />
franchisee groups of each of its Concepts, has formed<br />
purchasing cooperatives for the purpose of purchasing<br />
certain restaurant products and equipment in the U.S. Our<br />
equity ownership in each cooperative is generally proportional<br />
to our percentage ownership of the U.S. system units<br />
for the Concept. We are continuing to evaluate whether<br />
any of these cooperatives are VIEs under the provisions<br />
of FIN 46 and, if so, whether we are the primary beneficiary.<br />
We do not currently believe that consolidation will be<br />
required for these cooperatives as a result of our adoption<br />
of FIN 46.<br />
As discussed further in Note 24, we have posted a<br />
$12 million of letter of credit supporting our guarantee<br />
of a franchisee loan pool. Additionally, we have provided<br />
a standby letter of credit of $23 million under which we<br />
could potentially be required to fund a portion of this loan<br />
pool. The letters of credit were issued under our existing<br />
bank credit agreement. This loan pool, which is not held<br />
or funded by an affiliate of the Company, primarily funded<br />
purchases of restaurants from the Company and, to a lesser<br />
extent, franchisee development of new restaurants. The<br />
total loans outstanding under this loan pool were approximately<br />
$87 million at December 27, 2003. Our maximum<br />
exposure to loss as a result of our involvement with this<br />
loan pool was $28 million at December 27, 2003. During<br />
the year ended December 27, 2003 the entity which holds<br />
this loan pool sold these loans to a qualifying specialpurpose<br />
entity (“QSPE”) as described in SFAS No. 140,<br />
“Accounting for Transfers and Servicing of Financial Assets<br />
and Extinguishments of Liabilities” and settled its existing<br />
obligations with the proceeds. As QSPEs are not within<br />
the scope of FIN 46, the Company will not be required to<br />
consolidate the entity that now holds this loan pool.<br />
note 3<br />
TWO-FOR-ONE COMMON STOCK SPLIT<br />
<strong>Yum</strong>! Brands Inc. 57.<br />
On May 7, 2002, the Company announced that its Board<br />
of Directors approved a two-for-one split of the Company’s<br />
outstanding shares of Common Stock. The stock split was<br />
effected in the form of a stock dividend and entitled each<br />
shareholder of record at the close of business on June 6,<br />
2002 to receive one additional share for every outstanding<br />
share of Common Stock held on the record date. The stock<br />
dividend was distributed on June 17, 2002, with approximately<br />
149 million shares of common stock distributed.<br />
All per share and share amounts in the accompanying<br />
Consolidated Financial Statements and Notes to the<br />
Financial Statements have been adjusted to reflect the<br />
stock split.<br />
note 4<br />
YGR ACQUISITION<br />
On May 7, 2002, YUM completed its acquisition of YGR.<br />
At the date of acquisition, YGR consisted of 742 and 496<br />
company and franchise LJS units, respectively, and 127<br />
and 742 company and franchise A&W units, respectively.<br />
In addition, 133 multibranded LJS/A&W restaurants were<br />
included in the LJS unit totals. This acquisition was made<br />
to facilitate our strategic objective of achieving growth<br />
through multibranding, where two or more of our Concepts<br />
are operated in a single restaurant unit. We paid approximately<br />
$275 million in cash and assumed approximately<br />
$48 million of bank indebtedness in connection with the<br />
acquisition of YGR. The purchase price was allocated to<br />
the assets acquired and liabilities assumed based on estimates<br />
of their fair values at the date of acquisition. We<br />
determined these fair values with the assistance of a third<br />
party valuation expert. The following table summarizes the<br />
fair values of YGR’s assets acquired and liabilities assumed<br />
at the date of acquisition.<br />
Current assets $ 35<br />
Property, plant and equipment 58<br />
Intangible assets 250<br />
Goodwill 209<br />
Other assets 85<br />
Total assets acquired 637<br />
Current liabilities 100<br />
Long-term debt, including current portion<br />
Future rent obligations related to<br />
59<br />
sale-leaseback agreements 168<br />
Other long-term liabilities 35<br />
Total liabilities assumed 362<br />
Net assets acquired (net cash paid) $ 275<br />
Of the $250 million in acquired intangible assets,<br />
$212 million was assigned to trademarks/brands. The<br />
remaining acquired intangible assets primarily consist
58.<br />
of franchise contract rights which will be amortized over<br />
thirty years, the typical term of a YGR franchise agreement<br />
including renewals. Of the $212 million in trademarks/<br />
brands approximately $191 million and $21 million<br />
were assigned to the U.S. and International operating<br />
segments, respectively. Of the remaining $38 million<br />
in intangible assets, approximately $31 million and<br />
$7 million were assigned to the U.S. and International<br />
operating segments, respectively.<br />
The $209 million in goodwill was assigned to the<br />
U.S. operating segment. As we acquired the stock of<br />
YGR, none of the goodwill is expected to be deductible<br />
for income tax purposes.<br />
Liabilities assumed included approximately $48 million<br />
of bank indebtedness that was paid off prior to the<br />
end of the second quarter of 2002 and approximately<br />
$11 million in capital lease obligations. We also assumed<br />
approximately $168 million in present value of future rent<br />
obligations related to three existing sale-leaseback agreements<br />
entered into by YGR involving approximately 350<br />
LJS units. As a result of liens held by the buyer/lessor on<br />
certain personal property within the units, the sale-leaseback<br />
agreements were accounted for as financings upon<br />
acquisition. As discussed further in Note 14, two of these<br />
sale-leaseback agreements were amended during 2003 and<br />
are now being accounted for as operating leases.<br />
As of the date of acquisition we recorded approximately<br />
$49 million of reserves (“exit liabilities”) related<br />
to our plans to consolidate certain support functions,<br />
and exit certain markets through store refranchisings and<br />
closures, as presented in the table below. The consolidation<br />
of certain support functions included the termination of<br />
approximately 100 employees. Our remaining exit liabilities,<br />
as well as amounts utilized through cash payments during<br />
2003 and 2002, are presented below.<br />
Severance<br />
Lease and<br />
Other<br />
Contract Other<br />
Benefits Terminations Costs Total<br />
Total reserve at<br />
acquisition $ 13 $ 31 $ 5 $ 49<br />
Amounts utilized in 2003 (5) (5) (3) (13)<br />
Amounts utilized in 2002<br />
Total reserve as of<br />
(8) — (1) (9)<br />
December 27, 2003 $ — $ 26 $ 1 $ 27<br />
We expensed integration costs of approximately $4 million<br />
in 2003 and $6 million in 2002 related to the acquisition.<br />
These costs were recorded as AmeriServe and<br />
other charges (credits). See Note 7 for further discussion<br />
regarding AmeriServe and other charges (credits).<br />
The results of operations for YGR have been included<br />
in our Consolidated Financial Statements since the date<br />
of acquisition. If the acquisition had been completed as of<br />
the beginning of the years ended December 28, 2002 and<br />
December 29, 2001, pro forma Company sales and franchise<br />
and license fees would have been as follows:<br />
2002 2001<br />
Company sales $ 7,139 $ 6,683<br />
Franchise and license fees 877 839<br />
The impact of the acquisition, including interest expense on<br />
debt incurred to finance the acquisition, on net income and<br />
diluted earnings per share would not have been significant in<br />
2002 and 2001. The pro forma information is not necessarily<br />
indicative of the results of operations had the acquisition<br />
actually occurred at the beginning of each of these periods<br />
nor is it necessarily indicative of future results.<br />
note 5<br />
ACCUMULATED OTHER COMPREHENSIVE INCOME<br />
(LOSS)<br />
Accumulated other comprehensive income (loss) includes:<br />
2003 2002<br />
Foreign currency translation adjustment $ (107) $ (176)<br />
Minimum pension liability adjustment, net of tax<br />
Unrealized losses on derivative instruments,<br />
(101) (71)<br />
net of tax (2) (2)<br />
Total accumulated other comprehensive income<br />
(loss) $ (210) $ (249)<br />
note 6<br />
EARNINGS PER COMMON SHARE (“EPS”)<br />
2003 2002 2001<br />
Net income $ 617 $ 583 $ 492<br />
Basic EPS:<br />
Weighted-average common shares<br />
outstanding 293 296 293<br />
Basic EPS $ 2.10 $ 1.97 $ 1.68<br />
Diluted EPS:<br />
Weighted-average common shares<br />
outstanding<br />
Shares assumed issued on exercise<br />
293 296 293<br />
of dilutive share equivalents<br />
Shares assumed purchased with<br />
proceeds of dilutive<br />
52 56 55<br />
share equivalents (39) (42) (44)<br />
Shares applicable to diluted earnings 306 310 304<br />
Diluted EPS $ 2.02 $ 1.88 $ 1.62<br />
Unexercised employee stock options to purchase approximately<br />
4 million, 1.4 million and 5.1 million shares of our<br />
Common Stock for the years ended December 27, 2003,<br />
December 28, 2002 and December 29, 2001, respectively,<br />
were not included in the computation of diluted EPS<br />
because their exercise prices were greater than the average<br />
market price of our Common Stock during the year.
note 7<br />
ITEMS AFFECTING COMPARABILITY OF NET INCOME<br />
Facility Actions<br />
Facility actions consists of the following components:<br />
Refranchising net (gains) losses;<br />
Store closure costs;<br />
Impairment of long-lived assets for stores we intend to<br />
close and stores we intend to continue to use in the<br />
business;<br />
Impairment of goodwill and indefinite-lived intangible<br />
assets subsequent to the adoption of SFAS 142.<br />
2003 2002 2001<br />
U.S.<br />
Refranchising net (gains) losses (a) (b) $ (20) $ (4) $ (44)<br />
Store closure costs 1 8 13<br />
Store impairment charges 10 15 14<br />
SFAS 142 impairment charges (c) 5 — —<br />
Facility actions<br />
International<br />
(4) 19 (17)<br />
Refranchising net (gains) losses (a) (b) 16 (15) 5<br />
Store closure costs 5 7 4<br />
Store impairment charges 19 16 9<br />
SFAS 142 impairment charges (c) — 5 —<br />
Facility actions<br />
Worldwide<br />
40 13 18<br />
Refranchising net (gains) losses (a) (b) (4) (19) (39)<br />
Store closure costs 6 15 17<br />
Store impairment charges 29 31 23<br />
SFAS 142 impairment charges (c) 5 5 —<br />
Facility actions $ 36 $ 32 $ 1<br />
(a) Includes initial franchise fees in the U.S. of $3 million in 2003, $1 million<br />
in 2002 and $4 million in 2001 and in International of $2 million in 2003,<br />
$5 million in 2002 and $3 million in 2001. See Note 9.<br />
(b) In 2001, U.S. refranchising net (gains) losses included $12 million of previously<br />
deferred refranchising gains and International refranchising net (gains) losses<br />
included a charge of $11 million to mark to market the net assets of the<br />
Singapore business, which was held for sale. The Singapore business was<br />
subsequently sold during the third quarter of 2002. In 2003, International<br />
refranchising net (gains) losses included a charge of approximately $16 million<br />
to write down the carrying value of the Puerto Rican business to fair value.<br />
(c) In 2003, we recorded a $5 million charge in the U.S. related to the impairment<br />
of the A&W trademark/brand (see further discussion at Note 12). In 2002, we<br />
recorded a $5 million charge in International related to the impairment of the<br />
goodwill of the Pizza Hut France reporting unit.<br />
The following table summarizes the 2003 and 2002 activity<br />
related to reserves for remaining lease obligations for<br />
stores closed or stores we intend to close.<br />
Beginning Amounts<br />
Estimate/<br />
New Decision Ending<br />
Balance Used Decisions Changes Other Balance<br />
2002 Activity $ 48 (17) 16 3 1 $ 51<br />
2003 Activity $ 51 (27) 11 2 3 $ 40<br />
The following table summarizes the carrying values of the<br />
major classes of assets held for sale at December 27, 2003<br />
and December 28, 2002. U.S. amounts primarily represent<br />
land on which we previously operated restaurants and are<br />
net of impairment charges of $2 million and $4 million at<br />
December 27, 2003 and December 28, 2002, respectively.<br />
The carrying values in International relate primarily to our<br />
<strong>Yum</strong>! Brands Inc. 59.<br />
Puerto Rican business, which we wrote down $16 million<br />
during 2003 to reflect then current estimates of its fair value.<br />
These write-downs were recorded as a refranchising loss. The<br />
carrying values of liabilities of the Puerto Rican business that<br />
we anticipate will be assumed by a buyer were not significant<br />
at December 27, 2003 or at December 28, 2002.<br />
December 27, 2003<br />
Inter-<br />
U.S. national Worldwide<br />
Property, plant and equipment, net $ 9 $ 73 $ 82<br />
Goodwill — 12 12<br />
Other assets — 2 2<br />
Assets classified as held for sale $ 9 $ 87 $ 96<br />
December 28, 2002<br />
Inter-<br />
U.S. national Worldwide<br />
Property, plant and equipment, net $ 7 $ 89 $ 96<br />
Goodwill — 13 13<br />
Other assets — 2 2<br />
Assets classified as held for sale $ 7 $ 104 $ 111<br />
The following table summarizes Company sales and restaurant<br />
profit related to stores held for sale at December 27,<br />
2003, or disposed of through refranchising or closure during<br />
2003, 2002 and 2001. Stores disposed of through closure<br />
include certain stores we have relocated within the same<br />
trade area. The operations of such stores classified as held<br />
for sale as of December 27, 2003 or December 28, 2002<br />
or disposed of in 2003 or 2002, which meet the conditions<br />
of SFAS 144 for reporting as discontinued operations were<br />
not material. Restaurant profit represents Company sales<br />
less the cost of food and paper, payroll and employee<br />
benefits and occupancy and other operating expenses.<br />
2003 2002 2001<br />
Stores held for sale at<br />
December 27, 2003:<br />
Sales $ 187 $ 189 $ 184<br />
Restaurant profit<br />
Stores disposed of in<br />
2003, 2002 and 2001:<br />
34 28 23<br />
Sales $ 158 $ 324 $ 640<br />
Restaurant profit 14 37 67<br />
Restaurant profit on stores held for sale includes a benefit<br />
from the suspension of depreciation and amortization of<br />
approximately $13 million and $4 million in 2003 and<br />
2002, respectively.<br />
Wrench Litigation<br />
Expense of $42 million for 2003 reflects the legal judgment<br />
against Taco Bell Corp. on June 4, 2003 in Wrench<br />
v. Taco Bell Corp. and related interest. See Note 24 for a<br />
discussion of Wrench litigation.<br />
AmeriServe and Other Charges (Credits)<br />
AmeriServe Food Distribution Inc. (“AmeriServe”) was the<br />
primary distributor of food and paper supplies to our U.S.
60.<br />
stores when it filed for protection under Chapter 11 of the<br />
U.S. Bankruptcy Code on January 31, 2000. A plan of reorganization<br />
for AmeriServe (the “POR”) was approved on<br />
November 28, 2000, which resulted in, among other things,<br />
the assumption of our distribution agreement, subject to<br />
certain amendments, by McLane Company, Inc. During the<br />
AmeriServe bankruptcy reorganization process, we took<br />
a number of actions to ensure continued supply to our<br />
system. Those actions resulted in significant expense for<br />
the Company, primarily recorded in 2000. Under the POR we<br />
are entitled to proceeds from certain residual assets, preference<br />
claims and other legal recoveries of the estate.<br />
We classify expenses and recoveries related to<br />
AmeriServe, as well as integration costs related to our<br />
acquisition of YGR, costs to defend certain wage and<br />
hour litigation and certain other items, as AmeriServe and<br />
other charges (credits). These amounts were classified as<br />
unusual items in previous years.<br />
Income of $26 million was recorded as AmeriServe<br />
and other charges (credits) for 2003 and primarily includes<br />
recoveries related to the AmeriServe bankruptcy reorganization<br />
process. Income of $27 million was recorded as<br />
AmeriServe and other charges (credits) for 2002, primarily<br />
resulting from recoveries related to the AmeriServe bankruptcy<br />
reorganization process, partially offset by integration<br />
costs related to our acquisition of YGR and costs to defend<br />
certain wage and hour litigation. Income of $3 million was<br />
recorded as AmeriServe and other charges (credits) for<br />
2001, which primarily included recoveries related to the<br />
AmeriServe bankruptcy reorganization process offset<br />
by aggregate settlement costs associated with certain<br />
litigation, and expenses, primarily severance, related to<br />
decisions to streamline certain support functions. The<br />
reserves related to decisions to streamline certain support<br />
functions were utilized in 2002.<br />
note 8<br />
SUPPLEMENTAL CASH FLOW DATA<br />
2003 2002 2001<br />
Cash Paid for:<br />
Interest $ 178 $ 153 $ 164<br />
Income taxes<br />
Significant Non-Cash Investing and<br />
Financing Activities:<br />
Assumption of debt and capital leases<br />
196 200 264<br />
related to the acquisition of YGR<br />
Capital lease obligations incurred to<br />
$ — $ 227 $ —<br />
acquire assets<br />
Contribution of non-cash net assets<br />
9 23 18<br />
to an unconsolidated affiliate<br />
Assumption of liabilities in connection<br />
— — 21<br />
with a franchise acquisition — — 36<br />
Fair market value of assets received in<br />
connection with a non-cash acquisition —<br />
Debt reduction due to amendment of<br />
sale-lease back agreements<br />
— 9<br />
(See Note 14) 88 — —<br />
On November 10, 2003 our unconsolidated affiliate in<br />
Canada was dissolved. Upon dissolution, the Company<br />
assumed operation of certain units that were previously<br />
operated by the unconsolidated affiliate. The Company also<br />
assumed ownership of the assets related to the units that<br />
it now operates, as well as the real estate associated with<br />
certain units previously owned and operated by the unconsolidated<br />
affiliate that are not operated by franchisees<br />
(either our former partner in the unconsolidated affiliate<br />
or a publicly-held Income Trust in Canada). The acquired<br />
real estate associated with the units that are not operated<br />
by the Company is being leased to the franchisees. The<br />
resulting reduction in our investments in unconsolidated<br />
affiliates ($56 million at November 10, 2003) was primarily<br />
offset by increases in property, plant and equipment, net<br />
and capital lease receivables (included in other assets). The<br />
Company realized an immaterial gain upon the dissolution<br />
of the unconsolidated affiliate. This gain was realized as the<br />
fair value of our increased ownership in the assets received<br />
was greater than our carrying value in these assets, and<br />
was net of expenses associated with the dissolution.<br />
note 9<br />
FRANCHISE AND LICENSE FEES<br />
2003 2002 2001<br />
Initial fees, including renewal fees<br />
Initial franchise fees included in<br />
$ 36 $ 33 $ 32<br />
refranchising gains (5) (6) (7)<br />
31 27 25<br />
Continuing fees 908 839 790<br />
$ 939 $ 866 $ 815<br />
note 10<br />
OTHER (INCOME) EXPENSE<br />
2003 2002 2001<br />
Equity income from investments in<br />
unconsolidated affiliates $ (39) $ (29) $ (26)<br />
Foreign exchange net (gain) loss (2) (1) 3<br />
$ (41) $ (30) $ (23)<br />
note 11<br />
PROPERTY, PLANT AND EQUIPMENT, NET<br />
2003 2002<br />
Land $ 662 $ 621<br />
Buildings and improvements 2,861 2,742<br />
Capital leases, primarily buildings 119 102<br />
Machinery and equipment 1,964 1,736<br />
5,606 5,201<br />
Accumulated depreciation and amortization (2,326) (2,164)<br />
$ 3,280 $ 3,037<br />
Depreciation and amortization expense related to property,<br />
plant and equipment was $388 million, $357 million and<br />
$320 million in 2003, 2002 and 2001, respectively.
note 12<br />
GOODWILL AND INTANGIBLE ASSETS<br />
The changes in the carrying amount of goodwill are as<br />
follows:<br />
Inter-<br />
U.S. national Worldwide<br />
Balance as of December 29, 2001<br />
Reclassification of reacquired<br />
$ 21 $ 38 $ 59<br />
franchise rights (a) 145 96 241<br />
Impairment (b) — (5) (5)<br />
Acquisitions, disposals and other, net (c) 206 (16) 190<br />
Balance as of December 28, 2002 $ 372 $ 113 $ 485<br />
Acquisitions, disposals and other, net (d) 14 22 36<br />
Balance as of December 27, 2003 $ 386 $ 135 $ 521<br />
(a) The Company’s business combinations have included acquiring restaurants<br />
from our franchisees. Prior to the adoption of SFAS 141, the primary intangible<br />
asset to which we generally allocated value in these business combinations<br />
was reacquired franchise rights. We determined that reacquired franchise rights<br />
did not meet the criteria of SFAS 141 to be recognized as an asset apart from<br />
goodwill. Accordingly, on December 30, 2001, we reclassified $241 million of<br />
reacquired franchise rights to goodwill, net of related deferred tax liabilities of<br />
$53 million, ($27 million for the U.S. and $26 million for International).<br />
(b) Represents impairment of the goodwill of the Pizza Hut France reporting unit.<br />
(c) Includes goodwill related to the YGR purchase price allocation. For International,<br />
includes a $13 million transfer of goodwill to assets held for sale (see Note 7).<br />
(d) Primarily includes goodwill recorded as a result of acquisitions of restaurants<br />
from franchisees.<br />
Intangible assets, net for the years ended 2003 and 2002<br />
are as follows:<br />
2003 2002<br />
Gross Gross<br />
Carrying Accumulated Carrying Accumulated<br />
Amount Amortization Amount Amortization<br />
Amortized intangible assets<br />
Franchise contract rights $ 141 $ (49) $ 135 $ (43)<br />
Trademarks/brands 67 (1) — —<br />
Favorable operating leases 19 (13) 21 (13)<br />
Pension-related intangible 14 — 18 —<br />
Other 31 (23) 26 (23)<br />
$ 272 $ (86) $ 200 $ (79)<br />
Unamortized intangible assets<br />
Trademarks/brands $ 171 $ 243<br />
The most significant recorded trademark/brand assets<br />
resulted when we acquired YGR in 2002. The fair value of<br />
a trademark/brand is determined based upon the value<br />
derived from the royalty we avoid, in the case of Company<br />
stores, or receive, in the case of franchise and licensee<br />
stores, for the use of the trademark/brand. This fair value<br />
determination is thus largely dependent upon our estimation<br />
of sales attributable to the trademark/brand.<br />
The fair value of the LJS trademark/brand was determined<br />
to be in excess of its carrying value during our 2003<br />
annual impairment test. The estimate of sales attributable<br />
to the LJS trademark/brand at the date of this test reflected<br />
the opportunities we believe exist with regard to increased<br />
penetration of LJS, for both stand-alone units and as a<br />
multibrand partner. Accordingly, we now believe our system’s<br />
development capital, at least through the term of our current<br />
projections, will be primarily directed towards LJS.<br />
<strong>Yum</strong>! Brands Inc. 61.<br />
The decision to focus short-term development largely<br />
on increased penetration of LJS and our discretionary<br />
capital spending limits have resulted in less than originally<br />
planned development of A&W in the near term. Additionally,<br />
while we continue to view A&W as a viable multibrand<br />
partner, subsequent to acquisition we decided to close or<br />
refranchise all Company-owned A&W restaurants that we<br />
had acquired. These restaurants were low-volume, mallbased<br />
units that were inconsistent with the remainder of<br />
our Company-owned portfolio. Both the decision to close<br />
these Company-owned A&W units and the decision to focus<br />
on short-term development opportunities at LJS negatively<br />
impacted the fair value of the A&W trademark/brand.<br />
Accordingly, we recorded a $5 million charge in 2003 to<br />
facility actions to write the value of the A&W trademark/<br />
brand down to its fair value.<br />
Historically, we have considered the assets acquired<br />
representing trademark/brand to have indefinite useful<br />
lives due to our expected use of the asset and the lack<br />
of legal, regulatory, contractual, competitive, economic or<br />
other factors that may limit their useful lives. As required by<br />
SFAS 142, we reconsider the remaining useful life of indefinite-life<br />
intangible assets each reporting period. Subsequent<br />
to the recording of the impairment of the A&W trademark/<br />
brand, we began amortizing its remaining balance over a<br />
period of thirty years (less than $1 million of amortization<br />
expense was recorded in 2003). While we continue to incorporate<br />
development of the A&W trademark/brand into our<br />
multibranding plans, our decision to no longer operate the<br />
acquired stand-alone Company-owned A&W restaurants is<br />
considered a factor that limits its useful life. Accordingly, we<br />
are amortizing the remaining balance of the A&W trademark/<br />
brand over a period of thirty years, the typical term of our<br />
multibrand franchise agreements including renewals. We<br />
continue to believe that all of our other recorded trademark/<br />
brand assets have indefinite lives.<br />
As a result of adopting SFAS 142, we ceased amortization<br />
of goodwill and indefinite-lived intangible assets<br />
beginning December 30, 2001. Amortization expense for<br />
definite-lived intangible assets was $7 million in 2003 and<br />
$6 million in 2002, respectively. Amortization expense for<br />
goodwill and all intangible assets was $37 million in 2001.<br />
Amortization expense for definite-lived intangible assets will<br />
approximate $9 million in 2004, $8 million in 2005 and<br />
2006, and $7 million in both 2007 and 2008.<br />
The following table provides a reconciliation of reported<br />
net income to adjusted net income as though SFAS 142<br />
had been effective for the year ended 2001:<br />
Amount<br />
2001<br />
Basic EPS Diluted EPS<br />
Reported net income<br />
Add back amortization expense<br />
(net of tax):<br />
$ 492 $ 1.68 $ 1.62<br />
Goodwill 25 0.09 0.09<br />
Trademarks/brands 1 — —<br />
Adjusted net income $ 518 $ 1.77 $ 1.71
62.<br />
note 13<br />
ACCOUNTS PAYABLE AND OTHER CURRENT LIABILITIES<br />
2003 2002<br />
Accounts payable $ 439 $ 417<br />
Accrued compensation and benefits 257 258<br />
Other current liabilities 517 491<br />
note 14<br />
$ 1,213 $ 1,166<br />
SHORT-TERM BORROWINGS AND LONG-TERM DEBT<br />
2003 2002<br />
Short-term Borrowings<br />
Current maturities of long-term debt $ 10 $ 12<br />
International lines of credit — 115<br />
Other — 19<br />
$ 10 $ 146<br />
Long-term Debt<br />
Senior, unsecured Revolving Credit Facility,<br />
expires June 2005 $ — $ 153<br />
Senior, Unsecured Notes, due May 2005 351 351<br />
Senior, Unsecured Notes, due April 2006 200 200<br />
Senior, Unsecured Notes, due May 2008 251 251<br />
Senior, Unsecured Notes, due April 2011 645 645<br />
Senior, Unsecured Notes, due July 2012 398 398<br />
Capital lease obligations (See Note 15) 112 99<br />
Other, due through 2010 (6% – 12%) 80 170<br />
2,037 2,267<br />
Less current maturities of long-term debt (10) (12)<br />
Long-term debt excluding SFAS 133 adjustment<br />
Derivative instrument adjustment under<br />
2,027 2,255<br />
SFAS 133 (See Note 16) 29 44<br />
Long-term debt including SFAS 133 adjustment $ 2,056 $ 2,299<br />
Our primary bank credit agreement comprises a senior<br />
unsecured Revolving Credit Facility (the “Credit Facility”)<br />
which matures on June 25, 2005. On December 26, 2003,<br />
we voluntarily reduced our maximum borrowings under the<br />
Credit Facility from $1.2 billion to $1.0 billion. The Credit<br />
Facility is unconditionally guaranteed by our principal<br />
domestic subsidiaries and contains financial covenants<br />
relating to maintenance of leverage and fixed charge<br />
coverage ratios. The Credit Facility also contains affirmative<br />
and negative covenants including, among other things, limitations<br />
on certain additional indebtedness, guarantees of<br />
indebtedness, level of cash dividends, aggregate non-U.S.<br />
investment and certain other transactions as defined in the<br />
agreement. We were in compliance with all debt covenants<br />
at December 27, 2003.<br />
Under the terms of the Credit Facility, we may borrow<br />
up to the maximum borrowing limit less outstanding letters<br />
of credit. At December 27, 2003, our unused Credit Facility<br />
totaled $737 million, net of outstanding letters of credit of<br />
$263 million. There were no borrowings outstanding under<br />
the Credit Facility at the end of the year. The interest rate<br />
for borrowings under the Credit Facility ranges from 1.0%<br />
to 2.0% over the London Interbank Offered Rate (“LIBOR”)<br />
or 0.00% to 0.65% over an Alternate Base Rate, which<br />
is the greater of the Prime Rate or the Federal Funds<br />
Effective Rate plus 0.50%. The exact spread over LIBOR or<br />
the Alternate Base Rate, as applicable, will depend upon<br />
our performance under specified financial criteria. Interest<br />
on any outstanding borrowings under the Credit Facility is<br />
payable at least quarterly. In 2003, 2002 and 2001, we<br />
expensed facility fees of approximately $6 million, $5 million<br />
and $4 million, respectively. At December 28, 2002, the<br />
weighted average contractual interest rate on borrowings<br />
outstanding under the Credit Facility was 2.6%.<br />
In 1997, we filed a shelf registration statement with<br />
the Securities and Exchange Commission for offerings of<br />
up to $2 billion of senior unsecured debt. In June 2002, we<br />
issued $400 million of 7.70% Senior Unsecured Notes due<br />
July 1, 2012 (the “2012 Notes”). The net proceeds from the<br />
issuance of the 2012 Notes were used to repay indebtedness<br />
under the Credit Facility. Additionally, we capitalized<br />
debt issuance costs of approximately $5 million related to<br />
the 2012 Notes in the third quarter of 2002. The following<br />
table summarizes all Senior Unsecured Notes issued under<br />
this shelf registration through December 27, 2003:<br />
Principal Interest Rate<br />
Issuance Date Maturity Date Amount Stated Effective .(d)<br />
May 1998 May 2005 (a) $ 350 7.45% 7.62%<br />
May 1998 May 2008 (a) 250 7.65% 7.81%<br />
April 2001 April 2006 (b) 200 8.50% 9.04%<br />
April 2001 April 2011 (b) 650 8.88% 9.20%<br />
June 2002 July 2012 (c) 400 7.70% 8.04%<br />
(a) Interest payments commenced on November 15, 1998 and are payable semiannually<br />
thereafter.<br />
(b) Interest payments commenced on October 15, 2001 and are payable semiannually<br />
thereafter.<br />
(c) Interest payments commenced on January 1, 2003 and are payable semiannually<br />
thereafter.<br />
(d) Includes the effects of the amortization of any (1) premium or discount; (2) debt<br />
issuance costs; and (3) gain or loss upon settlement of related treasury locks.<br />
Does not include the effect of any interest rate swaps as described in Note 16.<br />
We have $150 million remaining for issuance under the<br />
$2 billion shelf registration.<br />
In connection with our acquisition of YGR in 2002,<br />
we assumed approximately $168 million in present value<br />
of future rent obligations related to three existing saleleaseback<br />
agreements entered into by YGR involving<br />
approximately 350 LJS units. As a result of liens held by<br />
the buyer/lessor on certain personal property within the<br />
units, the sale-leaseback agreements were accounted<br />
for as financings upon acquisition. On August 15, 2003,<br />
we amended two of these sale-leaseback agreements to<br />
remove the liens on the personal property within the units.<br />
As the two amended agreements now qualify for sale-leaseback<br />
accounting, they will be accounted for as operating<br />
leases. Accordingly, the future rent obligations associated<br />
with the two amended agreements, previously recorded<br />
as long-term debt of $88 million, are no longer reflected<br />
on our Consolidated Balance Sheet as of December 27,<br />
2003. There was no gain or loss recorded as a result of<br />
this transaction.
The annual maturities of long-term debt as of<br />
December 27, 2003, excluding capital lease obligations<br />
of $112 million and derivative instrument adjustments of<br />
$29 million, are as follows:<br />
Year ended:<br />
2004 $ 1<br />
2005 351<br />
2006 202<br />
2007 2<br />
2008 252<br />
Thereafter 1,122<br />
Total $ 1,930<br />
Interest expense on short-term borrowings and long-term<br />
debt was $185 million, $180 million and $172 million in<br />
2003, 2002 and 2001, respectively.<br />
note 15<br />
LEASES<br />
We have non-cancelable commitments under both capital<br />
and long-term operating leases, primarily for our restaurants.<br />
Capital and operating lease commitments expire at<br />
various dates through 2087 and, in many cases, provide for<br />
rent escalations and renewal options. Most leases require<br />
us to pay related executory costs, which include property<br />
taxes, maintenance and insurance.<br />
Future minimum commitments and amounts to be<br />
received as lessor or sublessor under non-cancelable<br />
leases are set forth below:<br />
Commitments Lease Receivables<br />
Direct<br />
Capital Operating Financing Operating<br />
2004 $ 15 $ 320 $ 8 $ 22<br />
2005 15 290 8 20<br />
2006 14 250 7 19<br />
2007 13 227 7 18<br />
2008 13 204 6 17<br />
Thereafter 122 1,193 63 102<br />
$ 192 $ 2,484 $ 99 $ 198<br />
At year-end 2003, the present value of minimum payments<br />
under capital leases was $112 million. At December 27,<br />
2003, and December 28, 2002, unearned income associated<br />
with direct financing lease receivables was $41 million<br />
and $9 million, respectively.<br />
The details of rental expense and income are set forth<br />
below:<br />
2003 2002 2001<br />
Rental expense<br />
Minimum $ 329 $ 303 $ 268<br />
Contingent 44 40 25<br />
$ 373 $ 343 $ 293<br />
Minimum rental income $ 14 $ 11 $ 14<br />
<strong>Yum</strong>! Brands Inc. 63.<br />
Contingent rentals are generally based on sales levels<br />
in excess of stipulated amounts contained in the lease<br />
agreements.<br />
note 16<br />
FINANCIAL INSTRUMENTS<br />
Derivative Instruments<br />
Interest Rates<br />
We enter into interest rate swaps and forward rate agreements<br />
with the objective of reducing our exposure to<br />
interest rate risk and lowering interest expense for a<br />
portion of our debt. Under the contracts, we agree with other<br />
parties to exchange, at specified intervals, the difference<br />
between variable rate and fixed rate amounts calculated<br />
on a notional principal amount. At December 27, 2003<br />
and December 28, 2002, we had outstanding pay-variable<br />
interest rate swaps with notional amounts of $350 million.<br />
These swaps have reset dates and floating rate indices<br />
which match those of our underlying fixed-rate debt and<br />
have been designated as fair value hedges of a portion of<br />
that debt. As the swaps qualify for the short-cut method<br />
under SFAS 133 no ineffectiveness has been recorded. The<br />
fair value of these swaps as of December 27, 2003 and<br />
December 28, 2002 was approximately $31 million and<br />
$48 million, respectively, and has been included in other<br />
assets. The portion of this fair value which has not yet<br />
been recognized as a reduction to interest expense (approximately<br />
$29 million and $44 million at December 27, 2003<br />
and December 28, 2002, respectively) has been included<br />
in long-term debt.<br />
During 2002, we entered into treasury locks with<br />
notional amounts totaling $250 million. These treasury<br />
locks were entered into to hedge the risk of changes in<br />
future interest payments attributable to changes in the<br />
benchmark interest rate prior to issuance of additional<br />
fixed-rate debt. These locks were designated and effective<br />
in offsetting the variability in cash flows associated with the<br />
future interest payments on a portion of the 2012 Notes.<br />
Thus, the insignificant loss at which these treasury locks<br />
were settled will be recognized as an increase to interest<br />
on the debt through 2012.<br />
Foreign Exchange<br />
We enter into foreign currency forward contracts with the<br />
objective of reducing our exposure to cash flow volatility<br />
arising from foreign currency fluctuations associated with<br />
certain foreign currency denominated financial instruments,<br />
the majority of which are intercompany short-term<br />
receivables and payables. The notional amount, maturity<br />
date, and currency of these contracts match those of<br />
the underlying receivables or payables. For those foreign<br />
currency exchange forward contracts that we have designated<br />
as cash flow hedges, we measure ineffectiveness by
64.<br />
comparing the cumulative change in the forward contract<br />
with the cumulative change in the hedged item. No significant<br />
ineffectiveness was recognized in 2003 or 2002 for<br />
those foreign currency forward contracts designated as<br />
cash flow hedges.<br />
Commodities<br />
We also utilize on a limited basis commodity futures and<br />
options contracts to mitigate our exposure to commodity<br />
price fluctuations over the next twelve months. Those<br />
contracts have not been designated as hedges under<br />
SFAS 133. Commodity future and options contracts<br />
entered into for the fiscal years ended December 27, 2003<br />
and December 28, 2002 did not significantly impact the<br />
Consolidated Financial Statements.<br />
Deferred Amounts in Accumulated Other<br />
Comprehensive Income (Loss)<br />
As of December 27, 2003, we had a net deferred loss associated<br />
with cash flow hedges of approximately $2 million,<br />
net of tax. Of this amount, we estimate that a net aftertax<br />
loss of less than $1 million will be reclassified into<br />
earnings through December 25, 2004. The remaining net<br />
after-tax loss of approximately $2 million, which arose from<br />
the settlement of treasury locks entered into prior to the<br />
issuance of certain amounts of our fixed-rate debt, will be<br />
reclassified into earnings from December 26, 2004 through<br />
2012 as an increase to interest expense on this debt.<br />
Credit Risks<br />
Credit risk from interest rate swap, treasury lock and<br />
forward rate agreements and foreign exchange contracts is<br />
dependent both on movement in interest and currency rates<br />
and the possibility of non-payment by counterparties. We<br />
mitigate credit risk by entering into these agreements with<br />
high-quality counterparties, and netting swap and forward<br />
rate payments within contracts.<br />
Accounts receivable consists primarily of amounts due<br />
from franchisees and licensees for initial and continuing<br />
fees. In addition, we have notes and lease receivables<br />
from certain of our franchisees. The financial condition<br />
of these franchisees and licensees is largely dependent<br />
upon the underlying business trends of our Concepts. This<br />
concentration of credit risk is mitigated, in part, by the<br />
large number of franchisees and licensees of each Concept<br />
and the short-term nature of the franchise and license fee<br />
receivables.<br />
Fair Value<br />
At December 27, 2003 and December 28, 2002, the<br />
fair values of cash and cash equivalents, short-term<br />
investments, accounts receivable, and accounts payable<br />
approximated carrying value because of the short-term<br />
nature of these instruments. The fair value of notes<br />
receivable approximates carrying value after consideration<br />
of recorded allowances.<br />
The carrying amounts and fair values of our other<br />
financial instruments subject to fair value disclosures are<br />
as follows:<br />
2003 2002<br />
Carrying Fair Carrying Fair<br />
Amount Value Amount Value<br />
Debt<br />
Short-term borrowings<br />
and long-term debt,<br />
excluding capital leases<br />
and the derivative<br />
instrument adjustments $ 1,925 $ 2,181 $ 2,302 $ 2,470<br />
Debt-related derivative<br />
instruments:<br />
Open contracts in a net<br />
asset position 31 31 48 48<br />
Foreign currency-related<br />
derivative instruments:<br />
Open contracts in a net<br />
asset (liability) position — — (1) (1)<br />
Lease guarantees 8 37 4 42<br />
Guarantees supporting<br />
financial arrangements of<br />
certain franchisees,<br />
unconsolidated affiliates<br />
and other third parties 8 10 16 17<br />
Letters of credit — 3 — 3<br />
We estimated the fair value of debt, debt-related derivative<br />
instruments, foreign currency-related derivative instruments,<br />
guarantees and letters of credit using market quotes and<br />
calculations based on market rates.<br />
note 17<br />
PENSION AND POSTRETIREMENT MEDICAL BENEFITS<br />
Pension Benefits<br />
We sponsor noncontributory defined benefit pension<br />
plans covering substantially all full-time U.S. salaried<br />
employees, certain hourly employees and certain international<br />
employees. The most significant of these plans, the<br />
YUM Retirement Plan (the “Plan”), is funded while benefits<br />
from the other plan are paid by the Company as incurred.<br />
During 2001, the Plan was amended such that any salaried<br />
employee hired or rehired by YUM after September 30,<br />
2001 is not eligible to participate in the Plan. Benefits are<br />
based on years of service and earnings or stated amounts<br />
for each year of service.<br />
Postretirement Medical Benefits<br />
Our postretirement plan provides health care benefits,<br />
principally to U.S. salaried retirees and their dependents.<br />
This plan includes retiree cost sharing provisions. During<br />
2001, the plan was amended such that any salaried<br />
employee hired or rehired by YUM after September 30,<br />
2001 is not eligible to participate in this plan. Employees<br />
hired prior to September 30, 2001 are eligible for benefits
if they meet age and service requirements and qualify for<br />
retirement benefits.<br />
On December 8, 2003, the Medicare Prescription Drug,<br />
Improvement and Modernization Act of 2003 (the “Act”),<br />
which introduces a Medicare prescription drug benefit as<br />
well as a federal subsidy to sponsors of retiree health care<br />
benefit plans that provide a benefit that is at least actuarially<br />
equivalent to the Medicare benefit, was enacted. On<br />
January 12, 2004 the FASB issued Financial Staff Position<br />
No. 106a, “Accounting and Disclosure Requirements<br />
Related to The Medicare Prescription Drug, Improvement<br />
and Modernization Act of 2003” (“FSP 106a”) to discuss<br />
certain accounting and disclosure issues raised by the Act.<br />
We have elected to defer the measurement and disclosure<br />
requirements under the provisions of FSP 106a until specific<br />
authoritative guidance is issued by the FASB later in 2004.<br />
The reported accumulated benefit obligation and net periodic<br />
benefit costs of our postretirement plan do not reflect the<br />
effects of the Act. The authoritative guidance, when issued,<br />
could require revisions to previously reported information.<br />
While we may be eligible for benefits under the Act based on<br />
the prescription drug benefits provided in our postretirement<br />
plan, we do not believe such benefits will have a material<br />
impact on our Consolidated Financial Statements.<br />
We use a measurement date of September 30 for<br />
our pension and post-retirement medical plans described<br />
above.<br />
Obligation and Funded status at September 30:<br />
Postretirement<br />
Pension Benefits Medical Benefits<br />
2003 2002 2003 2002<br />
Change in benefit obligation<br />
Benefit obligation at<br />
beginning of year $ 501 $ 420 $ 68 $ 58<br />
Service cost 26 22 2 2<br />
Interest cost 34 31 5 4<br />
Plan amendments — 14 — —<br />
Curtailment gain (1) (3) — —<br />
Benefits and expenses paid (21) (16) (4) (3)<br />
Actuarial loss 90 33 10 7<br />
Benefit obligation at end of year<br />
Change in plan assets<br />
Fair value of plan assets at<br />
$ 629 $ 501 $ 81 $ 68<br />
beginning of year $ 251 $ 291<br />
Actual return on plan assets 52 (24)<br />
Employer contributions 157 1<br />
Benefits paid (21) (16)<br />
Administrative expenses<br />
Fair value of plan assets at<br />
(1) (1)<br />
end of year $ 438 $ 251<br />
Funded status $ (191) $ (250) $ (81) $ (68)<br />
Employer contributions — 25 .(a) — —<br />
Unrecognized actuarial loss 230 169 28 18<br />
Unrecognized prior service cost<br />
Net amount recognized at<br />
12 16 — —<br />
year-end $ 51 $ (40) $ (53) $ (50)<br />
(a) Reflects a contribution made between the September 30, 2002 measurement<br />
date and December 28, 2002.<br />
<strong>Yum</strong>! Brands Inc. 65.<br />
Amounts recognized in the<br />
statement of financial position<br />
consist of:<br />
Accrued benefit liability $ (125) $ (172) $ (53) $ (50)<br />
Intangible asset<br />
Accumulated other<br />
14 18 — —<br />
comprehensive loss 162 114 — —<br />
$ 51 $ (40) $ (53) $ (50)<br />
Additional Information<br />
Other comprehensive loss<br />
attributable to change in<br />
additional minimum liability<br />
recognition $ 48 $ 76<br />
Additional year-end information<br />
for pension plans with<br />
accumulated benefit obligations<br />
in excess of plan assets<br />
Projected benefit obligation $ 629 $ 501<br />
Accumulated benefit obligation 563 448<br />
Fair value of plan assets 438 251<br />
While we are not required to make contributions to the Plan<br />
in 2004, we may make discretionary contributions during<br />
the year based on our estimate of the Plan’s expected<br />
September 30, 2004 funded status.<br />
Components of Net Periodic Benefit Cost<br />
Pension Benefits<br />
2003 2002 2001<br />
Service cost $ 26 $ 22 $ 20<br />
Interest cost 34 31 28<br />
Amortization of prior service cost 4 1 1<br />
Expected return on plan assets (30) (28) (29)<br />
Recognized actuarial loss 6 1 1<br />
Net periodic benefit cost<br />
Additional loss recognized due to:<br />
$ 40 $ 27 $ 21<br />
Curtailment $ — $ 1 $ —<br />
Special termination benefits — — 2<br />
Postretirement Medical Benefits<br />
2003 2002 2001<br />
Service cost $ 2 $ 2 $ 2<br />
Interest cost 5 4 4<br />
Amortization of prior service cost — — (1)<br />
Recognized actuarial loss 1 1 —<br />
Net periodic benefit cost $ 8 $ 7 $ 5<br />
Prior service costs are amortized on a straight-line basis over<br />
the average remaining service period of employees expected<br />
to receive benefits. Curtailment gains and losses have generally<br />
been recognized in facility actions as they have resulted<br />
primarily from refranchising and closure activities.<br />
Weighted-average assumptions used to determine benefit<br />
obligations at September 30:<br />
Postretirement<br />
Pension Benefits Medical Benefits<br />
2003 2002 2003 2002<br />
Discount rate 6.25% 6.85% 6.25% 6.85%<br />
Rate of compensation increase 3.75% 3.85% 3.75% 3.85%
66.<br />
Weighted-average assumptions used to determine the net periodic benefit cost for fiscal years:<br />
Pension Benefits Postretirement Medical Benefits<br />
2003 2002 2001 2003 2002 2001<br />
Discount rate 6.85% 7.60% 8.03% 6.85% 7.58% 8.27%<br />
Long-term rate of return on plan assets 8.50% 10.00% 10.00% — — —<br />
Rate of compensation increase 3.85% 4.60% 5.03% 3.85% 4.60% 5.03%<br />
Our estimated long-term rate of return on plan assets<br />
represents a weighted-average of expected future returns<br />
on the asset categories included in our target investment<br />
allocation based primarily on the historical returns for each<br />
asset category, adjusted for an assessment of current<br />
market conditions.<br />
Assumed health care cost trend rates at September 30:<br />
Postretirement<br />
Medical Benefits<br />
2003 2002<br />
Health care cost trend rate assumed for next year<br />
Rate to which the cost trend rate is assumed to<br />
12% 12%<br />
decline (the ultimate trend rate) 5.5% 5.5%<br />
Year that the rate reaches the ultimate trend rate 2012 2011<br />
There is a cap on our medical liability for certain retirees.<br />
The cap for Medicare eligible retirees was reached in 2000<br />
and the cap for non-Medicare eligible retirees is expected to<br />
be reached between the years 2007–2008; once the cap is<br />
reached, our annual cost per retiree will not increase.<br />
Assumed health care cost trend rates have a significant<br />
effect on the amounts reported for our postretirement<br />
health care plans. A one-percentage-point change in<br />
assumed health care cost trend rates would have the<br />
following effects:<br />
1-Percentage- 1-Percentage-<br />
Point Point<br />
Increase Decrease<br />
Effect on total of service and interest cost $ — $ —<br />
Effect on postretirement benefit obligation $ 4 $ (3)<br />
Plan Assets<br />
Our pension plan weighted-average asset allocations at<br />
September 30, by asset category are set forth below:<br />
Asset Category 2003 2002<br />
Equity securities 65% 62%<br />
Debt securities 30% 37%<br />
Cash 5% 1%<br />
Total 100% 100%<br />
Our primary objectives regarding the pension assets are to<br />
optimize return on assets subject to acceptable risk and<br />
to maintain liquidity, meet minimum funding requirements<br />
and minimize plan expenses. To achieve these objectives<br />
we have adopted a passive investment strategy in which<br />
the asset performance is driven primarily by the investment<br />
allocation. Our target investment allocation is 70% equity<br />
securities and 30% debt securities, consisting primarily<br />
of low cost index mutual funds that track several sub-<br />
categories of equity and debt security performance. The<br />
investment strategy is primarily driven by lower participant<br />
ages and reflects a long-term investment horizon favoring a<br />
higher equity component in the investment allocation.<br />
A mutual fund held as an investment by the pension<br />
plan includes YUM stock in the amounts of $0.2 million and<br />
$0.1 million at September 30, 2003 and 2002 (less than<br />
1% of total plan assets in each instance).<br />
note 18<br />
STOCK-BASED EMPLOYEE COMPENSATION<br />
At year-end 2003, we had four stock option plans in effect:<br />
the YUM! Brands, Inc. Long-Term Incentive Plan (“1999<br />
LTIP”), the 1997 Long-Term Incentive Plan (“1997 LTIP”), the<br />
YUM! Brands, Inc. Restaurant General Manager Stock Option<br />
Plan (“RGM Plan”) and the YUM! Brands, Inc. SharePower<br />
Plan (“SharePower”). During 2003, the 1999 LTIP was<br />
amended, subsequent to shareholder approval, to increase<br />
the total number of shares available for issuance and to<br />
make certain other technical and clarifying changes.<br />
We may grant awards of up to 29.8 million shares<br />
and 45.0 million shares of stock under the 1999 LTIP, as<br />
amended, and 1997 LTIP, respectively. Potential awards to<br />
employees and non-employee directors under the 1999 LTIP<br />
include stock options, incentive stock options, stock appreciation<br />
rights, restricted stock, stock units, restricted stock<br />
units, performance shares and performance units. Potential<br />
awards to employees and non-employee directors under the<br />
1997 LTIP include stock appreciation rights, restricted stock<br />
and performance restricted stock units. Prior to January 1,<br />
2002, we also could grant stock options and incentive stock<br />
options under the 1997 LTIP. We have issued only stock<br />
options and performance restricted stock units under the<br />
1997 LTIP and have issued only stock options under the<br />
1999 LTIP.<br />
We may grant stock options under the 1999 LTIP to<br />
purchase shares at a price equal to or greater than the<br />
average market price of the stock on the date of grant.<br />
New option grants under the 1999 LTIP can have varying<br />
vesting provisions and exercise periods. Previously granted<br />
options under the 1997 LTIP and 1999 LTIP vest in periods<br />
ranging from immediate to 2007 and expire ten to fifteen<br />
years after grant.<br />
We may grant options to purchase up to 15.0 million<br />
shares of stock under the RGM Plan at a price equal to or<br />
greater than the average market price of the stock on the
date of grant. RGM Plan options granted have a four year<br />
vesting period and expire ten years after grant. We may<br />
grant options to purchase up to 14.0 million shares of stock<br />
at a price equal to or greater than the average market<br />
price of the stock on the date of grant under SharePower.<br />
Previously granted SharePower options have expirations<br />
through 2013.<br />
At the Spin-off Date, we converted certain of the<br />
unvested options to purchase PepsiCo stock that were<br />
held by our employees to YUM stock options under either<br />
the 1997 LTIP or SharePower. We converted the options at<br />
amounts and exercise prices that maintained the amount of<br />
unrealized stock appreciation that existed immediately prior<br />
to the Spin-off. The vesting dates and exercise periods of<br />
the options were not affected by the conversion. Based on<br />
their original PepsiCo grant date, these converted options<br />
<strong>Yum</strong>! Brands Inc. 67.<br />
vest in periods ranging from one to ten years and expire<br />
ten to fifteen years after grant.<br />
We estimated the fair value of each option grant made<br />
during 2003, 2002 and 2001 as of the date of grant using<br />
the Black-Scholes option-pricing model with the following<br />
weighted average assumptions:<br />
2003 2002 2001<br />
Risk-free interest rate 3.0% 4.3% 4.7%<br />
Expected life (years) 6.0 6.0 6.0<br />
Expected volatility 33.6% 33.9% 32.7%<br />
Expected dividend yield 0.0% 0.0% 0.0%<br />
A summary of the status of all options granted to employees<br />
and non-employee directors as of December 27, 2003,<br />
December 28, 2002 and December 29, 2001, and changes<br />
during the years then ended is presented below (tabular<br />
options in thousands):<br />
December 27, 2003 December 28, 2002 December 29, 2001<br />
Wtd. Avg. Wtd. Avg. Wtd. Avg.<br />
Exercise Exercise Exercise<br />
Options Price Options Price Options Price<br />
Outstanding at beginning of year 49,630 $ 17.54 54,452 $ 16.04 53,358 $ 15.60<br />
Granted at price equal to average market price 7,344 24.78 6,974 25.52 10,019 17.34<br />
Exercised (6,902) 16.18 (8,876) 14.06 (3,635) 11.56<br />
Forfeited (3,101) 19.18 (2,920) 19.07 (5,290) 17.16<br />
Outstanding at end of year 46,971 $ 18.77 49,630 $ 17.54 54,452 $ 16.04<br />
Exercisable at end of year 19,875 $ 17.22 17,762 $ 13.74 12,962 $ 12.76<br />
Weighted average fair value of options granted during the year $ 9.43 $ 10.44 $ 7.10<br />
The following table summarizes information about stock options outstanding and exercisable at December 27, 2003<br />
(tabular options in thousands):<br />
Options Outstanding<br />
Wtd. Avg.<br />
Options Exercisable<br />
Remaining Wtd. Avg. Wtd. Avg.<br />
Range of Exercise Prices Options Contractual Life Exercise Price Options Exercise Price<br />
$ 0 – 10 882 1.11 $ 7.70 882 $ 7.70<br />
10 – 15 7,757 3.29 12.73 7,109 12.72<br />
15 – 20 20,568 6.09 16.12 5,861 16.36<br />
20 – 30 16,656 7.72 24.42 5,379 23.39<br />
30 – 40 1,108 7.22 34.05 644 36.30<br />
46,971 19,875
68.<br />
In November 1997, we granted two awards of performance<br />
restricted stock units of YUM’s Common Stock to our Chief<br />
Executive Officer (“CEO”). The awards were made under<br />
the 1997 LTIP and may be paid in Common Stock or cash<br />
at the discretion of the Compensation Committee of the<br />
Board of Directors. Payment of an award of $2.7 million<br />
was contingent upon the CEO’s continued employment<br />
through January 25, 2001 and our attainment of certain<br />
pre-established earnings thresholds. In January 2001, our<br />
CEO received a cash payment of $2.7 million following<br />
the Compensation Committee’s certification of YUM’s<br />
attainment of the pre-established earnings threshold.<br />
Payment of an award of $3.6 million is contingent upon<br />
his employment through January 25, 2006 and our attainment<br />
of certain pre-established earnings thresholds. The<br />
annual expense related to these awards included in earnings<br />
was $0.4 million for 2003, $0.4 million for 2002 and<br />
$0.5 million for 2001.<br />
note 19<br />
OTHER COMPENSATION AND BENEFIT PROGRAMS<br />
We sponsor two deferred compensation benefit programs,<br />
the Restaurant Deferred Compensation Plan and the<br />
Executive Income Deferral Program (the “RDC Plan” and<br />
the “EID Plan,” respectively) for eligible employees and<br />
non-employee directors.<br />
Effective October 1, 2001, participants can no longer<br />
defer funds into the RDC Plan. Prior to that date, the RDC<br />
Plan allowed participants to defer a portion of their annual<br />
salary. The participant’s balances will remain in the RDC<br />
Plan until their scheduled distribution dates. As defined<br />
by the RDC Plan, we credit the amounts deferred with<br />
earnings based on the investment options selected by the<br />
participants. Investment options in the RDC Plan consist of<br />
phantom shares of various mutual funds and YUM Common<br />
Stock. We recognize compensation expense for the appreciation<br />
or depreciation, if any, attributable to all investments in<br />
the RDC Plan, and prior to October 1, 2001, for any matching<br />
contributions. Our obligations under the RDC program as of<br />
the end of 2003 and 2002 were $11 million and $10 million,<br />
respectively. We recognized annual compensation expense<br />
of $3 million in 2003, less than $1 million in 2002 and<br />
$3 million in 2001 for the RDC Plan.<br />
The EID Plan allows participants to defer receipt of a<br />
portion of their annual salary and all or a portion of their<br />
incentive compensation. As defined by the EID Plan, we<br />
credit the amounts deferred with earnings based on the<br />
investment options selected by the participants. These<br />
investment options are limited to cash and phantom shares<br />
of our Common Stock. The EID Plan allows participants to<br />
defer incentive compensation to purchase phantom shares<br />
of our Common Stock at a 25% discount from the average<br />
market price at the date of deferral (the “Discount Stock<br />
Account”). Participants bear the risk of forfeiture of both<br />
the discount and any amounts deferred to the Discount<br />
Stock Account if they voluntarily separate from employment<br />
during the two year vesting period. We expense the<br />
intrinsic value of the discount over the vesting period. As<br />
investments in the phantom shares of our Common Stock<br />
can only be settled in shares of our Common Stock, we do<br />
not recognize compensation expense for the appreciation<br />
or the depreciation, if any, of these investments. Deferrals<br />
into the phantom shares of our Common Stock are credited<br />
to the Common Stock Account.<br />
Our cash obligations under the EID Plan as of the end of<br />
2003 and 2002 were $25 million and $24 million, respectively.<br />
We recognized compensation expense of $3 million<br />
in 2003, $2 million in 2002 and $4 million in 2001 for the<br />
EID Plan.<br />
We sponsor a contributory plan to provide retirement<br />
benefits under the provisions of Section 401(k) of the<br />
Internal Revenue Code (the “401(k) Plan”) for eligible U.S.<br />
salaried and hourly employees. During 2003, participants<br />
were able to elect to contribute up to 25% of eligible<br />
compensation on a pre-tax basis (the maximum participant<br />
contribution increased from 15% to 25% effective January 1,<br />
2003). Participants may allocate their contributions to one<br />
or any combination of 10 investment options within the<br />
401(k) Plan. Effective October 1, 2001, the 401(k) Plan<br />
was amended such that the Company matches 100% of the<br />
participant’s contribution up to 3% of eligible compensation<br />
and 50% of the participant’s contribution on the next 2% of<br />
eligible compensation. All matching contributions are made<br />
to the YUM Common Stock Fund. Prior to this amendment,<br />
we made a discretionary matching contribution equal to a<br />
predetermined percentage of each participant’s contribution<br />
to the YUM Common Stock Fund. We determined our<br />
percentage match at the beginning of each year based on<br />
the immediate prior year performance of our Concepts. We<br />
recognized as compensation expense our total matching<br />
contribution of $10 million in 2003, $8 million in 2002 and<br />
$5 million in 2001.<br />
note 20<br />
SHAREHOLDERS’ RIGHTS PLAN<br />
In July 1998, our Board of Directors declared a dividend<br />
distribution of one right for each share of Common Stock<br />
outstanding as of August 3, 1998 (the “Record Date”). As<br />
a result of the two-for-one stock split distributed on June<br />
17, 2002, each holder of Common Stock is entitled to one<br />
right for every two shares of Common Stock (one-half right<br />
per share). Each right initially entitles the registered holder<br />
to purchase a unit consisting of one one-thousandth of a<br />
share (a “Unit”) of Series A Junior Participating Preferred<br />
Stock, without par value, at a purchase price of $130 per<br />
Unit, subject to adjustment. The rights, which do not have<br />
voting rights, will become exercisable for our Common Stock<br />
ten business days following a public announcement that a
person or group has acquired, or has commenced or intends<br />
to commence a tender offer for, 15% or more, or 20% or<br />
more if such person or group owned 10% or more on the<br />
adoption date of this plan, of our Common Stock. In the<br />
event the rights become exercisable for Common Stock,<br />
each right will entitle its holder (other than the Acquiring<br />
Person as defined in the Agreement) to purchase, at the<br />
right’s then-current exercise price, YUM Common Stock<br />
having a value of twice the exercise price of the right. In the<br />
event the rights become exercisable for Common Stock and<br />
thereafter we are acquired in a merger or other business<br />
combination, each right will entitle its holder to purchase,<br />
at the right’s then-current exercise price, common stock of<br />
the acquiring company having a value of twice the exercise<br />
price of the right.<br />
We can redeem the rights in their entirety, prior to<br />
becoming exercisable, at $0.01 per right under certain<br />
specified conditions. The rights expire on July 21, 2008,<br />
unless we extend that date or we have earlier redeemed or<br />
exchanged the rights as provided in the Agreement.<br />
This description of the rights is qualified in its<br />
entirety by reference to the original Rights Agreement,<br />
dated July 21, 1998, and the Agreement of Substitution<br />
and Amendment of Common Share Rights Agreement,<br />
dated August 28, 2003, between YUM and American<br />
Stock Transfer and Trust Company, the Rights Agent (both<br />
including the exhibits thereto).<br />
note 21<br />
SHARE REPURCHASE PROGRAM<br />
In November 2003, our Board of Directors authorized a new<br />
share repurchase program. This program authorizes us to<br />
repurchase, through May 21, 2005, up to $300 million of<br />
our outstanding Common Stock (excluding applicable transaction<br />
fees). During 2003, we repurchased approximately<br />
169,000 shares for approximately $5.7 million under this<br />
program at an average price per share of approximately<br />
$34. Based on market conditions and other factors, additional<br />
repurchases may be made from time to time in the<br />
open market or through privately negotiated transactions<br />
at the discretion of the Company.<br />
In November 2002, our Board of Directors authorized<br />
a share repurchase program. This program authorized us<br />
to repurchase up to $300 million (excluding applicable<br />
transaction fees) of our outstanding Common Stock. This<br />
share repurchase program was completed in 2003. During<br />
2003, we repurchased approximately 9.2 million shares<br />
for approximately $272 million at an average price per<br />
share of approximately $30 under this program. During<br />
2002, we repurchased approximately 1.2 million shares for<br />
approximately $28 million at an average price per share of<br />
approximately $24 under this program.<br />
In February 2001, our Board of Directors authorized<br />
a share repurchase program. This program authorized us<br />
<strong>Yum</strong>! Brands Inc. 69.<br />
to repurchase up to $300 million (excluding applicable<br />
transaction fees) of our outstanding Common Stock. This<br />
share repurchase program was completed in 2002. During<br />
2002, we repurchased approximately 7.0 million shares<br />
for approximately $200 million at an average price per<br />
share of approximately $29 under this program. During<br />
2001, we repurchased approximately 4.8 million shares for<br />
approximately $100 million at an average price per share<br />
of approximately $21 under this program.<br />
note 22<br />
INCOME TAXES<br />
The details of our income tax provision (benefit) are set<br />
forth below. Amounts do not include the income tax benefit<br />
of approximately $1 million on the $2 million cumulative<br />
effect adjustment recorded on December 29, 2002 due to<br />
the adoption of SFAS 143.<br />
2003 2002 2001<br />
Current:<br />
Federal $ 181 $ 137 $ 200<br />
Foreign 114 93 75<br />
State (4) 24 38<br />
291 254 313<br />
Deferred:<br />
Federal (23) 29 (29)<br />
Foreign (16) (6) (33)<br />
State 16 (2) (10)<br />
(23) 21 (72)<br />
$ 268 $ 275 $ 241<br />
Taxes payable were reduced by $26 million, $49 million<br />
and $13 million in 2003, 2002 and 2001, respectively, as<br />
a result of stock option exercises. In addition, goodwill and<br />
other intangibles were reduced by $8 million in 2001 as a<br />
result of the settlement of a disputed claim with the Internal<br />
Revenue Service relating to the deductibility of reacquired<br />
franchise rights and other intangibles offset by an $8 million<br />
reduction in deferred and accrued taxes payable.<br />
Valuation allowances related to deferred tax assets<br />
in certain states increased by $6 million ($4 million, net<br />
of federal tax) and $1 million ($1 million, net of federal<br />
tax) and in foreign countries increased by $19 million and<br />
$6 million in 2003 and 2002, respectively, as a result of<br />
determining that it is more likely than not that certain loss<br />
carryforwards will not be utilized prior to expiration. In<br />
2001, valuation allowances related to deferred tax assets<br />
in certain states and foreign countries were reduced by<br />
$9 million ($6 million, net of federal tax) and $6 million,<br />
respectively, as a result of determining that these assets<br />
will be utilized prior to expiration.<br />
The deferred foreign tax provision for both 2002 and<br />
2001 included a $2 million credit to reflect the impact of<br />
changes in statutory tax rates in various countries.
70.<br />
U.S. and foreign income before income taxes are set<br />
forth below:<br />
2003 2002 2001<br />
U.S. $ 669 $ 665 $ 599<br />
Foreign 217 193 134<br />
$ 886 $ 858 $ 733<br />
The reconciliation of income taxes calculated at the U.S.<br />
federal tax statutory rate to our effective tax rate is set<br />
forth below:<br />
2003 2002 2001<br />
U.S. federal statutory rate 35.0% 35.0% 35.0%<br />
State income tax, net of federal<br />
tax benefit 1.8 2.0 2.1<br />
Foreign and U.S. tax effects<br />
attributable to foreign operations (3.6) (2.8) (0.7)<br />
Adjustments to reserves and<br />
prior years (1.7) (1.8) (1.8)<br />
Foreign tax credit amended<br />
return benefit (4.1) — —<br />
Valuation allowance additions<br />
(reversals) 2.8 — (1.7)<br />
Other, net — (0.3) (0.1)<br />
Effective income tax rate 30.2% 32.1% 32.8%<br />
We amended certain prior year returns in 2003 upon our<br />
determination that it was more beneficial to claim credit on<br />
our U.S. tax returns for foreign taxes paid than to deduct<br />
such taxes, as had been done when the returns were originally<br />
filed. The benefit for amending such returns will be<br />
non-recurring.<br />
The details of 2003 and 2002 deferred tax liabilities<br />
(assets) are set forth below:<br />
2003 2002<br />
Intangible assets and property,<br />
plant and equipment $ 232 $ 229<br />
Other 101 76<br />
Gross deferred tax liabilities $ 333 $ 305<br />
Net operating loss and tax credit<br />
carryforwards $ (231) $ (194)<br />
Employee benefits (115) (100)<br />
Self-insured casualty claims<br />
Capital leases and future rent<br />
obligations related to<br />
(52) (58)<br />
sale-leaseback agreements (86) (114)<br />
Various liabilities and other (362) (303)<br />
Gross deferred tax assets<br />
Deferred tax asset valuation<br />
(846) (769)<br />
allowances 183 155<br />
Net deferred tax assets (663) (614)<br />
Net deferred tax (assets) liabilities $ (330) $ (309)<br />
Reported in Consolidated Balance Sheets as:<br />
Deferred income tax assets $ (165) $ (121)<br />
Other assets (178) (222)<br />
Accounts payable and other current liabilities 13 34<br />
$ (330) $ (309)<br />
A determination of the unrecognized deferred tax liability<br />
for temporary differences related to our investments in<br />
foreign subsidiaries and investments in foreign unconsolidated<br />
affiliates that are essentially permanent in duration<br />
is not practicable.<br />
We have available net operating loss and tax credit<br />
carryforwards totaling approximately $1.5 billion at<br />
December 27, 2003 to reduce future tax of YUM and certain<br />
subsidiaries. The carryforwards are related to a number<br />
of foreign and state jurisdictions. Of these carryforwards,<br />
$18 million expire in 2004 and $1.2 billion expire at various<br />
times between 2005 and 2021. The remaining carryforwards<br />
of approximately $313 million do not expire.<br />
note 23<br />
REPORTABLE OPERATING SEGMENTS<br />
We are principally engaged in developing, operating,<br />
franchising and licensing the worldwide KFC, Pizza Hut<br />
and Taco Bell concepts, and since May 7, 2002, the LJS<br />
and A&W concepts, which were added when we acquired<br />
YGR. KFC, Pizza Hut, Taco Bell, LJS and A&W operate<br />
throughout the U.S. and in 88, 86, 12, 3 and 13 countries<br />
and territories outside the U.S., respectively. Our five<br />
largest international markets based on operating profit in<br />
2003 are China, United Kingdom, Australia, Canada and<br />
Korea. At December 27, 2003, we had investments in 9<br />
unconsolidated affiliates outside the U.S. which operate<br />
principally KFC and/or Pizza Hut restaurants. These unconsolidated<br />
affiliates operate in China, Japan, Poland and<br />
the United Kingdom. Additionally, we had an investment in<br />
an unconsolidated affiliate in the U.S. which operates Yan<br />
Can restaurants.<br />
We identify our operating segments based on management<br />
responsibility within the U.S. and International. For<br />
purposes of applying SFAS No. 131, “Disclosure About<br />
Segments of An Enterprise and Related Information”<br />
(“SFAS 131”), we consider LJS and A&W to be a single<br />
segment. We consider our KFC, Pizza Hut, Taco Bell and<br />
LJS/A&W operating segments to be similar and therefore<br />
have aggregated them into a single reportable operating<br />
segment. Within our International operating segment, no individual<br />
country was considered material under the SFAS 131<br />
requirements related to information about geographic areas<br />
and therefore, none have been reported separately.<br />
Revenues 2003 2002 2001<br />
United States $ 5,655 $ 5,347 $ 4,827<br />
International 2,725 2,410 2,126<br />
$ 8,380 $ 7,757 $ 6,953
Operating Profit;<br />
Interest Expense, Net; and<br />
Income Before Income Taxes 2003 2002 2001<br />
United States $ 812 $ 802 $ 695<br />
International (a) 441 361 305<br />
Unallocated and corporate expenses (179) (178) (148)<br />
Unallocated other income (expense) (3) (1) (3)<br />
Unallocated facility actions (b) 4 19 39<br />
Wrench litigation (c) AmeriServe and other<br />
(42) — —<br />
(charges) credits (c) 26 27 3<br />
Total operating profit 1,059 1,030 891<br />
Interest expense, net<br />
Income before income taxes and<br />
cumulative effect of<br />
(173) (172) (158)<br />
accounting change $ 886 $ 858 $ 733<br />
Depreciation and Amortization 2003 2002 2001<br />
United States $ 240 $ 228 $ 224<br />
International 146 122 117<br />
Corporate 15 20 13<br />
$ 401 $ 370 $ 354<br />
Capital Spending 2003 2002 2001<br />
United States $ 395 $ 453 $ 392<br />
International 246 295 232<br />
Corporate 22 12 12<br />
$ 663 $ 760 $ 636<br />
Identifiable Assets 2003 2002 2001<br />
United States $ 3,279 $ 3,285 $ 2,521<br />
International (d) 1,880 1,732 1,598<br />
Corporate (e) 461 383 306<br />
$ 5,620 $ 5,400 $ 4,425<br />
Long-Lived Assets (f) 2003 2002 2001<br />
United States $ 2,880 $ 2,805 $ 2,195<br />
International 1,206 1,021 955<br />
Corporate 72 60 45<br />
$ 4,158 $ 3,886 $ 3,195<br />
(a) Includes equity income of unconsolidated affiliates of $44 million, $31 million<br />
and $26 million in 2003, 2002 and 2001, respectively.<br />
(b) Unallocated facility actions comprises refranchising gains (losses) which are<br />
not allocated to the U.S. or International segments for performance reporting<br />
purposes.<br />
(c) See Note 7 for a discussion of AmeriServe and other (charges) credits and<br />
Note 24 for a discussion of Wrench litigation.<br />
(d) Includes investment in unconsolidated affiliates of $182 million, $225 million<br />
and $213 million for 2003, 2002 and 2001, respectively. On November 10,<br />
2003 we dissolved our unconsolidated affiliate in Canada. See Note 8 for further<br />
discussion.<br />
(e) Primarily includes deferred tax assets, cash and cash equivalents, property, plant<br />
and equipment, net, related to our office facilities and fair value of derivative<br />
instruments.<br />
(f) Includes property, plant and equipment, net; goodwill; and intangible assets, net.<br />
See Note 7 for additional operating segment disclosures<br />
related to impairment, store closure costs and the carrying<br />
amount of assets held for sale.<br />
note 24<br />
<strong>Yum</strong>! Brands Inc. 71.<br />
GUARANTEES, COMMITMENTS AND CONTINGENCIES<br />
Lease Guarantees and Contingencies<br />
As a result of (a) assigning our interest in obligations under<br />
real estate leases as a condition to the refranchising of<br />
certain Company restaurants; (b) contributing certain<br />
Company restaurants to unconsolidated affiliates; and<br />
(c) guaranteeing certain other leases, we are frequently<br />
contingently liable on lease agreements. These leases have<br />
varying terms, the latest of which expires in 2030. As of<br />
December 27, 2003 and December 28, 2002, the potential<br />
amount of undiscounted payments we could be required to<br />
make in the event of non-payment by the primary lessee was<br />
$411 million and $426 million, respectively. The present<br />
values of these potential payments discounted at our pretax<br />
cost of debt at December 27, 2003 and December 28,<br />
2002, were $326 million and $310 million, respectively. Our<br />
franchisees are the primary lessees under the vast majority<br />
of these leases. We generally have cross-default provisions<br />
with these franchisees that would put them in default of their<br />
franchise agreement in the event of non-payment under the<br />
lease. We believe these cross-default provisions significantly<br />
reduce the risk that we will be required to make payments<br />
under these leases. Accordingly, the liability recorded for<br />
our exposure under such leases at December 27, 2003 and<br />
December 28, 2002, was not material.<br />
Guarantees Supporting Financial Arrangements of<br />
Certain Franchisees, Unconsolidated Affiliates and Other<br />
Third Parties<br />
At December 27, 2003 and December 28, 2002, we had<br />
provided approximately $32 million of partial guarantees of<br />
two loan pools related primarily to the Company’s historical<br />
refranchising programs and, to a lesser extent, franchisee<br />
development of new restaurants. In support of one of these<br />
guarantees, we have posted $32 million of letters of credit.<br />
We also provide a standby letter of credit of $23 million under<br />
which we could potentially be required to fund a portion of<br />
one of the franchisee loan pools. The total loans outstanding<br />
under these loan pools were approximately $123 million at<br />
December 27, 2003. Any funding under the guarantees or<br />
letters of credit would be secured by the franchisee loans and<br />
any related collateral. We believe that we have appropriately<br />
provided for our estimated probable exposures under these<br />
contingent liabilities. These provisions were primarily charged<br />
to refranchising (gains) losses. New loans are not currently<br />
being added to either loan pool.<br />
We have guaranteed certain lines of credit and loans<br />
of unconsolidated affiliates totaling $28 million and<br />
$26 million at December 27, 2003 and December 28,<br />
2002, respectively. Our unconsolidated affiliates had<br />
total revenues of over $1.5 billion for the year ended<br />
December 27, 2003 and assets and debt of approximately<br />
$858 million and $41 million, respectively, at<br />
December 27, 2003.
72.<br />
We have also guaranteed certain lines of credit, loans<br />
and letters of credit of third parties totaling $8 million and<br />
$15 million at December 27, 2003 and December 28,<br />
2002, respectively. If all such lines of credit and letters<br />
of credit were fully drawn the maximum contingent liability<br />
under these arrangements would be approximately<br />
$25 million as of December 27, 2003 and $27 million as<br />
of December 28, 2002.<br />
We have varying levels of recourse provisions and<br />
collateral that mitigate the risk of loss related to our guarantees<br />
of these financial arrangements of unconsolidated<br />
affiliates and other third parties. Accordingly, our recorded<br />
liability as of December 27, 2003 and December 28, 2002<br />
is not significant.<br />
Insurance Programs<br />
We are self-insured for a substantial portion of our current<br />
and prior years’ coverage including workers’ compensation,<br />
employment practices liability, general liability, automobile<br />
liability and property losses (collectively, “property and<br />
casualty losses”). To mitigate the cost of our exposures<br />
for certain property and casualty losses, we make annual<br />
decisions to self-insure the risks of loss up to defined<br />
maximum per occurrence retentions on a line by line basis<br />
or to combine certain lines of coverage into one loss pool<br />
with a single self-insured aggregate retention. The Company<br />
then purchases insurance coverage, up to a specified limit,<br />
for losses that exceed the self-insurance per occurrence<br />
or aggregate retention. The insurers’ maximum aggregate<br />
loss limits are significantly above our actuarially determined<br />
probable losses; therefore, we believe the likelihood of<br />
losses exceeding the insurers’ maximum aggregate loss<br />
limits is remote.<br />
We are also self-insured for healthcare claims for eligible<br />
participating employees subject to certain deductibles and<br />
limitations. We have accounted for our retained liabilities<br />
for property and casualty losses and healthcare claims,<br />
including reported and incurred but not reported claims,<br />
based on information provided by independent actuaries.<br />
Due to the inherent volatility of actuarially determined<br />
property and casualty loss estimates, it is reasonably<br />
possible that we could experience changes in estimated<br />
losses which could be material to our growth in quarterly<br />
and annual net income. We believe that we have recorded<br />
reserves for property and casualty losses at a level which<br />
has substantially mitigated the potential negative impact<br />
of adverse developments and/or volatility.<br />
Change of Control Severance Agreements<br />
The Company has severance agreements with certain key<br />
executives (the “Agreements”) that are renewable on an<br />
annual basis. These Agreements are triggered by a termination,<br />
under certain conditions, of the executive’s employment<br />
following a change in control of the Company, as defined in<br />
the Agreements. If triggered, the affected executives would<br />
generally receive twice the amount of both their annual base<br />
salary and their annual incentive in a lump sum, a proportionate<br />
bonus at the higher of target or actual performance,<br />
outplacement services and a tax gross-up for any excise<br />
taxes. These Agreements have a three-year term and automatically<br />
renew each January 1 for another three-year term<br />
unless the Company elects not to renew the Agreements. If<br />
these Agreements had been triggered as of December 27,<br />
2003, payments of approximately $38 million would have<br />
been made. In the event of a change of control, rabbi trusts<br />
would be established and used to provide payouts under<br />
existing deferred and incentive compensation plans.<br />
Litigation<br />
We are subject to various claims and contingencies related<br />
to lawsuits, taxes, environmental and other matters arising<br />
out of the normal course of business. Like certain other<br />
large retail employers, the Company has been faced in<br />
certain states with allegations of purported class-wide<br />
wage and hour violations.<br />
On August 29, 1997, a class action lawsuit against<br />
Taco Bell Corp., entitled Bravo, et al. v. Taco Bell Corp.<br />
(“Bravo”), was filed in the Circuit Court of the State of<br />
Oregon of the County of Multnomah. The lawsuit was filed by<br />
two former Taco Bell shift managers purporting to represent<br />
approximately 17,000 current and former hourly employees<br />
statewide. The lawsuit alleged violations of state wage and<br />
hour laws, principally involving unpaid wages including overtime,<br />
and rest and meal period violations, and sought an<br />
unspecified amount in damages. Under Oregon class action<br />
procedures, Taco Bell was allowed an opportunity to “cure”<br />
the unpaid wage and hour allegations by opening a claims<br />
process to all putative class members prior to certification<br />
of the class. In this cure process, Taco Bell paid out less<br />
than $1 million. On January 26, 1999, the Court certified<br />
a class of all current and former shift managers and crew<br />
members who claim one or more of the alleged violations.<br />
A Court-approved notice and claim form was mailed to<br />
approximately 14,500 class members on January 31,<br />
2000. Trial began on January 4, 2001. On March 9, 2001,<br />
the jury reached verdicts on the substantive issues in this<br />
matter. A number of these verdicts were in favor of the<br />
Taco Bell position; however, certain issues were decided in<br />
favor of the plaintiffs. In April 2002, a jury trial to determine<br />
the damages of 93 of those claimants found that Taco Bell<br />
failed to pay for certain meal breaks and/or off-the-clock<br />
work for 86 of the 93 claimants. However, the total amount<br />
of hours awarded by the jury was substantially less than that<br />
sought by the claimants. In July and September 2002, the<br />
court ruled on several post-trial motions, including fixing the<br />
total number of potential claimants at 1,031 (including the<br />
93 claimants for which damages had already been determined)<br />
and holding that claimants who prevail are entitled<br />
to prejudgment interest and penalty wages. The second
damages trial for the remaining 938 claimants began on<br />
July 7, 2003. Before the trial concluded, the parties reached<br />
an agreement to settle this matter in full. The court granted<br />
final approval of the settlement on December 23, 2003 and<br />
final judgment of dismissal was entered on December 26,<br />
2003. Payments to class counsel and eligible claimants<br />
were made in the first quarter of 2004. We have previously<br />
provided for the costs of this settlement as AmeriServe and<br />
other charges (credits).<br />
On January 16, 1998, a lawsuit against Taco Bell Corp.,<br />
entitled Wrench LLC, Joseph Shields and Thomas Rinks v.<br />
Taco Bell Corp. was filed in the United States District Court<br />
for the Western District of Michigan. The lawsuit alleged<br />
that Taco Bell Corp. misappropriated certain ideas and<br />
concepts used in its advertising featuring a Chihuahua.<br />
The plaintiffs sought to recover monetary damages under<br />
several theories, including breach of implied-in-fact contract,<br />
idea misappropriation, conversion and unfair competition.<br />
On June 10, 1999, the District Court granted summary<br />
judgment in favor of Taco Bell Corp. Plaintiffs filed an<br />
appeal with the U.S. Court of Appeals for the Sixth Circuit<br />
(the “Court of Appeals”), and oral arguments were held on<br />
September 20, 2000. On July 6, 2001, the Court of Appeals<br />
reversed the District Court’s judgment in favor of Taco Bell<br />
Corp. and remanded the case to the District Court. Taco Bell<br />
Corp. unsuccessfully petitioned the Court of Appeals for<br />
rehearing en banc, and its petition for writ of certiorari to the<br />
United States Supreme Court was denied on January 21,<br />
2002. The case was returned to District Court for trial<br />
which began on May 14, 2003 and on June 4, 2003 the<br />
jury awarded $30 million to the plaintiffs. Subsequently,<br />
the plaintiffs’ moved to amend the judgment to include prejudgment<br />
interest and post-judgment interest and Taco Bell<br />
filed its post-trial motion for judgment as a matter of law<br />
or a new trial. On September 9, 2003, the District Court<br />
denied Taco Bell’s motion and granted the plaintiff’s motion<br />
to amend the judgment.<br />
In view of the jury verdict and subsequent District<br />
Court ruling, we recorded a charge of $42 million in 2003.<br />
We continue to believe that the Wrench plaintiffs’ claims<br />
are without merit and have appealed the verdict to the<br />
Sixth Circuit Court of Appeals. Post-judgment interest will<br />
continue to accrue during the appeal process.<br />
On July 9, 2003 we filed suit against Taco Bell’s former<br />
advertising agency in the United States District Court for<br />
the Central District of California seeking reimbursement<br />
for any final award that may be ultimately affirmed by the<br />
appeals courts and costs that we have incurred in defending<br />
this matter. We are also seeking reimbursement from our<br />
insurance carriers.<br />
<strong>Yum</strong>! Brands Inc. 73.<br />
Obligations to PepsiCo, Inc. After Spin-off<br />
In connection with the Spin-off, we entered into separation<br />
and other related agreements (the “Separation<br />
Agreements”) governing the Spin-off and our subsequent<br />
relationship with PepsiCo. These agreements provide<br />
certain indemnities to PepsiCo.<br />
Under terms of the agreement, we have indemnified<br />
PepsiCo for any costs or losses it incurs with respect to<br />
all letters of credit, guarantees and contingent liabilities<br />
relating to our businesses under which PepsiCo remains<br />
liable. As of December 27, 2003, PepsiCo remains liable<br />
for approximately $82 million on a nominal basis related<br />
to these contingencies. This obligation ends at the time<br />
PepsiCo is released, terminated or replaced by a qualified<br />
letter of credit. We have not been required to make any<br />
payments under this indemnity.<br />
Included in the indemnities described above are contingent<br />
liabilities on lease agreements of certain non-core<br />
businesses of PepsiCo which were sold prior to the Spinoff.<br />
Two of these businesses, Chevys Mexican Restaurant and<br />
Hot ’n Now filed for bankruptcy protection in October 2003<br />
and January 2004, respectively. While we can not presently<br />
determine our liability under these indemnities, if any, we<br />
do not expect the amount to have a material impact on our<br />
Consolidated Financial Statements. Any related expenses<br />
will be recorded as AmeriServe and other charges (credits)<br />
in our Consolidated Income Statement.<br />
Under the Separation Agreements, PepsiCo maintains<br />
full control and absolute discretion with regard to any<br />
combined or consolidated tax filings for periods through<br />
October 6, 1997. PepsiCo also maintains full control<br />
and absolute discretion regarding any common tax audit<br />
issues. Although PepsiCo has contractually agreed to, in<br />
good faith, use its best efforts to settle all joint interests<br />
in any common audit issue on a basis consistent with prior<br />
practice, there can be no assurance that determinations<br />
made by PepsiCo would be the same as we would reach,<br />
acting on our own behalf. Through December 27, 2003,<br />
there have not been any determinations made by PepsiCo<br />
where we would have reached a different determination.
74.<br />
note 25<br />
SELECTED QUARTERLY FINANCIAL DATA (UNAUDITED)<br />
2003 First Quarter Second Quarter Third Quarter Fourth Quarter Total<br />
Revenues:<br />
Company sales $ 1,597 $ 1,723 $ 1,765 $ 2,356 $ 7,441<br />
Franchise and license fees 205 213 224 297 939<br />
Total revenues 1,802 1,936 1,989 2,653 8,380<br />
Wrench litigation — 35 7 — 42<br />
AmeriServe and other charges (credits) — 2 (3) (25) (26)<br />
Total costs and expenses, net 1,585 1,716 1,720 2,300 7,321<br />
Operating profit 217 220 269 353 1,059<br />
Income before cumulative effect of accounting change 118 122 164 214 618<br />
Cumulative effect of accounting change, net of tax (1) — — — (1)<br />
Net income 117 122 164 214 617<br />
Diluted earnings per common share 0.39 0.40 0.53 0.70 2.02<br />
2002<br />
Revenues:<br />
First Quarter Second Quarter Third Quarter Fourth Quarter Total<br />
Company sales $ 1,426 $ 1,571 $ 1,705 $ 2,189 $ 6,891<br />
Franchise and license fees 188 196 210 272 866<br />
Total revenues 1,614 1,767 1,915 2,461 7,757<br />
AmeriServe and other charges (credits) (11) (9) (4) (3) (27)<br />
Total costs and expenses, net 1,388 1,526 1,657 2,156 6,727<br />
Operating profit 226 241 258 305 1,030<br />
Net income 124 140 147 172 583<br />
Diluted earnings per common share 0.40 0.45 0.47 0.56 1.88<br />
See Note 24 for details of Wrench litigation and Note 7 for details of AmeriServe other charges (credits).
Management’s Responsibility for Financial Statements<br />
To Our Shareholders:<br />
<strong>Yum</strong>! Brands Inc. 75.<br />
We are responsible for the preparation, integrity and fair presentation of the Consolidated Financial Statements, related<br />
notes and other information included in this annual report. The financial statements were prepared in accordance with<br />
accounting principles generally accepted in the United States of America and include certain amounts based upon our<br />
estimates and assumptions, as required. Other financial information presented in the annual report is derived from the<br />
financial statements.<br />
We maintain a system of internal control over financial reporting, designed to provide reasonable assurance as to the<br />
reliability of the financial statements, as well as to safeguard assets from unauthorized use or disposition. The system is<br />
supported by formal policies and procedures, including an active Code of Conduct program intended to ensure employees<br />
adhere to the highest standards of personal and professional integrity. Our internal audit function monitors and reports on<br />
the adequacy of and compliance with the internal control system, and appropriate actions are taken to address significant<br />
control deficiencies and other opportunities for improving the system as they are identified.<br />
The Consolidated Financial Statements have been audited and reported on by our independent auditors, KPMG LLP, who<br />
were given free access to all financial records and related data, including minutes of the meetings of the Board of Directors<br />
and Committees of the Board. We believe that management representations made to the independent auditors were valid<br />
and appropriate.<br />
The Audit Committee of the Board of Directors, which is composed solely of outside directors, provides oversight<br />
to our financial reporting process and our controls to safeguard assets through periodic meetings with our independent<br />
auditors, internal auditors and management. Both our independent auditors and internal auditors have free access to the<br />
Audit Committee.<br />
Although no cost-effective internal control system will preclude all errors and irregularities, we believe our controls as<br />
of December 27, 2003 provide reasonable assurance that our assets are reasonably safeguarded.<br />
David J. Deno<br />
Chief Financial Officer
76.<br />
Report of Independent Auditors<br />
The Board of Directors<br />
YUM! Brands, Inc.:<br />
We have audited the accompanying consolidated balance sheets of YUM! Brands, Inc. and Subsidiaries (“YUM”) as of<br />
December 27, 2003 and December 28, 2002, and the related consolidated statements of income, cash flows and shareholders’<br />
equity (deficit) and comprehensive income for each of the years in the three-year period ended December 27, 2003.<br />
These consolidated financial statements are the responsibility of YUM’s management. Our responsibility is to express an<br />
opinion on these consolidated financial statements based on our audits.<br />
We conducted our audits in accordance with auditing standards generally accepted in the United States of America.<br />
Those standards require that we plan and perform the audit to obtain reasonable assurance about whether the financial<br />
statements are free of material misstatement. An audit includes examining, on a test basis, evidence supporting the<br />
amounts and disclosures in the financial statements. An audit also includes assessing the accounting principles used<br />
and significant estimates made by management, as well as evaluating the overall financial statement presentation. We<br />
believe that our audits provide a reasonable basis for our opinion.<br />
In our opinion, the consolidated financial statements referred to above present fairly, in all material respects, the<br />
financial position of YUM as of December 27, 2003 and December 28, 2002, and the results of its operations and its cash<br />
flows for each of the years in the three-year period ended December 27, 2003, in conformity with accounting principles<br />
generally accepted in the United States of America.<br />
As discussed in Notes 2 and 12 to the consolidated financial statements, YUM adopted the provisions of the Financial<br />
Accounting Standards Board’s Statement of Financial Accounting Standards No. 142, “Goodwill and Other Intangible<br />
Assets,” in 2002.<br />
KPMG LLP<br />
Louisville, Kentucky<br />
February 10, 2004
Selected Financial Data<br />
<strong>Yum</strong>! Brands Inc. 77.<br />
Fiscal Year<br />
(in millions, except per share and unit amounts) 2003 2002 2001 2000 1999<br />
Summary of Operations<br />
Revenues<br />
Company sales (a) $ 7,441 $ 6,891 $ 6,138 $ 6,305 $ 7,099<br />
Franchise and license fees 939 866 815 788 723<br />
Total 8,380 7,757 6,953 7,093 7,822<br />
Facility actions (b) (36) (32) (1) 176 381<br />
Wrench litigation (c) (42) — — — —<br />
AmeriServe and other (charges) credits (d) 26 27 3 (204) (51)<br />
Operating profit 1,059 1,030 891 860 1,240<br />
Interest expense, net<br />
Income before income taxes and cumulative effective of<br />
173 172 158 176 202<br />
accounting change 886 858 733 684 1,038<br />
Income before cumulative effect of accounting change 618 583 492 413 627<br />
Cumulative effect of accounting change, net of tax (e) (1) — — — —<br />
Net income 617 583 492 413 627<br />
Basic earnings per common share (f) 2.10 1.97 1.68 1.41 2.05<br />
Diluted earnings per common share (f) 2.02 1.88 1.62 1.39 1.96<br />
Cash Flow Data<br />
Provided by operating activities $ 1,053 $ 1,088 $ 832 $ 491 $ 565<br />
Capital spending, excluding acquisitions 663 760 636 572 470<br />
Proceeds from refranchising of restaurants 92 81 111 381 916<br />
Balance Sheet<br />
Total assets $ 5,620 $ 5,400 $ 4,425 $ 4,149 $ 3,961<br />
Long-term debt 2,056 2,299 1,552 2,397 2,391<br />
Total debt 2,066 2,445 2,248 2,487 2,508<br />
Other Data<br />
Number of stores at year end<br />
Company 7,854 7,526 6,435 6,123 6,981<br />
Unconsolidated Affiliates 1,512 2,148 2,000 1,844 1,178<br />
Franchisees 21,471 20,724 19,263 19,287 18,414<br />
Licensees 2,362 2,526 2,791 3,163 3,409<br />
System 33,199 32,924 30,489 30,417 29,982<br />
U.S. Company blended same store sales growth (g) — 2% 1% (2)% 4%<br />
International system sales growth (h)<br />
Reported 14% 8% 1% 6% 10%<br />
Local currency (i) 7% 9% 8% 8% 8%<br />
Shares outstanding at year end (f) 292 294 293 293 302<br />
Market price per share at year end (f) $ 33.64 $ 24.12 $ 24.62 $ 16.50 $ 18.97<br />
Fiscal years 2003, 2002, 2001 and 1999 include 52 weeks and fiscal year 2000 includes 53 weeks. From May 7, 2002, fiscal year 2002 included Long John Silver’s (“LJS”)<br />
and A&W All-American Food Restaurants (“A&W”), which were added when we acquired Yorkshire Global Restaurants, Inc. Fiscal year 2002 includes the impact of the adoption<br />
of Statement of Financial Accounting Standards (“SFAS”) No. 142, “Goodwill and Other Intangible Assets” (“SFAS 142”). See Note 12 to the Consolidated Financial Statements<br />
for further discussion. The selected financial data should be read in conjunction with the Consolidated Financial Statements and the Notes thereto.<br />
(a) The decline in Company sales through 2001 was largely the result of our refranchising initiatives.<br />
(b) See Note 7 to the Consolidated Financial Statements for a description of Facility actions in 2003, 2002 and 2001.<br />
(c) See Note 24 to the Consolidated Financial Statements for a description of Wrench litigation in 2003.<br />
(d) See Note 7 to the Consolidated Financial Statements for a description of AmeriServe and other charges (credits) in 2003, 2002 and 2001.<br />
(e) Fiscal year 2003 includes the impact of the adoption of SFAS No. 143, “Accounting for Asset Retirement Obligations” (“SFAS 143”). See Note 2 to the Consolidated<br />
Financial Statements for further discussion.<br />
(f) Per share and share amounts have been adjusted to reflect the two-for-one stock split distributed on June 17, 2002.<br />
(g) U.S. Company blended same-store sales growth includes the results of Company owned KFC, Pizza Hut and Taco Bell restaurants that have been open one year or more. LJS<br />
and A&W are not included.<br />
(h) International system sales growth includes the results of all international restaurants regardless of ownership, including Company owned, franchise, unconsolidated affiliate<br />
and license restaurants. Sales of franchise, unconsolidated affiliate and license restaurants generate franchise and license fees for the Company (typically at a rate of 4%<br />
to 6% of sales). Franchise, unconsolidated affiliate and license restaurant sales are not included in Company sales we present on the Consolidated Statements of Income;<br />
however, the fees are included in the Company’s revenues.<br />
(i) Local currency is prior to foreign currency conversion to U.S. dollars.
78.<br />
Board of Directors Senior Officers<br />
David C. Novak 51<br />
Chairman, Chief Executive Offi cer and President,<br />
<strong>Yum</strong>! Brands, Inc.<br />
Andrall E. Pearson 77<br />
Founding Chairman, <strong>Yum</strong>! Brands, Inc.<br />
James Dimon 48<br />
Chairman and Chief Executive Offi cer, Bank One Corporation<br />
Massimo Ferragamo 46<br />
President and Vice Chairman, Ferragamo USA, Inc.,<br />
a subsidiary of Salvatore Ferragamo Italia<br />
J. David Grissom 65<br />
Chairman, Mayfair Capital, Inc., a private investment fi rm<br />
Bonnie G. Hill 62<br />
Chairman and President, B. Hill Enterprises, LLC<br />
Robert Holland, Jr. 63<br />
Former owner and Chief Executive Offi cer,<br />
WorkPlace Integrators, Michigan’s largest<br />
Steelcase offi ce furniture dealer<br />
Sidney Kohl 73<br />
Former Chairman, Kohl’s Supermarkets,<br />
Founder, Kohl’s Department Stores<br />
Kenneth Langone 67<br />
Founder, Chairman of the Board and Chief Executive Offi cer,<br />
Invemed Associates, LLC, an investment banking fi rm,<br />
Founder, Home Depot, Inc.<br />
Thomas M. Ryan 51<br />
Chairman, President and Chief Executive Offi cer of<br />
CVS Corporation and CVS Pharmacy, Inc.<br />
Jackie Trujillo 68<br />
Chairman of the Board, Harman Management Corporation<br />
Robert J. Ulrich 60<br />
Chairman and Chief Executive Offi cer, Target Corporation<br />
and Target Stores<br />
David C. Novak 51<br />
Chairman, Chief Executive Offi cer and President,<br />
<strong>Yum</strong>! Brands, Inc.<br />
Peter A. Bassi 54<br />
Chairman, <strong>Yum</strong>! Restaurants International<br />
Jonathan D. Blum 45<br />
Senior Vice President, Public Affairs, <strong>Yum</strong>! Brands, Inc.<br />
Emil J. Brolick 56<br />
Pesident and Chief Concept Offi cer, Taco Bell, U.S.A.<br />
Jared E. Buss 61<br />
Chief Operating Offi cer, Pizza Hut, U.S.A.<br />
Anne P. Byerlein 45<br />
Chief People Offi cer, <strong>Yum</strong>! Brands, Inc.<br />
Christian L. Campbell 53<br />
Senior Vice President, General Counsel, Secretary and<br />
Chief Franchise Policy Offi cer, <strong>Yum</strong>! Brands, Inc.<br />
Steven A. Davis 45<br />
President and Chief Executive Offi cer, Long John Silver’s, Inc. and<br />
Chief Executive Offi cer, A&W Restaurants, Inc.<br />
Gregg R. Dedrick 44<br />
President and Chief Concept Offi cer, KFC, U.S.A.<br />
David J. Deno 46<br />
Chief Financial Offi cer, <strong>Yum</strong>! Brands, Inc.<br />
Peter R. Hearl 52<br />
President and Chief Concept Offi cer, Pizza Hut, U.S.A.<br />
Robert C. Kreidler 40<br />
Senior Vice President, Mergers and Acquisitions<br />
and Treasurer, <strong>Yum</strong>! Brands, Inc.<br />
Aylwin B. Lewis 49<br />
President, Chief <strong>Multibranding</strong> and<br />
Operating Offi cer, <strong>Yum</strong>! Brands, Inc.<br />
Tony Mastropaolo 40<br />
Chief Operating Offi cer, KFC, U.S.A.<br />
Gregory N. Moore 54<br />
Senior Vice President and Controller, <strong>Yum</strong>! Brands, Inc.<br />
Charles E. Rawley, III 53<br />
Chief Development Offi cer, <strong>Yum</strong>! Brands, Inc.<br />
Rob Savage 42<br />
Chief Operating Offi cer, Taco Bell, U.S.A.
Shareholder Information<br />
Annual Meeting The Annual Meeting of Shareholders will be<br />
held at <strong>Yum</strong>! Brands’ headquarters, Louisville, Kentucky, at<br />
9:00 a.m. (EDT), Thursday, May 20, 2004. Proxies for the<br />
meeting will be solicited by an independent proxy solicitor.<br />
This Annual Report is not part of the proxy solicitation.<br />
INQUIRIES REGARDING YOUR YUM! HOLDINGS<br />
Registered Shareholders (those who hold YUM shares<br />
in their own names) should address communications<br />
concerning statements, address changes, lost certificates<br />
and other administrative matters to:<br />
American Stock Transfer & Trust Company<br />
59 Maiden Lane<br />
Plaza Level<br />
New York, NY 10038<br />
Phone: (888) 439-4986<br />
www.amstock.com<br />
or<br />
Shareholder Coordinator<br />
<strong>Yum</strong>! Brands, Inc.<br />
1441 Gardiner Lane, Louisville, KY 40213<br />
Phone: (888) 298-6986<br />
E-mail: yum.investor@yum.com<br />
In all correspondence or phone inquires, please provide your<br />
name, your Social Security Number, and your YUM account<br />
number if you know it.<br />
Registered Shareholders can access their accounts and<br />
complete the following functions online at the Web site of<br />
American Stock Transfer & Trust (“AST”).<br />
Access account balance and other general account<br />
information<br />
Change an account’s mailing address<br />
View a detailed list of holdings represented by certificates<br />
and the identifying certificate numbers<br />
Request a certificate for shares held by AST<br />
Replace a lost or stolen certificate<br />
Retrieve a duplicate Form 1099-B<br />
Purchase shares of YUM through the Company’s direct<br />
stock purchase plan<br />
Sell shares held by AST<br />
<strong>Yum</strong>! Brands Inc. 79.<br />
Access accounts online at the following URL:<br />
https://secure.amstock.com/Shareholder/sh_login.asp.<br />
Your account number and Social Security Number are<br />
required. If you do not know your account number, please<br />
call AST at (888) 439-4986 or YUM Shareholder Coordinator<br />
at (888) 298-6986. You may also request a Personal<br />
Identification Number (PIN) to access your account at<br />
the same URL. For security purposes, PINs are mailed to<br />
shareholders.<br />
Beneficial Shareholders (those who hold YUM shares in the<br />
name of a bank or broker) should direct communications on<br />
all administrative matters to their stockbroker.<br />
YUMBUCKS and SharePower Participants (employees with<br />
YUMBUCKS options or SharePower options) should address<br />
all questions regarding your account, outstanding options<br />
or shares received through option exercises to:<br />
Merrill Lynch/SharePower<br />
Stock Option Plan Services<br />
P.O. Box 30446<br />
New Brunswick, NJ 08989-0446<br />
Phone: (800) 637-2432 (U.S.A., Puerto Rico and Canada)<br />
(732) 560-9444 (all other locations)<br />
In all correspondence, please provide your account number<br />
(for U.S. citizens, this is your Social Security Number),<br />
your ad dress, your telephone number and mention either<br />
YUMBUCKS or SharePower. For telephone inquiries, please<br />
have a copy of your most recent statement available.<br />
Employee Benefit Plan Participants<br />
Direct Stock Purchase Program . . . . . . . (888) 439-4986<br />
YUM 401(k) Plan . . . . . . . . . . . . . . . . . (888) 875-4015<br />
YUM Savings Center . . . . . . (617) 847-1013 (outside U.S.)<br />
P.O. Box 1389<br />
Boston, MA 02104-1389<br />
Please have a copy of your most recent statement available<br />
when calling. Press *0 for a customer service representative<br />
and give the representative the name of the plan.
80.<br />
Shareholder Services<br />
Direct Stock Purchase Plan A prospectus and a brochure<br />
explaining this convenient plan are available from our<br />
transfer agent:<br />
American Stock Transfer & Trust Company<br />
P.O. Box 922<br />
Wall Street Station<br />
New York, NY 10269-0560<br />
Attn: DRIP Dept.<br />
Phone: (888) 439-4986<br />
Low-Cost Investment Plan Investors may purchase their<br />
initial shares of stock through NAIC’s Low-Cost Investment<br />
Plan. For details contact:<br />
National Association of Investors Corporation (NAIC)<br />
711 West Thirteen Mile Road<br />
Madison Heights, Ml 48071<br />
Phone: (877) ASK-NAIC (275-6242)<br />
www.better-investing.org<br />
Financial and Other Information Earnings and other<br />
financial results, corporate news, corporate governance<br />
information and other company information are available<br />
on <strong>Yum</strong>! Brands’ Web site: www.yum.com<br />
Copies of <strong>Yum</strong>! Brands’ SEC Forms 8-K, 10-K and<br />
10-Q and quarterly earnings releases are available<br />
free of charge. Contact <strong>Yum</strong>! Brands’ Shareholder<br />
Relations at (888) 2YUMYUM (298-6986) or e-mail<br />
yum.investor@yum.com<br />
Securities analysts, portfolio managers, representatives<br />
of financial institutions and other individuals with<br />
questions regarding <strong>Yum</strong>! Brands’ performance are invited<br />
to contact:<br />
Tim Jerzyk<br />
Vice President, Investor Relations<br />
<strong>Yum</strong>! Brands, Inc.<br />
1441 Gardiner Lane<br />
Louisville, KY 40213<br />
Phone: (888) 298-6986<br />
Independent Auditors<br />
KPMG LLP<br />
400 West Market Street, Suite 2600<br />
Louisville, KY 40202<br />
Phone: (502) 587-0535<br />
CAPITAL STOCK INFORMATION<br />
Stock Trading Symbol—YUM<br />
The New York Stock Exchange is the principal market for<br />
YUM Common Stock.<br />
Shareholders At year-end 2003, YUM! Brands had approximately<br />
102,000 registered shareholders of record of YUM<br />
common stock.<br />
Dividend Policy <strong>Yum</strong>! Brands does not currently pay dividends.<br />
FRANCHISE INQUIRIES<br />
Domestic Franchising Inquiry Phone Line<br />
(866) 2YUMYUM (298-6986)<br />
International Franchising Inquiry Phone Line<br />
(972) 338-8100 ext. 4480<br />
Online Franchise Information<br />
http://www.yum.com/franchising/info.htm<br />
<strong>Yum</strong>! Brands’ Annual Report contains many of the valuable trademarks<br />
owned and used by <strong>Yum</strong>! Brands and subsidiaries and affiliates in the<br />
United States and worldwide.<br />
Printed on recycled paper.
“power”of<br />
giving back<br />
HARVEST<br />
At <strong>Yum</strong>! Brands, we believe that the power of giving back to the community is making a difference<br />
in the lives of our customers and their families. While we commit ourselves to making a<br />
difference by financially supporting hundreds and hundreds of charities across the globe, our<br />
efforts are primarily focused on nourishing the bodies, minds and souls of children in need. We<br />
do this through programs dedicated to hunger relief, daycare subsidies, reading incentives and<br />
mentoring at-risk teens. From Europe to Asia to South America, we’re committed to improving<br />
the lives of the customers we serve.<br />
Here’s a brief snapshot of the work that is underway:<br />
Nourishing Bodies: <strong>Yum</strong>! Harvest In America alone, one in ten children under the age of five runs<br />
the risk of going to bed hungry every night. One in ten. So we decided to do something about this<br />
and have created the world’s largest prepared food recovery program. We now donate millions of<br />
pounds of prepared food to the hungry. Food that has nutritional value and will provide nourishment<br />
to those most in need, the underprivileged.<br />
Nourishing Young Minds: Pizza Hut’s Book It! For nearly 20 years, Pizza Hut has provided an<br />
incentive for elementary aged children to learn to read. More than 22 million students a year, in<br />
900,000 classrooms, participate in Book It! The program is relied on year after year by teachers<br />
in 50,000 schools — nearly 70% of the nation’s elementary schools — so that young minds are<br />
nourished with books.<br />
Nourishing Souls: KFC’s Colonel’s Kids With more and more double-income and single-parent<br />
households, finding safe, affordable high-quality child care has become an increasing burden.<br />
That’s why KFC established the Colonel’s Kids Charity. Today, we help fund extended-hour and<br />
infant/toddler child care programs across the country for the millions of people who work “after<br />
hours” or on weekends. Since 2000, more than $3 million has been awarded to YMCA Child Care<br />
Centers nationwide.<br />
Taco Bell’s TEENSupreme Through a unique partnership with the Boys & Girls Clubs of America,<br />
Taco Bell has established a mentoring program for at-risk teens, offering a safe haven and recreational<br />
activities to keep kids off the street. To date, over $13 million has been donated to the<br />
Boys & Girls Clubs for TEENSupreme programming.
YUM! BRANDS 2003 ANNUAL CUSTOMER MANIA REPORT<br />
Alone we’re delicious. Together we’re<br />
<strong>Yum</strong>! <strong>Yum</strong>! <strong>Yum</strong>! <strong>Yum</strong>! <strong>Yum</strong>! <strong>Yum</strong>! <strong>Yum</strong>! <strong>Yum</strong>! <strong>Yum</strong>! <strong>Yum</strong>! <strong>Yum</strong>! <strong>Yum</strong>! <strong>Yum</strong>! <strong>Yum</strong>! <strong>Yum</strong>! <strong>Yum</strong>! <strong>Yum</strong>! <strong>Yum</strong>! <strong>Yum</strong>! <strong>Yum</strong>! <strong>Yum</strong>! <strong>Yum</strong>! <strong>Yum</strong>! <strong>Yum</strong>! <strong>Yum</strong>! <strong>Yum</strong>! <strong>Yum</strong>! <strong>Yum</strong>! <strong>Yum</strong>! <strong>Yum</strong>! <strong>Yum</strong>! <strong>Yum</strong>! <strong>Yum</strong>! <strong>Yum</strong>! <strong>Yum</strong>! <strong>Yum</strong>! <strong>Yum</strong>! <strong>Yum</strong>! <strong>Yum</strong>!