2000 Annual Report - Yum!
2000 Annual Report - Yum!
2000 Annual Report - Yum!

You also want an ePaper? Increase the reach of your titles
YUMPU automatically turns print PDFs into web optimized ePapers that Google loves.
<strong>2000</strong> <strong>Annual</strong> <strong>Report</strong><br />
TRICON GLOBAL RESTAURANTS, INC.<br />
®<br />
TM<br />
®
Contents<br />
1 Dear Partners<br />
6 Customer Mania!<br />
8 International<br />
12 Pizza Hut<br />
16 KFC<br />
20 Taco Bell<br />
24 Tricon Facts<br />
26 Financials<br />
Financial Highlights<br />
(in millions, except per share and unit amounts)<br />
Number of stores: <strong>2000</strong> 1999 % B(W)<br />
Company 6,123 6,981 (12)<br />
Affiliates 1,844 1,178 57<br />
Franchisees 19,287 18,414 5<br />
Licensees 3,163 3,409 (7)<br />
Total stores 30,417 29,982 1<br />
System sales $22,159 $21,762 2<br />
Company revenues $÷7,093 $÷7,822 (9)<br />
Ongoing operating profit $÷÷«888 $÷÷«881 1<br />
Accounting changes $÷÷÷÷«– $÷÷÷«29 NM<br />
Facility actions net gain $÷÷«176 $÷÷«381 (54)<br />
Unusual items $÷÷(204) $÷÷÷(51) NM<br />
Operating profit $÷÷«860 $÷1,240 (31)<br />
Net income $÷÷«413 $÷÷«627 (34)<br />
Diluted earnings per common share $÷÷2.77 $÷÷3.92 (29)<br />
Diluted ongoing earnings per common share $÷÷2.98 $÷÷2.58 16<br />
Cash flows provided by:<br />
Operating activities $÷÷«491 $÷÷«565 (13)<br />
Refranchising proceeds $÷÷«381 $÷÷«916 (58)<br />
Average U.S. Sales Per System Unit<br />
(in thousands)<br />
<strong>2000</strong> 1999 1998 1997 1996<br />
5-year<br />
growth(a)<br />
KFC $823 $837 $817 $786 $775 2%<br />
Pizza Hut 712 696 645 630 620 2%<br />
Taco Bell 896 918 931 902 886 (1)%<br />
(a) Compounded annual growth rate<br />
Worldwide System Sales<br />
(in billions)<br />
<strong>2000</strong> 1999 1998 1997 1996<br />
5-year<br />
growth(a)<br />
KFC $÷4.4 $÷4.3 $÷4.2 $÷4.0 $÷3.9 4%<br />
Pizza Hut 5.0 5.0 4.8 4.7 4.9 –<br />
Taco Bell 5.1 5.2 5.0 4.8 4.6 3%<br />
Total U.S. 14.5 14.5 14.0 13.5 13.4 2%<br />
Total International 7.7 7.3 6.6 7.0 6.9 3%<br />
Total $22.2 $21.8 $20.6 $20.5 $20.3 2%<br />
(a) Compounded annual growth rate
Dear Partners<br />
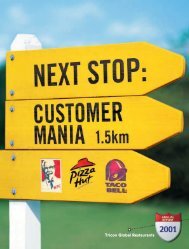
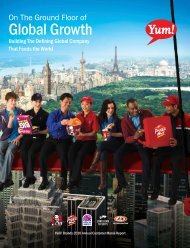
As you’ll see on the front cover, we’re a company on a global mission.<br />
From Mexico to Malaysia, and Boston to Bangkok, we’ve become obsessed –<br />
even maniacal – about satisfying customers better than any other restaurant<br />
company in the world.<br />
Our PASSION is to put a YUM on people’s faces around the world…we offer that<br />
special eating experience that makes you smile and creates lifelong customers.<br />
We’ll do that with: food you crave…comeback value…and customer-focused teams.<br />
It’s been said the true test of any great company is how it<br />
responds to a difficult and challenging year. There’s no ques-<br />
tion that <strong>2000</strong> was just that kind of year for Tricon, and<br />
we’re confident the way we responded will make us stronger<br />
in 2001 and beyond.<br />
For the full year <strong>2000</strong>, we achieved 16% growth in<br />
ongoing operating earnings per share, driven by strong<br />
performance at our International business, continued same<br />
store sales growth at Pizza Hut and by significant reductions<br />
in overhead, interest expense and the ongoing operating tax<br />
rate. While 16% growth is nothing to sneeze at, it fell well<br />
below our expectations for the year because of a decline of<br />
2% in U.S. blended same store sales, driven by a 5% decline<br />
at Taco Bell and 3% decline at KFC.<br />
The year was further complicated by the bankruptcy of<br />
AmeriServe, our primary food distributor. Our team worked<br />
around the clock to arrange for interim financing and to set<br />
Our jobs are the best in the world for people who are committed to<br />
quality food and satisfying customers better than anyone.<br />
David C. Novak<br />
Chairman and Chief Executive Officer
Tricon’s International<br />
business represents<br />
about one-third<br />
of our profits. We<br />
opened 929 new traditional<br />
restaurants<br />
internationally, driven<br />
by the significant<br />
growth of our Asia-<br />
Pacific businesses.<br />
up a new system to pay our vendors on time. This allowed us<br />
to continue to satisfy our customers by keeping our restau-<br />
rants open and having product available. That’s behind us<br />
now as we achieved the best possible outcome when McLane<br />
Company, Inc. finalized its purchase of AmeriServe. McLane,<br />
a division of Wal-Mart, is a financially solid, world-class<br />
distributor with a proven track record of excellent service.<br />
While this situation cost us significant financial and human<br />
capital, it also showed that we can weather even the most<br />
difficult times because of our financial strength and the capa-<br />
bility of our people.<br />
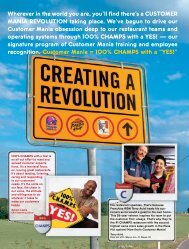
Our focus now is to put 100% of our efforts toward achiev-<br />
ing our superordinate business objective: sustainable sales<br />
growth. This means we have to become maniacal about doing<br />
a better job of satisfying customers, which will enable us<br />
to drive same store sales growth and add new units around<br />
2 TRICON GLOBAL RESTAURANTS<br />
the globe. In fact, we are striving to build a global restaurant<br />
system of over 725,000 Customer Maniacs, team members<br />
who are obsessed to go the extra mile to make sure we put<br />
a YUM on our customers’ faces every time they eat our food.<br />
This is the key to sales and profitability.<br />
In this report, the presidents of KFC, Pizza Hut, Taco Bell<br />
and Tricon Restaurants International will share with you what<br />
they are doing to drive sustainable sales growth and bring cus-<br />
tomer mania to life. Customer mania is taking hold!<br />
Going forward, we will continue to report on five key<br />
areas of our business that we believe are important to measur-<br />
ing our growth and progress in becoming a unique restaurant<br />
company and a great investment. During <strong>2000</strong>, we made sub-<br />
stantial progress in all these areas except U.S. blended same<br />
store sales growth.
1. International Expansion<br />
Our International business now represents about a third<br />
of our profits and we have only scratched the surface of<br />
our development opportunity. In <strong>2000</strong>, we opened a record<br />
929 new traditional units. We are confident we will be able<br />
to at least repeat this pace of development in 2001, and in<br />
years to come. To put the profit opportunity into perspective,<br />
McDonald’s makes over a billion dollars a year in Europe<br />
alone. That’s more than what all of Tricon makes today. And<br />
the only serious international restaurant brands are KFC,<br />
Pizza Hut and McDonald’s. Our two global brands, KFC<br />
and Pizza Hut, are universally accepted by our customers<br />
around the world. Led by Pete Bassi, we have the people,<br />
infrastructure and processes in place to drive consistent<br />
mid-teens profit growth from here on out.<br />
2. Blended U.S. Sales Growth<br />
We have three category-leading brands, and we believe that<br />
over time, having a portfolio of brands reduces our exposure<br />
to temporary ups and downs of a single brand and will enable<br />
us to deliver consistent same store sales growth. That’s why<br />
blended same store sales growth is a good way to measure<br />
our progress. This represents our number one challenge as<br />
blended same store sales declined 2% in <strong>2000</strong> after two years<br />
of 4% growth. To upgrade our<br />
concept leadership, we success-<br />
fully recruited Emil Brolick<br />
from Wendy’s and Cheryl<br />
Bachelder from Domino’s to<br />
be Presidents of Taco Bell and<br />
KFC, respectively. Both of<br />
these executives have proven<br />
track records for driving sus-<br />
tainable same store sales growth<br />
and building customer-focused<br />
organizations. They will join<br />
Mike Rawlings of Pizza Hut to lead our efforts to increase<br />
our focus on running great restaurants and differentiating<br />
our brands in everything we do. Our average unit volumes<br />
are about half of McDonald’s and we are not capacity con-<br />
strained. There is no doubt that we have significant sales<br />
opportunity at each brand.<br />
3. Multibranding<br />
Multibranding is putting two or even three of our brands in<br />
one restaurant asset. We now are the world’s multibranding<br />
leader with a business that accounts for $1 billion in annual<br />
system sales. We want you to know why we are so enthusiastic<br />
about multibranding. First and most important, it’s a huge<br />
customer win. Customers tell us time and again that they<br />
prefer having more than one of our brands in the same asset<br />
because it gives them more choices for the entire family.<br />
Next, we generate higher cash flow per unit in multibranded<br />
units. And finally, we are able to add new restaurants in trade<br />
areas that we could not penetrate with a single brand. These<br />
are trade areas where the real estate is expensive, as in the<br />
Northeast, or in rural areas where there are not enough people<br />
to support just one brand. This gives us the ability to further<br />
expand our leading brands effectively with good returns. For<br />
example, of the 509 U.S. traditional units we opened in <strong>2000</strong>,<br />
Tricon leads the<br />
industry with multibranded<br />
restaurants,<br />
resulting in a business<br />
that represents<br />
$1 billion in annual<br />
system sales.<br />
TRICON GLOBAL RESTAURANTS 3
120 were multibranded.<br />
Without multibranding, in<br />
many cases we would not have<br />
been able to open these units<br />
and generate good returns.<br />
The biggest news for us in<br />
<strong>2000</strong> was the development of<br />
Personal Pan Pizza Express, which allows us to provide our<br />
customers individual size pizzas through Taco Bell and KFC<br />
drive-thrus. Drive-thru pizza on demand is a breakthrough<br />
in the category. We plan to add 280 Personal Pan Pizza<br />
Expresses to new or existing restaurants this year and will<br />
continue to add units as our operating capability allows.<br />
What’s more, we have had good success testing Taco Bells<br />
in rural Pizza Huts and have a test agreement with KFC<br />
and A&W that is generating strong results. We are now the<br />
world’s leader in multibranding, and we know leading the<br />
way in multibranding will pay huge dividends for our share-<br />
holders down the road.<br />
“We plan to add 280<br />
Personal Pan Pizza<br />
Expresses to new and<br />
existing units this year<br />
that allow us to provide<br />
our customers<br />
individual size pizzas<br />
through Taco Bell and<br />
KFC drive-thrus.”<br />
“Over the last three years, it has been my privilege<br />
to serve as Tricon’s first Chairman and CEO. Last year,<br />
the Board of Directors named David Novak CEO.<br />
On January 1, 2001, David assumed the additional<br />
responsibility of Chairman. I can think of no finer<br />
person to lead Tricon into the future than my partner,<br />
David Novak. I will remain active in the operation of<br />
the business as well as serving<br />
on Tricon’s Board of Directors.<br />
I’m enthusiastic about Tricon’s<br />
opportunities ahead as we build<br />
on the progress begun these<br />
last few years.”<br />
Andrall E. Pearson<br />
Founding Chairman<br />
4 TRICON GLOBAL RESTAURANTS<br />
4. Franchise Fees<br />
We now generate about $800 million per year in franchise<br />
fees, up almost 40% in three years. What’s more, our fran-<br />
chise partners are expanding around the world. Franchisees<br />
and affiliates opened over 1,000 restaurants and acquired<br />
over 700 restaurants from Tricon in <strong>2000</strong>. All in all, we have<br />
refranchised over 3,000 U.S. restaurants in the last three<br />
years, including more than 500 KFCs, 1,500 Pizza Huts<br />
and nearly 1,000 Taco Bells – generating about $1.4 billion<br />
in net proceeds after tax. The refranchising program has been<br />
a major success and has dramatically improved our returns.<br />
We will wind down our refranchising program by the end of<br />
2001. There continues to be significant demand to buy and<br />
build new restaurants because of the power of our leading<br />
brand names. It should be noted, however, that certain of<br />
our Taco Bell franchisees are experiencing financial difficulty<br />
because of soft sales. We are proactively working with these<br />
franchisees to restructure debt and ensure operational viabil-<br />
ity. We believe these issues will be resolved in 2001.<br />
5. Cash Flow<br />
Tricon generated $850 million of cash prior to investment<br />
this year. Our objective is to turn this strong cash flow into<br />
high returns. Here we have made huge progress with our
eturn on invested capital improving to<br />
18%, which we believe leads the industry and<br />
is up 10 percentage points from 1997. In <strong>2000</strong>,<br />
we invested in 370 new company restaurants,<br />
upgraded and remodeled 289 company restau-<br />
rants, handled the AmeriServe problem and<br />
purchased over $200 million of our shares.<br />
We are confident we will continue to drive high<br />
returns going forward.<br />
Stepping back, we are a significantly stronger<br />
company now than we were when we were spun<br />
off by PepsiCo three years ago. We’ve more than<br />
doubled ongoing operating earnings per share,<br />
reduced debt by $2.2 billion, improved restau-<br />
rant margins over 3 full points, reduced our<br />
general and administrative expenses over $50 million,<br />
Return on Invested Capital<br />
8%<br />
12%<br />
17%<br />
97 98 99 00<br />
18%<br />
improved ongoing operating<br />
profit 32% and grown system<br />
sales 8%, while closing almost<br />
3,000 stores systemwide that<br />
did not generate adequate<br />
returns and reflect the proper<br />
image for our brands.<br />
As a result of Tricon’s strong<br />
cash flow and financial condi-<br />
tion, our Board of Directors has<br />
authorized a share repurchase<br />
program of up to an additional<br />
$300 million to be executed<br />
over the next two years. This is obviously a reflection of the<br />
confidence the Board has in our outlook for 2001 and beyond.<br />
Just as important, we’re confident we have put the building<br />
blocks in place to drive consistent performance. There<br />
is no doubt in our minds that Tricon has all the characteristics<br />
to become one of the world’s great companies over time:<br />
leading brands, a proven international business, tremendous<br />
Tricon has made solid financial progress since spin-off<br />
Better (worse)<br />
System Sales +8%<br />
In billions<br />
22.2<br />
20.5<br />
97 00<br />
Restaurant<br />
Margin +3.5ppts.<br />
In percentage points<br />
15.1<br />
11.6<br />
97 00<br />
Co. Ownership 14%<br />
In percent<br />
34%<br />
97 00<br />
G&A Expense<br />
Declined 8%<br />
In millions<br />
956<br />
20%<br />
879<br />
97 00<br />
cash flow for reinvestment and the leaders around the world<br />
to make it happen. We are targeting to consistently deliver<br />
2% to 3% U.S. blended same store sales growth, open more<br />
than 1,300 new worldwide restaurants each year, continue<br />
to improve our industry competitive margins and deliver<br />
mid-teens ongoing operating earnings per share growth.<br />
As you read further, you’ll learn more about the exciting<br />
plans at each of our companies from their presidents and<br />
you’ll see how passionate our people are to become Customer<br />
Maniacs. We know that by building the capability of our<br />
people, customer mania will result and the profitability<br />
that will make Tricon a great investment will follow. I’d like<br />
to thank the over 725,000 people across the Tricon system,<br />
our investors, franchise partners and outstanding Board of<br />
Directors for their dedication and inspired ideas.<br />
David C. Novak<br />
Chairman and Chief Executive Officer<br />
Franchise Fees +36%<br />
In millions<br />
788<br />
578<br />
97 00<br />
Ongoing Operating<br />
Profit +32%<br />
In millions<br />
888<br />
672<br />
97 00<br />
Debt Reduction 2.2bn<br />
In billions<br />
4.7<br />
2.5<br />
97 00<br />
Ongoing Operating<br />
EPS +110%<br />
In dollars<br />
2.98<br />
1.42<br />
97 00<br />
TRICON GLOBAL RESTAURANTS 5
“ On behalf of all the restaurant operators around<br />
the world, we want all of our shareholders to know we’re<br />
committed to one thing – building an operating culture<br />
where everything is centered on our customers. Together,<br />
we’re creating a force of over 725,000 CUSTOMER MANIACS<br />
in KFC, Pizza Hut and Taco Bell restaurants<br />
around the world – focused on satisfying<br />
our customers better than any other<br />
restaurant company.<br />
We are custo<br />
6 TRICON GLOBAL RESTAURANTS<br />
“Going forward, we’ll be absolutely<br />
committed to becoming true Customer<br />
Maniacs. We want to be so maniacal about satis-<br />
fying our customers that we think about it all the time.<br />
We wake up every morning so PUMPED UP and PASSIONATE<br />
about pleasing them that we’re OBSESSED with how we can<br />
better serve them.<br />
“As Customer Maniacs, we do whatever it takes to make<br />
sure that every time customers enjoy our food, they’ve had
the best possible experience – every customer, every<br />
restaurant, every time.<br />
“And we’re driving this message home by executing the<br />
basics – focusing on CHAMPS, our core program for<br />
training, measuring and rewarding employee performance<br />
against key customer metrics. CHAMPS aligns all<br />
of our systems and processes around one set<br />
of standards and encourages everyone, at<br />
every level, to take accountability for not<br />
mer maniacs!<br />
only meeting but exceeding cus-<br />
tomer expectations. And when we execute the<br />
basics well, we’re making our customers happy –<br />
that’s JOB #1 for us.<br />
“Over the next few pages, you’ll read about some true<br />
Customer Maniacs who walk the talk of Customer Mania<br />
in their restaurants every day. I think you’ll see why<br />
Tricon is on its way to becoming the most customer-<br />
focused restaurant company in the world!”<br />
Aylwin Lewis<br />
Chief Operating Officer<br />
CHAMPS =<br />
Cleanliness<br />
Hospitality<br />
Accuracy<br />
Maintenance<br />
Product Quality<br />
Speed of Service
Having a YUMMY
Jianzhong Tang was turning five. He told<br />
his mom he wanted only one gift – to spend<br />
his birthday at KFC with Chicky – the lovable,<br />
colorful KFC mascot. Chicky has put a YUM<br />
on millions of kids’ faces around the globe,<br />
celebrating hundreds of birthday parties at<br />
each of our KFC international restaurants<br />
every year.<br />
birthday!
Last year, Tricon<br />
International opened<br />
a record 929 new<br />
traditional restaurants<br />
around the<br />
world, and we plan<br />
to open about the<br />
same number of<br />
stores in 2001.<br />
International System<br />
Sales by Brand<br />
KFC 67%<br />
Taco Bell 2%<br />
Pizza Hut 31%<br />
International<br />
“<strong>2000</strong> was a year of growth,<br />
growth, growth for our interna-<br />
tional business! We opened 929<br />
traditional restaurants around<br />
the world, grew operating profit<br />
to $309 million, up 16% from<br />
1999, and improved interna-<br />
tional system sales by 6%. And<br />
we did it while achieving solid G&A reduction<br />
and margin improvement.<br />
“Our big international winners were Greater<br />
China, which increased profits a whopping 47%,<br />
and our KFC United Kingdom and Pizza Hut Korea<br />
businesses, which each increased profits by 25%.<br />
“We also boosted the global popularity of our<br />
food, scoring big wins with the debut of Pizza Hut’s<br />
Stuffed Crust pizza in Malaysia and the Philippines,<br />
and the continuing success of KFC’s Twister in Australia<br />
and Korea. In Asia, we launched two delicious<br />
new product variants, Honey Mustard<br />
Twister and Spicy Twister, which are helping<br />
to drive strong sales growth in the region.<br />
Pete Bassi<br />
President<br />
Peter Hearl<br />
Executive Vice President<br />
Pizza Hut and KFC<br />
are world leaders in<br />
the pizza and<br />
chicken categories,<br />
and we believe we’ll<br />
drive consistent<br />
profit growth from<br />
here on out, as seen<br />
by a 47% increase in<br />
Greater China and<br />
25% profit growth in<br />
the United Kingdom.
“We’ve been focused on growing our business globally, develop-<br />
ing the KFC brand in Germany and in other European markets,<br />
and exploiting the power of our Pizza Hut brand through home<br />
delivery service to strengthen our category leadership.<br />
“What’s ahead? We’ll continue to boost profits by growing sys-<br />
tem sales, attacking margin improvement, leveraging the benefits of<br />
CHAMPS to strengthen operations and delivering on our strategic<br />
growth opportunities.<br />
“All in all – our international outlook looks terrific. Fueled by<br />
a maniacal customer focus and a great track record of success –<br />
our global growth will continue for years to come!”<br />
First launched in<br />
Korea three years<br />
ago, Twister has<br />
created more daypart<br />
opportunities<br />
and has a broader<br />
appeal to a younger<br />
consumer segment.
Going the extra
mile!<br />
Just about all 10,000 people who live in<br />
La Porte, Ind., know and love Pizza Hut RGM<br />
LuAnne DeVall. That’s because she truly<br />
cares about the customers of her deliveryonly<br />
restaurant. LuAnne is a Customer Maniac<br />
who goes the extra mile to please her customers.<br />
That occasionally means making a<br />
few pizza home delivery trips of her own –<br />
taking along a bag of candy as a surprise<br />
or even picking up a prescription along the<br />
way for an elderly customer in need!
The Insider pizza,<br />
with its six-cheese<br />
blend, was one of<br />
the speciality pizzas<br />
that drove Pizza<br />
Hut’s same store<br />
sales growth – up 1%<br />
during <strong>2000</strong> – on top<br />
of record-setting<br />
9% growth.<br />
Pizza Hut “To those who said Pizza Hut could never<br />
top 1999’s extraordinary growth, we say: We can. We did. After<br />
our record-setting 9% same store sales growth in 1999, this year<br />
Pizza Hut added an additional 1% same store sales growth. And<br />
we did it without sacrificing profitability. In fact, restaurant margins<br />
increased more than a full percentage point.<br />
“How did we drive our third straight year of sales growth and<br />
bolster our category-leading market share? By focusing on three<br />
things: Great people, processes and products.<br />
“Success in our business begins by putting people capability first.<br />
That’s why we train, recognize and reward our people at every oppor-<br />
tunity. In <strong>2000</strong>, that led to the lowest<br />
turnover rate in Pizza Hut’s history<br />
in one of the toughest labor<br />
markets ever.
Pizza Hut was<br />
named the #1<br />
national pizza chain<br />
in America according<br />
to the “Restaurants<br />
& Institutions” annual<br />
survey.<br />
“Processes and people pro-<br />
vide the kind of service that<br />
keeps customers coming back.<br />
In <strong>2000</strong>, we focused on the<br />
“S” in CHAMPS, Speed of<br />
service, by training managers<br />
throughout the Pizza Hut sys-<br />
tem in delivery fundamentals.<br />
Customers noticed: Pizza Hut<br />
regained its rightful place as the #1 national pizza<br />
chain in America, according to the Restaurants &<br />
Institutions annual survey.<br />
“Product innovation, variety and quality<br />
continued to fuel consumer growth at Pizza Hut, particularly with<br />
The Insider – a pizza inside a pizza, with Pizza Hut’s delicious six-<br />
cheese blend. The Insider increased market share among Echo<br />
Boomers (ages 5-22), especially high school students.<br />
“As we enter a new century, we have new strategies<br />
in place to drive sales, develop new units, build out our<br />
delivery segment and satisfy our customers better than anyone.<br />
But we have the same old-fashioned formula for success: Great<br />
people, processes and products.”<br />
Mike Rawlings<br />
President and<br />
Chief Concept Officer<br />
Mike Miles<br />
Chief Operating Officer<br />
Pizza QSR Sales<br />
Pizza Hut 22%<br />
Domino’s 11%<br />
Papa John’s 7%<br />
Regionals 7%<br />
Little Caesar’s 5%<br />
Independents 48%*<br />
*Highly fragmented<br />
Pizza Hut introduced<br />
a new logo<br />
and new look that<br />
will be showing up<br />
in our restaurants<br />
around the world.
Mother’s Day is traditionally the busiest day<br />
of the year for KFC restaurants. That<br />
day last year, KFC RGM Olimpia Rosas knew<br />
almost half the entire town of Berwyn, Ill.<br />
would be showing up at her KFC restaurant<br />
for a chicken dinner. So Olimpia arrived<br />
extra early to fire up the cookers and get<br />
a jump on the day. That’s typical Olimpia,<br />
pictured here with some of her biggest<br />
fans, her customers! She’s maniacal about<br />
making sure they aren’t disappointed. For<br />
Olimpia, taking care of customers and her<br />
team is an uplifting experience.<br />
Carried away by
customers
Chicken QSR Sales<br />
KFC 53%<br />
Popeye’s 9%<br />
Church’s 6%<br />
Regional’s 4%<br />
Independents 28%<br />
20% of KFC system<br />
restaurants had a<br />
brighter, slicker look<br />
in <strong>2000</strong>, and more<br />
upgraded units are<br />
on the way in 2001.<br />
18 TRICON GLOBAL RESTAURANTS<br />
KFC “Since building a<br />
foundation for our chicken<br />
sandwiches in the fourth quarter<br />
of 1999 – when we grew the<br />
category more than any other<br />
chain – we’ve since doubled our<br />
1999 sandwich share and are now<br />
aggressively competing for more.<br />
“We’ve positioned ourselves<br />
with a delicious line of freshly made sandwiches,<br />
including Original Recipe, Tender Roast, Triple<br />
Crunch, Triple Crunch Zinger and Honey BBQ.<br />
And last fall, we extended this sandwich line with<br />
the Twister – a unique, zesty, hot-wrap sensation<br />
that’s proving it can keep customers coming back.<br />
“We are optimistic about KFC because we have a much stronger<br />
and balanced calendar featuring sandwiches, chicken-on-the-bone,<br />
strips and wings news throughout the year. We also have an incre-<br />
mental half percent of national advertising, or 11 extra weeks on-air,<br />
to promote the variety of our menu.<br />
KFC has strategically<br />
invested in<br />
consumer learning<br />
and product development<br />
to ensure<br />
we have top-quality,<br />
consumer-preferred<br />
products across<br />
our menu.<br />
“With a new leadership team in place, we’ve set our sights on two<br />
primary goals: operational excellence and brand differentiation. We’ve<br />
intensified our focus on superior CHAMPS performance; a targeted<br />
new advertising campaign to draw in a whole new<br />
Cheryl Bachelder<br />
President and<br />
Chief Concept Officer<br />
Mark Cosby<br />
Chief Operating Officer
generation of chicken lovers; accelerated unit development; and<br />
other initiatives, such as multibranding, designed to fuel sales<br />
and increase shareholder value in our brand.<br />
“By the end of <strong>2000</strong>, 13% of all U.S. KFC restaurants were<br />
multibrand units, either partnered with Pizza Hut or Taco Bell,<br />
or both. And under an exciting new arrangement with A&W<br />
Restaurants, Inc., we opened several KFC/A&W units and plan<br />
to build 300 more by 2005.<br />
“New leadership, new strategies, a renewed commitment to<br />
driving sales – we’re doing whatever it takes to ensure<br />
that KFC remains the world’s #1 choice for chicken<br />
for many years<br />
to come!”<br />
With 53% of the<br />
chicken QSR market,<br />
KFC has a more<br />
balanced marketing<br />
approach for 2001.<br />
Our franchise partners<br />
voted with us<br />
to add a half percent<br />
contribution<br />
to national media<br />
spending in 2001.
You can hear the
Team member Jeff Shine brightens the day of<br />
each customer who comes by his drive-thru<br />
window with his large smile, great attitude<br />
and outstanding service. This Customer<br />
Maniac often gives his customers an experience<br />
to remember – whether rhyming their<br />
orders or asking them to “Have an exhilarating<br />
afternoon, now.” His enthusiasm and<br />
creativity keep them coming back for more.<br />
Jeff can be found practicing his own special<br />
brand of customer mania at a Taco Bell in<br />
Huntsville, Ala.<br />
smile in his voice
Taco Bell is aggressively<br />
developing a<br />
pipeline of products<br />
that will broaden<br />
our appeal and<br />
improve our ingredient<br />
quality. We’ve<br />
already scored key<br />
customer wins with<br />
our new mouthwatering<br />
gooey Cheesy<br />
Gordita Crunch.<br />
The Cheesy<br />
Gordita Crunch is a<br />
crunchy taco wrapped<br />
in gordita flatbread<br />
and a melted blend<br />
of three cheeses –<br />
all spiked with zesty<br />
Pepper Jack Sauce.<br />
22 TRICON GLOBAL RESTAURANTS<br />
Taco Bell “We’ve had a challenging year at Taco Bell –<br />
no doubt about it. Same store sales declined 5% for the year – and<br />
that is completely unacceptable. But we’re moving quickly to regain<br />
strength. We have a new management team in place, and we’re taking<br />
a disciplined approach to turn Taco Bell around, once and for all.<br />
“Our Taco Bell team is focused on a ‘one-two’ punch of<br />
improved operations and improved marketing. On the operations<br />
front, our goal is to improve cleanliness and speed of service. We<br />
have launched a Clean Sweep program to drive<br />
home the importance of executing our<br />
clean checklist every day.<br />
“To improve our speed<br />
of service, we’re simpli-<br />
fying the ordering<br />
process at the
Taco Bell continues<br />
to drive customer<br />
mania deep by giving<br />
our people the training<br />
programs and<br />
tools they need to<br />
differentiate the<br />
brand and keep our<br />
customers coming<br />
back for more.<br />
drive-thru. We’ve also provided<br />
additional coaching and sup-<br />
port to our Restaurant General<br />
Managers so they will have the<br />
tools, resources and enhanced<br />
capabilities to improve restau-<br />
rant operations. These initiatives<br />
are taking hold, and we should<br />
see positive results in 2001.<br />
“On the marketing front, we have taken<br />
steps to immediately strengthen our calendar,<br />
enhance our product quality and drive value.<br />
We are looking for ways to evolve and dimen-<br />
sionalize our industry-leading value proposition.<br />
“Longer term, the big strategic push is for<br />
Taco Bell to broaden our reach, maintaining our stronghold with<br />
core heavy users and attracting new customers as the leading variety<br />
option. As the market leader with 72% share, we need to expand our<br />
user base. Our Taco Bell team is working on a new positioning and<br />
advertising approach that will be launched in the latter part of 2001.<br />
“So while it’s been a difficult year, we’re making progress. We<br />
now have the strategies, the focus and the people in place to deliver<br />
the kind of performance results you’d expect from Taco Bell.<br />
We’re confident we’ll soon be back on track.”<br />
Emil J. Brolick<br />
President and<br />
Chief Concept Officer<br />
Bob Nilsen<br />
Chief Operating Officer<br />
Mexican QSR Sales<br />
Taco Bell 72%<br />
Del Taco 3%<br />
Taco John’s 3%<br />
Taco Bueno 2%<br />
Taco Time 1%<br />
Independents 19%<br />
Taco Bell’s L-Series<br />
incorporates the<br />
very latest in engineering<br />
technology<br />
and design – reducing<br />
labor, improving<br />
food quality and<br />
ensuring customer<br />
satisfaction!
Worldwide Units<br />
In thousands, year-end <strong>2000</strong><br />
30<br />
Tricon<br />
29<br />
15<br />
McDonald’s<br />
Subway<br />
11<br />
Burger King<br />
Wendy’s<br />
7 7<br />
24 TRICON GLOBAL RESTAURANTS<br />
6<br />
Domino’s Pizza<br />
Dairy Queen<br />
Tricon Facts<br />
Worldwide System Units<br />
Year-end 1996-<strong>2000</strong> <strong>2000</strong> 1999 1998 1997 1996<br />
5-year<br />
growth(a)<br />
KFC 5,364 5,231 5,105 5,092 5,078 1%<br />
Pizza Hut 7,927 8,084 8,412 8,640 8,696 (2)%<br />
Taco Bell 6,746 6,879 6,852 6,741 6,642 2%<br />
Total U.S. 20,037 20,194 20,369 20,473 20,416 –<br />
KFC 5,974 5,595 5,318 5,145 4,783 6%<br />
Pizza Hut 4,157 3,961 3,873 3,894 3,694 4%<br />
Taco Bell 249 232 203 200 203 5%<br />
Total International 10,380 9,788 9,394 9,239 8,680 5%<br />
Total 30,417 29,982 29,763 29,712 29,096 2%<br />
(a) Compound annual growth rate<br />
Breakdown of Worldwide System Units<br />
Unconsolidated<br />
Year-end <strong>2000</strong> Company Affiliates Franchised Licensed Total<br />
United States<br />
KFC 1,339 – 3,978 47 5,364<br />
Pizza Hut 1,801 – 4,888 1,238 7,927<br />
Taco Bell 1,162 – 3,996 1,588 6,746<br />
Total U.S.<br />
International<br />
4,302 – 12,862 2,873 20,037<br />
KFC 1,109 1,022 3,790 53 5,974<br />
Pizza Hut 668 819 2,466 204 4,157<br />
Taco Bell 44 3 169 33 249<br />
Total International 1,821 1,844 6,425 290 10,380<br />
Total 6,123 1,844 19,287 3,163 30,417
U.S. Sales by<br />
Daypart (% of Sales)<br />
Dinner 74%<br />
Lunch 24%<br />
Snacks/Breakfast 2%<br />
Dinner 61%<br />
Lunch 36%<br />
Snacks/Breakfast 3%<br />
Dinner 46%<br />
Lunch 48%<br />
Snacks/Breakfast 6%<br />
Sales across our<br />
brands are driven by<br />
dinner and lunch.<br />
Marketing innovations<br />
such as new dayparts<br />
can help grow sales.<br />
U.S. Sales by Distribution<br />
Channel (% of Sales)<br />
Dine Out 64%<br />
Dine In 36%<br />
Dine Out 71%<br />
Dine In 29%<br />
Dine Out 60%<br />
Dine In 40%<br />
Most of our sales<br />
come from off-premises<br />
dining, which reflects<br />
customers’ desire for<br />
convenient food.<br />
TM<br />
®<br />
®<br />
Sources of System Sales in<br />
International Restaurants<br />
Asia-Pacific 44%<br />
Europe, South Africa 23%<br />
Americas 21%<br />
Greater China 12%<br />
Contents<br />
26 Management’s<br />
Discussion and Analysis<br />
40 Consolidated Financial<br />
Statements<br />
44 Notes to Consolidated<br />
Financial Statements<br />
66 Management’s<br />
Responsibility for<br />
Financial Statements<br />
66 <strong>Report</strong> of Independent<br />
Auditors<br />
67 Selected Financial Data<br />
68 Shareholder Information<br />
TRICON GLOBAL RESTAURANTS, INC. AND SUBSIDIARIES 25
Management’s Discussion and Analysis<br />
Introduction<br />
TRICON Global Restaurants, Inc. and Subsidiaries (collectively<br />
referred to as “TRICON” or the “Company”) is<br />
comprised of the worldwide operations of KFC, Pizza Hut<br />
and Taco Bell (“the Concepts”) and is the world’s largest<br />
quick service restaurant (“QSR”) company based on the<br />
number of system units. Separately, each brand ranks in the<br />
top ten among QSR chains in U.S. system sales and units.<br />
Our 10,400 international units make us the second largest<br />
QSR company outside the U.S. TRICON became an independent,<br />
publicly owned company on October 6, 1997 (the<br />
“Spin-off Date”) via a tax free distribution of our Common<br />
Stock (the “Distribution” or “Spin-off”) to the shareholders<br />
of our former parent, PepsiCo, Inc. (“PepsiCo”).<br />
Throughout Management’s Discussion and Analysis<br />
(“MD&A”), we make reference to ongoing operating profit<br />
which represents our operating profit excluding the impact<br />
of facility actions net gain, unusual items and our accounting<br />
and human resources policy changes in 1999 (collectively, the<br />
“1999 accounting changes”). See Note 5 to the Consolidated<br />
Financial Statements for a detailed discussion of these exclusions.<br />
We use ongoing operating profit as a key performance<br />
measure of our results of operations for purposes of evaluating<br />
performance internally and as the base to forecast future performance.<br />
Ongoing operating profit is not a measure defined<br />
in accounting principles generally accepted in the U.S. and<br />
should not be considered in isolation or as a substitution<br />
for measures of performance in accordance with accounting<br />
principles generally accepted in the U.S.<br />
In <strong>2000</strong>, our international business, Tricon Restaurants<br />
International (“TRI” or “International”) accounted for 35%<br />
of system sales, 29% of total revenues and 29% of ongoing<br />
operating profit excluding unallocated and corporate expenses<br />
and foreign exchange gains and losses. We anticipate that,<br />
despite the inherent risks and typically higher general and<br />
administrative expenses required by international operations,<br />
we will continue to invest in key international markets with<br />
substantial growth potential.<br />
26 TRICON GLOBAL RESTAURANTS, INC. AND SUBSIDIARIES<br />
This MD&A should be read in conjunction with our<br />
Consolidated Financial Statements on pages 40–65 and the<br />
Cautionary Statements on page 39. All Note references<br />
herein refer to the Notes to the Consolidated Financial<br />
Statements on pages 44 –65. Tabular amounts are displayed<br />
in millions except per share and unit count amounts, or as<br />
otherwise specifically identified.<br />
Factors Affecting Comparability of <strong>2000</strong> Results to 1999<br />
Impact of AmeriServe Bankruptcy Reorganization Process<br />
See Note 21 for a complete discussion of the impact of<br />
the AmeriServe Food Distribution, Inc. (“AmeriServe”)<br />
bankruptcy reorganization process on the Company.<br />
Kraft Taco Shell Recall<br />
In the fourth quarter of <strong>2000</strong>, allegations were made by a<br />
public environmental advocacy group that testing of corn taco<br />
shells, sold by Kraft Foods, Inc. (“Kraft”) in grocery stores<br />
under a license to use the Taco Bell brand name, had indicated<br />
the presence of genetically modified (“GM”) corn which had<br />
only been approved by the applicable U.S. governmental<br />
agencies for animal consumption. In light of the allegations,<br />
Kraft recalled this product line. We are not aware of any evidence<br />
that suggests that the GM corn at issue presents any<br />
significant health risk to humans. Nonetheless, consistent<br />
with our overall quality assurance procedures, we have taken<br />
significant actions to ensure that our restaurant supply chain<br />
is free of products containing the GM corn in question, and<br />
we will continue to take whatever actions are prudent or<br />
appropriate in this regard.<br />
Although we are unable to estimate the amount, we believe<br />
that our Taco Bell restaurants have experienced a negative<br />
impact on sales following the allegations and the Kraft recall.<br />
We do not currently believe this sales impact will be sustained<br />
over the long term.<br />
Franchisee Financial Condition<br />
Like others in the QSR industry, from time to time, some of<br />
our franchise operators experience financial difficulties with<br />
respect to their franchise operations. At present, certain of<br />
our franchise operators, principally in the Taco Bell system,<br />
are facing varying degrees of financial problems, primarily as<br />
a result of declines in store sales in the Taco Bell system, which<br />
we believe have been exacerbated by the grocery product recalls<br />
of corn taco shells by Kraft in the fourth quarter of <strong>2000</strong>.
Depending upon the facts and circumstances of each<br />
situation, and in the absence of an improvement in business<br />
trends, there are a number of potential resolutions of these<br />
financial issues, including a sale of some or all of the operator’s<br />
restaurants to us or a third party, a restructuring of the<br />
operator’s business and/or finances, or, in the more unusual<br />
cases, bankruptcy of the operator. It is our practice to proactively<br />
work with financially troubled franchise operators in<br />
an attempt to positively resolve their issues.<br />
Taco Bell has established a $15 million loan program<br />
for those franchisees in need of short-term assistance due to<br />
the recent sales declines in the Taco Bell system. Through<br />
February 2001, this program has aided approximately 75<br />
franchisees covering approximately 1,500 Taco Bell restaurants.<br />
Additionally, Taco Bell is in various stages of discussions with<br />
a number of other Taco Bell franchisees and their lenders. We<br />
believe that many of these franchisees will require various types<br />
of business and/or financial restructuring. Based on currently<br />
available information, we believe that this group of franchisees<br />
represents approximately 1,000 Taco Bell restaurants.<br />
In <strong>2000</strong>, we charged approximately $26 million to ongoing<br />
operating profit for expenses related to the financial situation<br />
of certain Taco Bell franchisees. These expenses, which relate<br />
primarily to allowances for doubtful franchise and license fee<br />
receivables, were reported as general and administrative<br />
expenses. On an ongoing basis, we assess our exposure from<br />
franchise-related risks which include estimated uncollectibility<br />
of accounts receivable related to franchise and license fees,<br />
contingent lease liabilities, guarantees to support certain third<br />
party financial arrangements with franchisees and potential<br />
claims by franchisees. The contingent lease liabilities and<br />
guarantees are more fully discussed in the Contingent Liabilities<br />
section of Note 21. Although the ultimate impact of these<br />
franchise financial issues cannot be predicted with certainty<br />
at this time, we have provided for our current estimate of the<br />
probable exposure to the Company as of December 30, <strong>2000</strong>.<br />
It is reasonably possible that there will be additional costs<br />
which could be material to quarterly or annual results of<br />
operations, financial condition or cash flows.<br />
Based on the information currently available to us, we have<br />
budgeted for an estimate of expenses and capital expenditures<br />
that may be required to address this situation. However, the<br />
Taco Bell franchise financial situation poses certain risks and<br />
uncertainties to us. The more significant of these risks and<br />
uncertainties are described below. Significant adverse developments<br />
in this situation, or in any of these risks or uncertainties,<br />
could have a material adverse impact on our quarterly or<br />
annual results of operations, financial condition or cash flows.<br />
We intend to continue to proactively work with financially<br />
troubled franchise operators in an attempt to positively resolve<br />
their issues. However, there can be no assurance that the<br />
number of franchise operators or restaurants experiencing<br />
financial difficulties will not change from our current estimates.<br />
Nor can there be any assurance that we will be successful in<br />
resolving financial issues relating to any specific franchise<br />
operator. Additionally, there can be no assurance that resolution<br />
of these financial issues will not result in Taco Bell<br />
purchasing a significant number of restaurants from financially<br />
troubled Taco Bell franchise operators.<br />
Unusual Items<br />
We recorded unusual items of $204 million ($129 million<br />
after-tax), $51 million ($29 million after-tax) and $15 million<br />
($3 million after-tax) in <strong>2000</strong>, 1999 and 1998, respectively.<br />
See Note 5 for a detailed discussion of our unusual items.<br />
Fifty-third Week in <strong>2000</strong><br />
Our fiscal calendar results in a fifty-third week every 5 or 6<br />
years. Fiscal year <strong>2000</strong> included a fifty-third week in the<br />
fourth quarter. The following table summarizes the estimated<br />
impact of the fifty-third week on system sales, revenues and<br />
ongoing operating profit:<br />
Inter-<br />
U.S. national Unallocated Total<br />
System sales $230 $65 $«– $295<br />
Revenues<br />
Company sales $÷58 $18 $«– $÷76<br />
Franchise fees 9 2 – 11<br />
Total Revenues<br />
Ongoing operating profit<br />
$÷67 $20 $«– $÷87<br />
Franchise fees $÷÷9 $÷2 $«– $÷11<br />
Restaurant margin<br />
General and administrative<br />
11 4 – 15<br />
expenses (3) (2) (2) (7)<br />
Ongoing operating profit $÷17 $÷4 $(2) $÷19<br />
The estimated favorable impact in net income was $10 million<br />
or $0.07 per diluted share.<br />
TRICON GLOBAL RESTAURANTS, INC. AND SUBSIDIARIES 27
Store Portfolio Strategy<br />
Beginning in 1995, we have been strategically reducing our<br />
share of total system units by selling Company restaurants to<br />
existing and new franchisees where their expertise can generally<br />
be leveraged to improve our overall operating performance,<br />
while retaining Company ownership of key U.S. and International<br />
markets. This portfolio-balancing activity has reduced,<br />
and will continue to reduce, our reported revenues and restaurant<br />
profits and has increased the importance of system sales<br />
as a key performance measure. We expect to substantially<br />
complete our refranchising program in 2001.<br />
The following table summarizes our refranchising activities<br />
for the last three years:<br />
<strong>2000</strong> 1999 1998<br />
Number of units refranchised 757 1,435 1,373<br />
Refranchising proceeds, pre-tax $381 $«««916 $«««784<br />
Refranchising net gains, pre-tax $200 $«««422 $«««279<br />
In addition to our refranchising program, we have been<br />
closing restaurants over the past several years. Restaurants<br />
closed include poor performing restaurants, restaurants that<br />
are relocated to a new site within the same trade area or U.S.<br />
Pizza Hut delivery units consolidated with a new or existing<br />
dine-in traditional store within the same trade area.<br />
The following table summarizes Company store closure<br />
activities for the last three years:<br />
28 TRICON GLOBAL RESTAURANTS, INC. AND SUBSIDIARIES<br />
<strong>2000</strong> 1999 1998<br />
Number of units closed 208 301 572<br />
Store closure costs (credits) (a) $««10 $««13 $«(27)<br />
Impairment charges for stores to be<br />
closed in the future $««÷6 $««12 $«÷«6<br />
(a) Includes favorable adjustments to our 1997 fourth quarter charge of<br />
$9 million in 1999 and $56 million in 1998.<br />
The impact on ongoing operating profit arising from our<br />
refranchising and store closure initiatives as well as the contribution<br />
of Company stores to a new unconsolidated affiliate<br />
as described in the Impact of New Unconsolidated Affiliates<br />
section (the “Portfolio Effect”), represents the net of (a) the<br />
estimated reduction in Company sales, restaurant margin<br />
and general and administrative expenses (“G&A”), (b) the<br />
estimated increase in franchise fees and (c) the equity income<br />
(loss) from investments in unconsolidated affiliates (“equity<br />
income”). The amounts presented below reflect the estimated<br />
impact from stores that were operated by us for all or some<br />
portion of the comparable period in the respective previous<br />
year and were no longer operated by us as of the last day of<br />
the respective year.<br />
The following table summarizes the estimated revenue<br />
impact of the Portfolio Effect:<br />
<strong>2000</strong><br />
U.S. International Worldwide<br />
Reduced sales $«««(838) $(246) $(1,084)<br />
Increased franchise fees 39 13 52<br />
Reduction in total revenues $«««(799) $(233) $(1,032)<br />
1999<br />
U.S. International Worldwide<br />
Reduced sales $(1,065) $(201) $(1,266)<br />
Increased franchise fees 51 9 60<br />
Reduction in total revenues $(1,014) $(192) $(1,206)<br />
The following table summarizes the estimated impact on<br />
ongoing operating profit of the Portfolio Effect:<br />
<strong>2000</strong><br />
U.S. International Worldwide<br />
Decreased restaurant margin $««(90) $(25) $(115)<br />
Increased franchise fees 39 13 52<br />
Decreased G&A 11 6 17<br />
Equity income (loss) – (1) (1)<br />
(Decrease) in ongoing operating profit $««(40) $÷(7) $÷(47)<br />
1999<br />
U.S. International Worldwide<br />
Decreased restaurant margin $(108) $(18) $(126)<br />
Increased franchise fees 51 9 60<br />
Decreased G&A 17 10 27<br />
(Decrease) increase in ongoing<br />
operating profit $÷(40) $÷«1 $÷(39)<br />
The estimated interest savings resulting from the reduction<br />
of average debt with the net after-tax cash proceeds from our<br />
refranchising activities largely mitigated the above reduction<br />
in ongoing operating profit.
Results of Operations<br />
Worldwide Results of Operations<br />
% B(W) % B(W)<br />
<strong>2000</strong> vs. 1999 1999 vs. 1998<br />
System sales (a) $22,159 2 $21,762 6<br />
Revenues<br />
Company sales $÷6,305 (11) $÷7,099 (10)<br />
Franchise and license fees 788 9 723 15<br />
Total Revenues $÷7,093 (9) $÷7,822 (8)<br />
Company restaurant margin $÷÷«954 (13) $÷1,091 3<br />
% of sales 15.1% (0.3) «ppts. 15.4% 1.9 ppts.<br />
Ongoing operating profit $÷÷«888 1 $÷÷«881 15<br />
Accounting changes (b) – NM 29 NM<br />
Facility actions net gain 176 (54) 381 38<br />
Unusual items (204) NM (51) NM<br />
Operating Profit 860 (31) 1,240 21<br />
Interest expense, net 176 13 202 26<br />
Income Tax Provision 271 34 411 (32)<br />
Net Income $÷÷«413 (34) $÷÷«627 41<br />
Diluted Earnings Per Share $÷÷2.77 (29) $÷÷3.92 38<br />
(a) Represents combined sales of Company, unconsolidated affiliate, franchise and license restaurants.<br />
(b) See Note 5 for a discussion of the 1999 accounting changes.<br />
Worldwide Restaurant Unit Activity<br />
Unconsolidated<br />
Company Affiliates Franchisees Licensees Total<br />
Balance at Dec. 26, 1998 8,397 1,120 16,650 3,596 29,763<br />
Openings & Acquisitions 323 83 858 586 1,850<br />
Refranchising & Licensing (1,435) (5) 1,443 (3) –<br />
Closures (301) (20) (434) (646) (1,401)<br />
Other (3) – (103) (124) (230)<br />
Balance at Dec. 25, 1999 6,981 1,178 18,414 3,409 29,982<br />
Openings & Acquisitions 370 108 960 324 1,762<br />
Refranchising & Licensing (757) (9) 775 (9) –<br />
Closures (208) (53) (505) (561) (1,327)<br />
Other (a) (263) 620 (357) – –<br />
Balance at Dec. 30, <strong>2000</strong> (b) 6,123 1,844 19,287 3,163 30,417<br />
% of total 20.1% 6.1% 63.4% 10.4% 100.0%<br />
(a) Primarily includes 320 Company units and 329 Franchisee units contributed in connection with the formation of a new unconsolidated affiliate in Canada<br />
as well as 57 units acquired by the Company from Unconsolidated Affiliates and Franchisees.<br />
(b) Includes 38 Company units approved for closure but not yet closed at December 30, <strong>2000</strong>.<br />
TRICON GLOBAL RESTAURANTS, INC. AND SUBSIDIARIES 29
Worldwide System Sales<br />
System sales increased $397 million or 2% in <strong>2000</strong>, after a 1%<br />
unfavorable impact from foreign currency translation. Excluding<br />
the negative impact of foreign currency translation and the<br />
favorable impact of the fifty-third week, system sales increased<br />
1%. This increase was driven by new unit development, partially<br />
offset by store closures and same store sales declines.<br />
In 1999, system sales increased $1.1 billion or 6%. The<br />
improvement was driven by new unit development and same<br />
store sales growth. U.S. development was primarily at Taco<br />
Bell while International development was primarily in Asia.<br />
The increase was partially offset by store closures.<br />
Worldwide Revenues<br />
Company sales decreased $794 million or 11% in <strong>2000</strong>. As<br />
expected, the decline in Company sales was primarily due to<br />
the Portfolio Effect partially offset by the favorable impact<br />
from the fifty-third week in <strong>2000</strong>. Excluding these items,<br />
Company sales increased 4%. This increase was primarily<br />
due to new unit development and favorable Effective Net<br />
Pricing, partially offset by volume declines. Effective Net<br />
Pricing includes increases or decreases in price and the effect<br />
of changes in product mix.<br />
Franchise and license fees increased approximately $65 million<br />
or 9% in <strong>2000</strong>. The increase was driven by units acquired<br />
from us and new unit development, partially offset by store<br />
closures and franchisee same store sales declines in the U.S.<br />
The negative impact of foreign currency translation was<br />
essentially offset by the favorable impact from the fifty-third<br />
week in <strong>2000</strong>.<br />
Company sales decreased $753 million or 10% in 1999.<br />
As expected, the decline in Company sales was due to the<br />
Portfolio Effect. Excluding the Portfolio Effect, Company sales<br />
increased 8%. The increase was primarily due to new unit<br />
development, favorable Effective Net Pricing and volume<br />
increases in the U.S. and International. The volume increase in<br />
the U.S. was led by the launch of “The Big New Yorker” pizza.<br />
Franchise and license fees grew $96 million or 15% in<br />
1999. The growth was primarily driven by units acquired from<br />
us and new unit development, primarily in Asia and at Taco<br />
Bell in the U.S., partially offset by store closures by franchisees<br />
and licensees.<br />
Worldwide Company Restaurant Margin<br />
30 TRICON GLOBAL RESTAURANTS, INC. AND SUBSIDIARIES<br />
<strong>2000</strong> 1999 1998<br />
Company sales 100.0% 100.0% 100.0%<br />
Food and paper 30.8 31.5 32.1<br />
Payroll and employee benefits 27.7 27.6 28.6<br />
Occupancy and other operating expenses 26.4 25.5 25.8<br />
Restaurant margin 15.1% 15.4% 13.5%<br />
Restaurant margin as a percentage of sales decreased<br />
approximately 25 basis points in <strong>2000</strong>, including the unfavorable<br />
impact of 15 basis points from lapping the 1999<br />
accounting changes. Restaurant margin included 70 basis<br />
points related to the favorable impact of the Portfolio Effect.<br />
Excluding the net effect of these items, our base restaurant<br />
margin declined approximately 80 basis points. Approximately<br />
40 basis points of this decrease resulted from the favorable<br />
1999 U.S. insurance-related adjustments of $30 million,<br />
which are more fully discussed in Note 21. The remaining<br />
decrease was primarily due to a decline in U.S. restaurant<br />
margin, as discussed in the U.S. Restaurant Margin section.<br />
In 1999, our restaurant margin as a percentage of sales<br />
increased approximately 190 basis points. The Portfolio Effect<br />
contributed nearly 50 basis points and accounting changes<br />
contributed approximately 15 basis points to our improvement.<br />
Excluding these items, our base restaurant margin<br />
increased approximately 125 basis points. This improvement<br />
was primarily attributable to Effective Net Pricing in excess<br />
of cost increases (primarily higher wage rates) in the U.S.<br />
Restaurant margin also benefited from improved food and<br />
paper cost management in both the U.S. and certain key<br />
International equity markets. Volume increases at Pizza Hut<br />
in the U.S. and in certain key International equity markets<br />
were fully offset by volume declines at Taco Bell and the<br />
unfavorable impact of the introduction of lower margin<br />
chicken sandwiches at KFC in the U.S.<br />
Worldwide General & Administrative Expenses<br />
G&A declined $41 million or 4% in <strong>2000</strong>. Excluding the<br />
benefit from lapping the 1999 accounting changes, ongoing<br />
G&A decreased $59 million or 6%. The decrease was primarily<br />
due to lower incentive compensation expense and Year<br />
<strong>2000</strong> costs as well as the favorable impact of the Portfolio<br />
Effect. Reduced spending on conferences also contributed<br />
to the decline. The decrease was partially offset by higher<br />
franchise-related expenses, primarily allowances for doubtful<br />
franchise and license fee receivables, as more fully discussed<br />
in the Franchisee Financial Condition section. G&A included<br />
Year <strong>2000</strong> spending of approximately $2 million in <strong>2000</strong> as<br />
compared to approximately $30 million in 1999.<br />
In 1999, G&A decreased $21 million or 2%. Excluding<br />
the $18 million favorable impact of the 1999 accounting<br />
changes, G&A decreased $3 million. The favorable impacts<br />
of the Portfolio Effect, our fourth quarter 1998 decision to<br />
streamline our international business and the absence of costs<br />
associated with relocating certain operations from Wichita,<br />
Kansas in 1998 were partially offset by higher strategic and<br />
other corporate expenses. In addition, higher spending on<br />
conferences and the absence of favorable cost recovery agreements<br />
with AmeriServe and PepsiCo also partially offset the<br />
decreases discussed above.
Worldwide Other (Income) Expense<br />
<strong>2000</strong> 1999 1998<br />
Equity income $(25) $(19) $(18)<br />
Foreign exchange net loss (gain) – 3 (6)<br />
Other (income) expense $(25) $(16) $(24)<br />
Other (income) expense increased $9 million or 55% in<br />
<strong>2000</strong>. The increase in equity income was primarily due to<br />
improved results of our unconsolidated affiliates in Japan, the<br />
United Kingdom and China.<br />
In 1999, other (income) expense declined $8 million or<br />
31%. The decline was primarily due to foreign exchange losses<br />
in 1999 versus gains in 1998 related to U.S. dollar denominated<br />
short-term investments in Canada.<br />
Worldwide Facility Actions Net Gain<br />
We recorded facility actions net gain of $176 million in <strong>2000</strong>,<br />
$381 million in 1999 and $275 million in 1998. See the Store<br />
Portfolio Strategy section for more details regarding our refranchising<br />
and closure activities and Note 5 for a summary of the<br />
components of facility actions net gain by operating segment.<br />
Impairment charges for stores that will continue to be<br />
used in the business were $8 million in <strong>2000</strong> compared to<br />
$16 million in 1999 and $25 million in 1998 reflecting fewer<br />
underperforming stores. As a result of the adoption of the<br />
SEC’s interpretation of Statement of Financial Accounting<br />
Standards No. 121 “Accounting for the Impairment of Long-<br />
Lived Assets” (“SFAS 121”) in 1998, we perform impairment<br />
evaluations when we expect to actually close a store beyond<br />
the quarter in which our closure decision is made. This change<br />
resulted in additional impairment charges of $6 million in<br />
<strong>2000</strong>, $12 million in 1999 and $6 million in 1998. Under<br />
our prior accounting policy, these impairment charges would<br />
have been included in store closure costs in the quarter in<br />
which the closure decision was made.<br />
Worldwide Ongoing Operating Profit<br />
% B(W) % B(W)<br />
<strong>2000</strong> vs. 1999 1999 vs. 1998<br />
U.S. ongoing operating<br />
profit $«742 (9) $÷«813 10<br />
International ongoing<br />
operating profit 309 16 265 39<br />
Foreign exchange net loss – NM (3) NM<br />
Ongoing unallocated and<br />
corporate expenses (163) 16 (194) (14)<br />
Ongoing operating profit $«888 1 $881 15<br />
The changes in U.S. and International ongoing operating<br />
profit for <strong>2000</strong> and 1999 are discussed in the respective<br />
sections below.<br />
Ongoing unallocated and corporate expenses decreased<br />
$31 million or 16% in <strong>2000</strong>. The decline was primarily<br />
due to lower Year <strong>2000</strong> spending and lower incentive compensation<br />
expense.<br />
In 1999, ongoing unallocated and corporate expenses<br />
increased $25 million or 14%. The increase was driven by<br />
higher strategic and other corporate spending, system standardization<br />
investment spending and the absence of favorable cost<br />
recovery agreements from AmeriServe and PepsiCo. These<br />
increases were partially offset by the absence of costs associated<br />
with relocating certain of our operations from Wichita,<br />
Kansas in 1998.<br />
Worldwide Interest Expense, Net<br />
<strong>2000</strong> 1999 1998<br />
Interest expense $190 $218 $291<br />
Interest income (14) (16) (19)<br />
Interest expense, net $176 $202 $272<br />
Our net interest expense decreased $26 million or 13%.<br />
The decline was due to a lower average debt outstanding in<br />
<strong>2000</strong> as compared to 1999, partially offset by an increase in<br />
interest rates on our variable rate debt. As discussed in Note 21,<br />
the interest expense on incremental borrowings related to the<br />
AmeriServe bankruptcy reorganization process of $9 million<br />
has been included in unusual items.<br />
In 1999, our net interest expense decreased $70 million or<br />
26%. The decline was primarily due to the reduction of debt<br />
through use of after-tax cash proceeds from our refranchising<br />
activities and cash from operations.<br />
Worldwide Income Taxes<br />
<strong>2000</strong> 1999 1998<br />
<strong>Report</strong>ed<br />
Income taxes $271 $411 $311<br />
Effective tax rate<br />
Ongoing<br />
39.6% 39.5% 41.1%<br />
(a)<br />
Income taxes $268 $267 $210<br />
Effective tax rate 37.7% 39.3% 42.3%<br />
(a) Excludes the effects of facility actions net gain, unusual items and the 1999<br />
accounting changes. See Note 5 for a discussion of these exclusions.<br />
TRICON GLOBAL RESTAURANTS, INC. AND SUBSIDIARIES 31
The following table reconciles the U.S. federal statutory<br />
tax rate to our ongoing effective tax rate:<br />
32 TRICON GLOBAL RESTAURANTS, INC. AND SUBSIDIARIES<br />
<strong>2000</strong> 1999 1998<br />
U.S. federal statutory tax rate 35.0% 35.0% 35.0%<br />
State income tax, net of federal<br />
tax benefit 2.2 2.3 2.8<br />
Foreign and U.S. tax effects<br />
attributable to foreign operations (1.0) 1.5 6.3<br />
Adjustments relating to prior years 1.3 0.8 (1.7)<br />
Other, net 0.2 (0.3) (0.1)<br />
Ongoing effective tax rate 37.7% 39.3% 42.3%<br />
The <strong>2000</strong> ongoing effective tax rate decreased 1.6 percentage<br />
points to 37.7%. The decrease in the ongoing effective<br />
tax rate was primarily due to a reduction in the tax on our<br />
international operations, including the initial benefits of<br />
becoming eligible in <strong>2000</strong> to claim substantially all of our<br />
available foreign income tax credits for foreign taxes paid<br />
in <strong>2000</strong> against our U.S. income tax liability. This decrease<br />
was partially offset by adjustments relating to prior years.<br />
In <strong>2000</strong>, the effective tax rate attributable to foreign operations<br />
was lower than the U.S. federal statutory rate due to<br />
our ability to claim foreign taxes paid against our U.S. income<br />
tax liability. The effective tax rate attributable to foreign operations<br />
in 1999 and 1998 was higher than the U.S. federal<br />
statutory tax rate. This was primarily due to foreign tax rate<br />
differentials, including foreign withholding tax paid without<br />
benefit of the related foreign tax credit for U.S. income tax<br />
purposes and losses of foreign operations for which no tax<br />
benefit could be currently recognized.<br />
The 1999 ongoing effective tax rate decreased 3.0 percentage<br />
points to 39.3%. The decrease in the ongoing effective<br />
tax rate was primarily due to a one-time favorable international<br />
benefit in Mexico. The recent pattern of profitability<br />
in Mexico and expectations of future profitability have<br />
allowed us to reverse a previous valuation allowance against<br />
deferred tax assets. This will enable us to reduce future cash<br />
tax payments in Mexico.<br />
Diluted Earnings Per Share<br />
The components of diluted earnings per common share<br />
(“EPS”) were as follows:<br />
<strong>2000</strong> (a) 1999 (a)<br />
Diluted Basic Diluted Basic<br />
Ongoing operating earnings $2.98 $3.02 $2.58 $2.69<br />
Accounting changes – – 0.11 0.12<br />
Facility actions net gain (b) 0.66 0.67 1.41 1.47<br />
Unusual items (c) (0.87) (0.88) (0.18) (0.19)<br />
Total $2.77 $2.81 $3.92 $4.09<br />
(a) See Note 4 for the number of shares used in these calculations.<br />
(b) Includes favorable adjustments to our 1997 fourth quarter charge<br />
of $0.06 per diluted share in 1999.<br />
(c) Includes favorable adjustments to our 1997 fourth quarter charge<br />
of $0.07 per diluted share in 1999.<br />
U.S. Results of Operations<br />
% B(W) % B(W)<br />
<strong>2000</strong> vs. 1999 1999 vs. 1998<br />
System sales $14,514 – $14,516 4<br />
Revenues<br />
Company sales $÷4,533 (14) $÷5,253 (13)<br />
Franchise and license fees 529 7 495 16<br />
Total Revenues $÷5,062 (12) $÷5,748 (11)<br />
Company restaurant margin $÷÷«687 (17) $÷÷«825 1<br />
% of sales 15.2% (0.5) «ppts. 15.7% 2.1 ppts.<br />
Ongoing operating profit $÷÷«742 (9) $÷÷«813 10<br />
U.S. Restaurant Unit Activity<br />
Company Franchisees Licensees Total<br />
Balance at Dec. 26, 1998 6,232 10,862 3,275 20,369<br />
Openings & Acquisitions 155 432 539 1,126<br />
Refranchising & Licensing (1,170) 1,167 3 –<br />
Closures (230) (248) (593) (1,071)<br />
Other (3) (103) (124) (230)<br />
Balance at Dec. 25, 1999 4,984 12,110 3,100 20,194<br />
Openings & Acquisitions 143 366 303 812<br />
Refranchising & Licensing (672) 681 (9) –<br />
Closures (153) (295) (521) (969)<br />
Balance at Dec. 30, <strong>2000</strong> (a) 4,302 12,862 2,873 20,037<br />
% of total 21.5% 64.2% 14.3% 100.0%<br />
(a) Includes 37 Company units approved for closure, but not yet closed at<br />
December 30, <strong>2000</strong>.
U.S. System Sales<br />
System sales were essentially flat in <strong>2000</strong>. Excluding the<br />
favorable impact of the fifty-third week in <strong>2000</strong>, system sales<br />
decreased 2%. The decrease was due to same stores sales<br />
declines at Taco Bell and KFC as well as store closures, partially<br />
offset by new unit development.<br />
In 1999, system sales increased $503 million or 4%. The<br />
improvement was driven by new unit development and same<br />
store sales growth. These increases were partially offset by<br />
store closures.<br />
U.S. Revenues<br />
Company sales decreased $720 million or 14%. As expected,<br />
the decline in Company sales was due to the Portfolio Effect<br />
partially offset by the favorable impact from the fifty-third week<br />
in <strong>2000</strong>. Excluding these items, Company sales increased 1%<br />
in <strong>2000</strong>. This increase was primarily due to new unit development<br />
and favorable Effective Net Pricing almost fully<br />
offset by volume declines.<br />
In <strong>2000</strong>, U.S. blended Company same store sales for our<br />
three Concepts decreased 2%. The decline in transactions of<br />
4% was partially offset by favorable Effective Net Pricing of<br />
2%. Same store sales at Pizza Hut increased 1%. Favorable<br />
Effective Net Pricing of 3% was partially offset by transaction<br />
declines of 2%. Same store sales at KFC decreased 3%, primarily<br />
due to transaction declines. Same store sales at Taco Bell<br />
decreased 5% as a result of transaction declines.<br />
Franchise and license fees grew $34 million or 7% in <strong>2000</strong>.<br />
Excluding the favorable impact from the fifty-third week in<br />
<strong>2000</strong>, franchise and license fees increased 5%. The increase<br />
was driven by units acquired from us and new unit development,<br />
partially offset by franchisee same store sales declines<br />
and store closures.<br />
In 1999, Company sales declined $760 million or 13%.<br />
As expected, the decline in Company sales was due to the<br />
Portfolio Effect. Excluding the Portfolio Effect, Company sales<br />
increased 6%. This increase was primarily due to new unit<br />
development, favorable Effective Net Pricing and volume<br />
increases led by the launch of “The Big New Yorker” pizza.<br />
In 1999, U.S. blended same stores sales for our three<br />
Concepts increased 4%. Favorable Effective Net Pricing of<br />
5% was partially offset by a 1% decline in transactions. Same<br />
store sales at Pizza Hut increased 9% in 1999. The improvement<br />
was primarily driven by an increase in transactions of<br />
over 5%, resulting from the launch of “The Big New Yorker.”<br />
The growth at Pizza Hut was also aided by Effective Net<br />
Pricing of over 3%. Same store sales at KFC grew 2%. The<br />
increase was almost equally driven by Effective Net Pricing<br />
and transaction growth. Same store sales at Taco Bell were<br />
flat as an increase in Effective Net Pricing of approximately<br />
4% was fully offset by transaction declines.<br />
Franchise and license fees increased $69 million or 16%<br />
in 1999. The increase was driven by units acquired from us,<br />
new unit development and franchisee same store sales growth,<br />
primarily at Pizza Hut. These increases were partially offset<br />
by store closures.<br />
U.S. Company Restaurant Margin<br />
<strong>2000</strong> 1999 1998<br />
Company sales 100.0% 100.0% 100.0%<br />
Food and paper 28.6 30.0 31.0<br />
Payroll and employee benefits 30.8 29.8 30.4<br />
Occupancy and other operating expenses 25.4 24.5 25.0<br />
Restaurant margin 15.2% 15.7% 13.6%<br />
Restaurant margin as a percentage of sales decreased<br />
approximately 55 basis points in <strong>2000</strong>, including the unfavorable<br />
impact of nearly 25 basis points from lapping the 1999<br />
accounting changes. Restaurant margin included 70 basis<br />
points related to the favorable impact of the Portfolio Effect.<br />
Excluding these items, our base restaurant margin declined<br />
approximately 100 basis points. This decrease included approximately<br />
60 basis points resulting from the absence of favorable<br />
1999 insurance-related adjustments of $30 million, which are<br />
more fully discussed in Note 21. The remaining decrease was<br />
due to a shift to lower margin chicken sandwiches at KFC<br />
and volume declines at Taco Bell, partially offset by Effective<br />
Net Pricing. Favorable commodity costs, primarily cheese,<br />
were almost fully offset by higher occupancy and other costs<br />
as well as increased wage rates.<br />
In 1999, our restaurant margin as a percentage of sales<br />
increased approximately 210 basis points. The Portfolio Effect<br />
contributed approximately 45 basis points and accounting<br />
changes contributed nearly 25 basis points to the improvement.<br />
Excluding these items, our base restaurant margin grew<br />
approximately 140 basis points. The increase was primarily<br />
TRICON GLOBAL RESTAURANTS, INC. AND SUBSIDIARIES 33
attributable to favorable Effective Net Pricing. Labor cost<br />
increases, primarily driven by higher wage rates, were almost<br />
fully offset by lower food and paper costs as improved product<br />
cost management resulted in lower overall beverage and<br />
distribution costs. The improvement also included approximately<br />
15 basis points from retroactive beverage rebates<br />
related to 1998 recognized in 1999. In addition, an increase<br />
in favorable insurance-related adjustments over 1998 contributed<br />
approximately 10 basis points to our improvement.<br />
See Note 21 for additional information regarding our insurance-related<br />
adjustments. All of these improvements were<br />
partially offset by volume declines at Taco Bell and the unfavorable<br />
impact of the introduction of lower margin chicken<br />
sandwiches at KFC.<br />
U.S. Ongoing Operating Profit<br />
Ongoing operating profit declined $71 million or 9% in<br />
<strong>2000</strong>. Excluding the negative impact of the Portfolio Effect<br />
and the favorable impact from the fifty-third week in <strong>2000</strong>,<br />
ongoing operating profit decreased approximately 6%. The<br />
decrease was primarily due to a 100 basis point decline in<br />
base restaurant margin and lower franchise and license fees<br />
(excluding the Portfolio Effect), partially offset by reduced<br />
G&A. The decrease in G&A was largely due to lower incentive<br />
compensation, decreased professional fees and lower spending<br />
International Restaurant Unit Activity<br />
34 TRICON GLOBAL RESTAURANTS, INC. AND SUBSIDIARIES<br />
at Pizza Hut and Taco Bell on conferences. The G&A declines<br />
were partially offset by higher franchise-related expenses,<br />
primarily allowances for doubtful franchise and license fee<br />
receivables, as more fully discussed in the Franchisee Financial<br />
Condition section.<br />
In 1999, ongoing operating profit increased $73 million or<br />
10%. Excluding the negative impact of the Portfolio Effect,<br />
ongoing operating profit increased 15%. The increase was due<br />
to base restaurant margin improvement of 140 basis points<br />
and higher franchise fees primarily from new unit development,<br />
partially offset by higher G&A, net of field G&A savings from<br />
the Portfolio Effect. This increase in G&A was largely due to<br />
higher spending on conferences at Pizza Hut and Taco Bell.<br />
International Results of Operations<br />
% B(W) % B(W)<br />
<strong>2000</strong> vs. 1999 1999 vs. 1998<br />
System sales $7,645 6 $7,246 10<br />
Revenues<br />
Company sales $1,772 (4) $1,846 –<br />
Franchise and license fees 259 14 228 13<br />
Total Revenues $2,031 (2) $2,074 2<br />
Company restaurant margin $÷«267 – $÷«266 11<br />
% of sales 15.1% 0.7«ppts. 14.4% 1.4«ppts.<br />
Ongoing operating profit $÷«309 16 $÷«265 39<br />
Unconsolidated<br />
Company Affiliates Franchisees Licensees Total<br />
Balance at Dec. 26, 1998 2,165 1,120 5,788 321 9,394<br />
Openings & Acquisitions 168 83 426 47 724<br />
Refranchising & Licensing (265) (5) 276 (6) –<br />
Closures (71) (20) (186) (53) (330)<br />
Balance at Dec. 25, 1999 1,997 1,178 6,304 309 9,788<br />
Openings 227 108 594 21 950<br />
Refranchising & Licensing (85) (9) 94 – –<br />
Closures (55) (53) (210) (40) (358)<br />
Other (a) (263) 620 (357) – –<br />
Balance at Dec. 30, <strong>2000</strong> (b) 1,821 1,844 6,425 290 10,380<br />
% of total 17.5% 17.8% 61.9% 2.8% 100.0%<br />
(a) Primarily includes 320 Company units and 329 Franchisee units contributed in connection with the formation of a new unconsolidated affiliate in Canada<br />
as well as 57 units acquired by the Company from Unconsolidated Affiliates and Franchisees.<br />
(b) Includes 1 Company unit approved for closure, but not yet closed at December 30, <strong>2000</strong>.
International System Sales<br />
System sales increased $399 million or 6% in <strong>2000</strong>, after<br />
a 2% unfavorable impact from foreign currency translation.<br />
Excluding the negative impact of foreign currency translation<br />
and the favorable impact of the fifty-third week in <strong>2000</strong>, system<br />
sales increased 7%. This increase was driven by new unit<br />
development, led by China, Korea and Japan and same store<br />
sales growth. The increase was partially offset by store closures.<br />
In 1999, system sales increased $639 million or 10%,<br />
including a 2% favorable impact from foreign currency translation.<br />
This increase was largely driven by strong performance<br />
in Asia, where system sales increased $426 million or 19%,<br />
including a 10% favorable impact of foreign currency translation.<br />
In 1999, the economy in Asia began to show signs of a<br />
steady recovery after the overall economic turmoil and weakening<br />
of local currencies against the U.S. dollar that began in<br />
late 1997. The increase in system sales in Asia was driven by<br />
new unit development and same store sales growth. Outside<br />
of Asia, the improvement was driven by new unit development<br />
and same store sales growth. The increases were partially offset<br />
by store closures primarily by franchisees in Canada,<br />
Latin America and Japan.<br />
International Revenues<br />
Company sales decreased $74 million or 4% in <strong>2000</strong>, after<br />
a 3% unfavorable impact from foreign currency translation.<br />
As expected, the decline in Company sales was primarily due<br />
to the Portfolio Effect partially offset by the favorable impact<br />
from the fifty-third week in <strong>2000</strong>. Excluding all three of<br />
these items, Company sales increased 11% primarily due to<br />
new unit development and favorable Effective Net Pricing.<br />
Franchise and license fees increased approximately $31 million<br />
or 14% in <strong>2000</strong>, after a 3% unfavorable impact from<br />
foreign currency translation. Excluding the negative impact of<br />
foreign currency translation and the favorable impact from the<br />
fifty-third week in <strong>2000</strong>, franchise and license fees increased<br />
16%. The increase was driven by new unit development, units<br />
acquired from us and franchisee same store sales growth. These<br />
increases were partially offset by store closures.<br />
Company sales increased less than 1% in 1999. Excluding<br />
the Portfolio Effect, Company sales increased 13% largely<br />
driven by the strong performance in Asia. The increase was<br />
primarily due to new unit development, favorable Effective<br />
Net Pricing and volume increases.<br />
Franchise and license fees rose $27 million or 13% in 1999.<br />
The increase in franchise and license fees was driven by new<br />
unit development, franchisee same store sales growth and<br />
units acquired from us. New unit development was primarily<br />
in Asia. These increases were partially offset by store closures.<br />
International Company Restaurant Margin<br />
<strong>2000</strong> 1999 1998<br />
Company sales 100.0% 100.0% 100.0%<br />
Food and paper 36.5 36.0 35.8<br />
Payroll and employee benefits 19.5 21.0 22.6<br />
Occupancy and other operating expenses 28.9 28.6 28.6<br />
Restaurant margin 15.1% 14.4% 13.0%<br />
Restaurant margin as a percentage of sales increased approximately<br />
65 basis points in <strong>2000</strong>. Excluding the Portfolio Effect<br />
of approximately 70 basis points, base restaurant margin was<br />
essentially flat.<br />
Restaurant margin as a percentage of sales increased approximately<br />
140 basis points in 1999. Excluding the favorable<br />
impact of foreign currency translation, restaurant margin<br />
increased approximately 130 basis points. Portfolio Effect<br />
contributed approximately 50 basis points. Excluding these<br />
items, our base restaurant margin grew approximately 80 basis<br />
points. The improvement was driven by volume increases in<br />
China, Korea and Australia and favorable Effective Net Pricing<br />
in excess of cost increases, primarily in the United Kingdom,<br />
Puerto Rico and Korea. Our growth in 1999 was partially<br />
offset by volume decreases in Taiwan and Poland. In addition<br />
to the factors described above, restaurant margin benefited<br />
from improved cost management, primarily in China.<br />
International Ongoing Operating Profit<br />
Ongoing operating profit grew $44 million or 16% in <strong>2000</strong>,<br />
after a 2% unfavorable impact from foreign currency translation.<br />
Excluding the negative impacts of the Portfolio Effect<br />
and foreign currency translation and the favorable impact<br />
from the fifty-third week in <strong>2000</strong>, ongoing operating profit<br />
grew 19%. Higher franchise and license fees and Company<br />
new unit development drove the increase.<br />
In 1999, ongoing operating profit grew $74 million or<br />
39%, including a 3% favorable impact from foreign currency<br />
translation. The increase in operating profit was driven by our<br />
base margin improvement of approximately 80 basis points,<br />
higher franchise and license fees and a decline in G&A.<br />
Ongoing operating profit benefited from the economic recovery<br />
in Asia. Operating profit in Asia increased $55 million or<br />
84%, including a 12% favorable impact from foreign currency<br />
translation. Additionally, ongoing operating profit included<br />
benefits of approximately $15 million principally from our<br />
1998 fourth quarter decision to streamline our international<br />
infrastructure in Asia, Europe and Latin America.<br />
TRICON GLOBAL RESTAURANTS, INC. AND SUBSIDIARIES 35
Consolidated Cash Flows<br />
Net cash provided by operating activities decreased<br />
$74 million to $491 million primarily due to unusual charges<br />
associated with the AmeriServe bankruptcy reorganization<br />
process. Changes in operating working capital reflected a net<br />
use of cash of $207 million. The primary drivers of the net<br />
use were receivables from the AmeriServe bankruptcy estate<br />
and franchisee receivables arising from the Company’s program<br />
to temporarily purchase food and supply inventories directly<br />
from third party suppliers for the TRICON system and<br />
sell a portion of these supplies to franchisees and licensees<br />
(the “Temporary Direct Purchase Program”) related to the<br />
AmeriServe bankruptcy reorganization process. These items<br />
resulted in a net cash usage of approximately $135 million<br />
of working capital. See Note 21 for a discussion of the<br />
AmeriServe bankruptcy reorganization process.<br />
Excluding the AmeriServe-related items noted above,<br />
our operating working capital deficit reflects a decrease of<br />
$63 million versus a decrease of $128 million in the prior<br />
year. Our operating working capital deficit, which excludes<br />
cash, short-term investments and short-term borrowings, is<br />
typical of restaurant operations where the majority of sales<br />
are for cash while payment to suppliers carry longer payment<br />
terms, generally from 10-30 days. The lower working capital<br />
deficit reduction in <strong>2000</strong> is the result of refranchising significantly<br />
fewer restaurants in <strong>2000</strong> versus 1999, as well as a<br />
change in payment terms in our distribution agreement<br />
from 30 to 15 days.<br />
In 1999, net cash provided by operating activities decreased<br />
$109 million to $565 million. The decline was primarily due<br />
to a $128 million decrease in our working capital deficit. This<br />
decrease was driven by our portfolio activities which resulted<br />
in a significant reduction in accounts payable and other accrued<br />
liabilities partially offset by higher accounts receivable.<br />
Net cash used in investing activities was $237 million in<br />
<strong>2000</strong>, compared to net cash provided by investing activities<br />
of $522 million in 1999. The decline in cash flow from investing<br />
activities was primarily due to lower gross refranchising<br />
proceeds as a result of selling fewer restaurants to franchisees<br />
in <strong>2000</strong> versus 1999, increased capital spending related to<br />
development and funding of AmeriServe during its bankruptcy<br />
reorganization process.<br />
36 TRICON GLOBAL RESTAURANTS, INC. AND SUBSIDIARIES<br />
In 1999, net cash provided by investing activities increased<br />
$220 million to $522 million. The majority of the increase is<br />
due to higher gross refranchising proceeds and proceeds from<br />
the sale of international short-term investments in connection<br />
with a planned tax-efficient repatriation to the U.S.<br />
Although we report gross proceeds in our Consolidated<br />
Statements of Cash Flows, we also consider refranchising proceeds<br />
on an “after-tax” basis. We define after-tax proceeds as<br />
gross refranchising proceeds less the settlement of working<br />
capital liabilities (primarily accounts payable and property<br />
taxes) related to the units refranchised and payment of taxes<br />
on the gains. The after-tax proceeds can be used to pay down<br />
debt or repurchase shares. After-tax proceeds were approximately<br />
$261 million in <strong>2000</strong> which reflects a 62% decrease<br />
from 1999. This decrease was due to the refranchising of significantly<br />
fewer restaurants in <strong>2000</strong>. After-tax proceeds were<br />
approximately $683 million in 1999, a 13% increase versus<br />
1998. The increase was principally due to a greater number<br />
of units refranchised as well as the mix of restaurants sold<br />
and the level of taxable gains from each refranchising.<br />
Net cash used in financing activities was $207 million<br />
compared to $1.1 billion last year. Less cash was available<br />
for financing activities in <strong>2000</strong> due to a net cash use from<br />
investing activities as described above, and a use of cash to<br />
fund increased share repurchases as more fully discussed in<br />
Note 18. Accordingly, we repaid less debt in <strong>2000</strong> than 1999.<br />
In 1999, net cash used in financing activities was essentially<br />
unchanged versus 1998 at $1.1 billion. Payments on our<br />
unsecured Term Loan Facility and our unsecured Revolving<br />
Credit Facility totaled $1.0 billion.<br />
In 1999, our Board of Directors authorized the repurchase<br />
of up to $350 million of our outstanding Common Stock,<br />
excluding applicable transaction fees. This Share Repurchase<br />
Program was completed in <strong>2000</strong>. During <strong>2000</strong>, we repurchased<br />
over 6.4 million shares for approximately $216 million. During<br />
1999, we repurchased over 3.3 million shares for approximately<br />
$134 million. See Note 18.<br />
On February 14, 2001, our Board of Directors authorized<br />
a new Share Repurchase Program, as more fully described in<br />
Note 18. The new Share Repurchase Program authorizes us<br />
to repurchase, over the next two years, up to $300 million of<br />
our outstanding Common Stock, excluding applicable transaction<br />
fees. We have not repurchased any shares under this<br />
Program as of March 9, 2001.
Financing Activities<br />
Our primary bank credit agreement, as amended in <strong>2000</strong> and<br />
1999, is comprised of a senior, unsecured Term Loan Facility<br />
and a $3 billion senior unsecured Revolving Credit Facility<br />
(collectively referred to as the “Credit Facilities”), both of<br />
which mature on October 2, 2002. Amounts outstanding<br />
under our Revolving Credit Facility are expected to fluctuate,<br />
but Term Loan Facility reductions may not be reborrowed.<br />
At December 30, <strong>2000</strong>, we had unused Revolving Credit<br />
Facility borrowings available aggregating $1.8 billion, net of<br />
outstanding letters of credit of $190 million. We believe that<br />
we will be able to refinance a portion of our Credit Facilities<br />
with publicly issued bonds within the next twelve months.<br />
As a result of this refinancing, we are likely to experience an<br />
increase in our interest rates, subject to rates available at the<br />
time of refinancing. We also believe we will be able to replace<br />
or refinance the remaining Credit Facilities prior to maturity<br />
with new borrowings which will reflect the market conditions<br />
or terms available at that time.<br />
The Credit Facilities subject us to significant interest expense<br />
and principal repayment obligations, which are limited in<br />
the near term, to prepayment events as defined in the credit<br />
agreement. Interest on the Credit Facilities is based principally<br />
on the London Interbank Offered Rate (“LIBOR”) plus<br />
a variable margin factor as defined in the credit agreement.<br />
Therefore, our future borrowing costs may fluctuate depending<br />
upon the volatility in LIBOR. We currently mitigate a<br />
portion of our interest rate risk through the use of derivative<br />
financial instruments. See Notes 11 and 13 and our market<br />
risk discussion for further discussions of our interest rate risk.<br />
Consolidated Financial Condition<br />
Assets increased $188 million or 5% to $4.1 billion. The<br />
increase is primarily attributable to the increase in receivables<br />
arising from the impact of the AmeriServe bankruptcy reorganization<br />
process as more fully discussed in Note 21.<br />
Liabilities decreased $50 million or 1% to $4.5 billion.<br />
Excluding the impact of the aforementioned increase in<br />
accounts receivable arising from the AmeriServe bankruptcy<br />
reorganization process, our working capital deficit decreased<br />
8% to approximately $769 million at December 30, <strong>2000</strong><br />
from $832 million at December 25, 1999. The decline was<br />
primarily due to a reduction in accounts payable related to<br />
fewer Company restaurants as a result of our portfolio<br />
actions, a change in payment terms to our new primary U.S.<br />
distributor of food and paper and a reduction in accrued<br />
compensation. These decreases were partially offset by an<br />
increase in accrued income taxes.<br />
We believe the Company has adequate financial resources<br />
to meet its requirements in 2001 and beyond.<br />
Other Significant Known Events, Trends or Uncertainties<br />
Expected to Impact 2001 Ongoing Operating Profit<br />
Comparisons with <strong>2000</strong><br />
Impact of New Unconsolidated Affiliates<br />
Consistent with our strategy to focus our capital on key<br />
international markets, we entered into an agreement in 1999<br />
to form a new venture during <strong>2000</strong> in Canada with our largest<br />
franchisee in that market. During the third quarter of <strong>2000</strong>,<br />
we contributed 320 restaurants in exchange for a 50% equity<br />
interest in the venture. These stores represented approximately<br />
16% of the total International Company restaurants at the<br />
time of the formation of the new venture. Including the stores<br />
contributed by our partner, the new venture had approximately<br />
650 restaurants at the time of formation. We did not record<br />
any gain or loss on the transfer of assets to this new venture.<br />
Previously, the results from the restaurants we contributed<br />
to the Canadian venture were consolidated. The impact of<br />
this transaction on operating results is similar to the Portfolio<br />
Effect of our refranchising activities. Consequently, this<br />
transaction will result in a decline in our Company sales,<br />
restaurant margin dollars and G&A expenses as well as higher<br />
franchise fees and equity income. In addition to the Portfolio<br />
Effect, franchise fees will be higher since the royalty rate was<br />
increased for those stores contributed by our partner to this<br />
venture. The overall impact from the formation of this venture<br />
on <strong>2000</strong> ongoing operating profit was slightly favorable.<br />
Had this venture been formed at the beginning of <strong>2000</strong>, our<br />
International Company sales would have declined approximately<br />
10% compared to the reported decline of 4% for the<br />
year ended December 30, <strong>2000</strong>.<br />
In addition, we anticipate contributing about 50 restaurants<br />
to a new venture in Poland to be formed in 2001. We<br />
believe the impact on ongoing operating profit from the<br />
formation of the venture will not be significant.<br />
Impact of the Consolidation of an Unconsolidated Affiliate<br />
Beginning in fiscal 2001, we will consolidate a previously<br />
unconsolidated affiliate in our Consolidated Financial Statements<br />
as a result of a change in our intent to temporarily<br />
retain control of this affiliate. While we believe that the overall<br />
impact on our ongoing operating profit will not be significant,<br />
this change is expected to result in higher Company sales,<br />
restaurant margin dollars and G&A as well as decreased franchise<br />
fees and equity income. Had this change occurred at the<br />
beginning of <strong>2000</strong>, our International Company sales would<br />
have increased approximately 2% compared to the reported<br />
decline of 4% for the year ended December 30, <strong>2000</strong>.<br />
TRICON GLOBAL RESTAURANTS, INC. AND SUBSIDIARIES 37
Change in Casualty Loss Estimates<br />
Due to the inherent volatility of our actuarially-determined<br />
casualty loss estimates, it is reasonably possible that we<br />
will experience changes in estimated losses which could be<br />
material to our growth in ongoing operating profit in 2001.<br />
See Note 21 for a discussion of our casualty loss programs<br />
and estimates.<br />
Euro Conversion<br />
On January 1, 1999, eleven of the fifteen member countries<br />
of the European Economic and Monetary Union (“EMU”)<br />
adopted the Euro as a common legal currency and fixed conversion<br />
rates were established. Greece has since adopted the<br />
single currency on January 1, 2001, taking the total adopting<br />
countries to twelve. From January 1, 1999 through no later<br />
than February 28, 2002, all adopting countries will maintain<br />
a period of dual currency, where both legacy currencies and<br />
the Euro can be used in day-to-day credit transactions. Beginning<br />
January 1, 2002, new Euro-denominated bills and coins<br />
will be issued, and a transition period of up to two months<br />
will begin during which local currencies will be removed<br />
from circulation.<br />
We have Company and franchised businesses in the adopting<br />
member countries, which are preparing for the conversion.<br />
To date, expenditures associated with our conversion efforts<br />
have been relatively insignificant, totaling under $2 million.<br />
These expenditures have been concentrated mainly on consulting<br />
expenses for initial impact studies and head office<br />
accounting systems. We currently estimate that the total<br />
spending over the transition period will be approximately<br />
$5 million related to the conversion in the EMU member<br />
countries in which we operate stores. This is a reduction from<br />
our previous estimate of $10 million, primarily due to the<br />
refranchising of Company stores in certain EMU countries.<br />
Approximately 45% of these expenditures relate to capital<br />
expenditures for new point-of-sale and back-of-restaurant<br />
hardware and software to accommodate Euro-denominated<br />
transactions. We believe that adoption of the Euro by the<br />
United Kingdom would significantly increase this estimate<br />
due to the size of our businesses there relative to our aggregate<br />
businesses in the adopting member countries in which<br />
we operate.<br />
38 TRICON GLOBAL RESTAURANTS, INC. AND SUBSIDIARIES<br />
The pace of ultimate consumer acceptance of and our<br />
competitors’ responses to the Euro are currently unknown<br />
and may impact our existing plans. However, we know that,<br />
from a competitive perspective, we will be required to assess<br />
the impacts of product price transparency, potentially revise<br />
product bundling strategies and create Euro-friendly price<br />
points prior to 2002. We do not believe that these activities<br />
will have sustained adverse impacts on our businesses.<br />
Although the Euro does offer certain benefits to our treasury<br />
and procurement activities, these are not currently anticipated<br />
to be significant.<br />
We currently anticipate that our suppliers and distributors<br />
will continue to invoice us in local currencies until late 2001.<br />
We expect to begin dual pricing in our restaurants in late 2001.<br />
We expect to compensate employees in Euros beginning in<br />
2002. We believe that the most critical activity regarding the<br />
conversion for our businesses is the completion of the rollout<br />
of Euro-ready point-of-sale equipment and software by the<br />
end of 2001. Our current plans should enable us to be Eurocompliant<br />
prior to the requirements for these changes. Any<br />
delays in our ability to complete our plans, or in the ability of<br />
our key suppliers to be Euro-compliant, could have a material<br />
adverse impact on our results of operations, financial<br />
condition or cash flows.<br />
Quantitative and Qualitative Disclosures About<br />
Market Risk of Financial Instruments<br />
Market Risk of Financial Instruments<br />
Our primary market risk exposure with regard to financial<br />
instruments is to changes in interest rates, principally in the<br />
United States. We attempt to minimize this risk and lower<br />
our overall borrowing costs through utilization of derivative<br />
instruments such as interest rate swaps, collars and forward<br />
rate agreements.<br />
We are also exposed to the impact of foreign currency rate<br />
fluctuations. We attempt to minimize the risk exposure to<br />
foreign currency rate fluctuations on our investments in foreign<br />
operations by financing those investments with local<br />
currency debt when practical. We also use forward contracts<br />
on a limited basis to reduce our exposure to foreign currency<br />
rate fluctuations on foreign currency denominated financial<br />
instruments and significant foreign currency denominated<br />
cash flows. Additionally, certain foreign currency denominated<br />
cash, cash equivalents and short-term investments are
subject to tax considerations and local regulatory restrictions<br />
which limit our ability to utilize these funds outside the<br />
country in which they are held.<br />
At December 30, <strong>2000</strong>, a hypothetical 100 basis point<br />
increase in short-term interest rates would result in a reduction<br />
of $19 million in annual income before income taxes.<br />
The estimated reduction is based upon the unhedged portion<br />
of our variable rate debt and assumes no change in the volume<br />
or composition of debt at December 30, <strong>2000</strong>. In addition,<br />
the fair value of our interest rate derivative contracts would<br />
decrease approximately $11 million in value to us, and the<br />
fair value of our Senior Unsecured Notes would decrease<br />
approximately $25 million. Fair value was determined by<br />
discounting the projected cash flows.<br />
New Accounting Pronouncement<br />
See Note 2.<br />
Cautionary Statements<br />
From time to time, in both written reports and oral statements,<br />
we present “forward-looking statements” within the<br />
meaning of Section 27A of the Securities Act of 1933, as<br />
amended, and Section 21E of the Securities Exchange Act of<br />
1934, as amended. The statements include those identified by<br />
such words as “may,” “will,” “expect,” “anticipate,” “believe,”<br />
“plan” and other similar terminology. These “forward-looking<br />
statements” reflect our current expectations and are based upon<br />
data available at the time of the statements. Actual results<br />
involve risks and uncertainties, including both those specific<br />
to the Company and those specific to the industry, and could<br />
differ materially from expectations.<br />
Company risks and uncertainties include, but are not<br />
limited to, potentially substantial tax contingencies related<br />
to the Spin-off, which, if they occur, require us to indemnify<br />
PepsiCo, Inc.; our substantial debt leverage and the attendant<br />
potential restriction on our ability to borrow in the future, as<br />
well as our substantial interest expense and principal repayment<br />
obligations; our ability to replace or refinance the Credit<br />
Facilities at reasonable rates; potential unfavorable variances<br />
between estimated and actual liabilities including the liabilities<br />
related to the sale of the non-core businesses; the ongoing<br />
business viability of our key distributor of restaurant products<br />
and equipment in the U.S. and our ability to ensure adequate<br />
supply of restaurant products and equipment in our stores; our<br />
ability to complete our Euro conversion plans or the ability of<br />
our key suppliers to be Euro-compliant; the ongoing financial<br />
viability of our franchisees and licensees, our potential inability<br />
to identify qualified franchisees to purchase restaurants at<br />
prices we consider appropriate under our strategy to reduce<br />
the percentage of system units we operate; volatility of actuarially<br />
determined casualty loss estimates and adoption of<br />
new or changes in accounting policies and practices.<br />
Industry risks and uncertainties include, but are not limited<br />
to, global and local business, economic and political conditions;<br />
legislation and governmental regulation; competition;<br />
success of operating initiatives and advertising and promotional<br />
efforts; volatility of commodity costs and increases in<br />
minimum wage and other operating costs; availability and<br />
cost of land and construction; consumer preferences, spending<br />
patterns and demographic trends; political or economic<br />
instability in local markets and currency exchange rates.<br />
TRICON GLOBAL RESTAURANTS, INC. AND SUBSIDIARIES 39
Consolidated Statements of Income<br />
Fiscal years ended December 30, <strong>2000</strong>, December 25, 1999 and December 26, 1998<br />
(in millions, except per share amounts) <strong>2000</strong> 1999 1998<br />
Revenues<br />
Company sales $6,305 $7,099 $7,852<br />
Franchise and license fees 788 723 627<br />
40 TRICON GLOBAL RESTAURANTS, INC. AND SUBSIDIARIES<br />
7,093 7,822 8,479<br />
Costs and Expenses, net<br />
Company restaurants<br />
Food and paper 1,942 2,238 2,521<br />
Payroll and employee benefits 1,744 1,956 2,243<br />
Occupancy and other operating expenses 1,665 1,814 2,030<br />
5,351 6,008 6,794<br />
General and administrative expenses 879 920 941<br />
Other (income) expense (25) (16) (24)<br />
Facility actions net (gain) (176) (381) (275)<br />
Unusual items 204 51 15<br />
Total costs and expenses, net 6,233 6,582 7,451<br />
Operating Profit 860 1,240 1,028<br />
Interest expense, net 176 202 272<br />
Income Before Income Taxes 684 1,038 756<br />
Income Tax Provision 271 411 311<br />
Net Income $÷«413 $÷«627 $÷«445<br />
Basic Earnings Per Common Share $÷2.81 $÷4.09 $÷2.92<br />
Diluted Earnings Per Common Share $÷2.77 $÷3.92 $÷2.84<br />
See accompanying Notes to Consolidated Financial Statements.
Consolidated Statements of Cash Flows<br />
Fiscal years ended December 30, <strong>2000</strong>, December 25, 1999 and December 26, 1998<br />
(in millions) <strong>2000</strong> 1999 1998<br />
Cash Flows – Operating Activities<br />
Net income $«413 $««««627 $««««445<br />
Adjustments to reconcile net income to net cash<br />
provided by operating activities:<br />
Depreciation and amortization 354 386 417<br />
Facility actions net gain (176) (381) (275)<br />
Unusual items 120 45 15<br />
Other liabilities and deferred credits (5) 65 58<br />
Deferred income taxes (51) (16) 3<br />
Other non-cash charges and credits, net 43 66 117<br />
Changes in operating working capital, excluding<br />
effects of acquisitions and dispositions:<br />
Accounts and notes receivable (161) (28) (8)<br />
Inventories 11 6 4<br />
Prepaid expenses and other current assets (3) (13) (20)<br />
Accounts payable and other current liabilities (94) (215) 10<br />
Income taxes payable 40 23 (92)<br />
Net change in operating working capital (207) (227) (106)<br />
Net Cash Provided by Operating Activities 491 565 674<br />
Cash Flows – Investing Activities<br />
Capital spending (572) (470) (460)<br />
Proceeds from refranchising of restaurants 381 916 784<br />
Acquisition of restaurants (24) (6) –<br />
AmeriServe Funding, net (70) – –<br />
Short-term investments (21) 39 (57)<br />
Sales of property, plant and equipment 64 51 58<br />
Other, net 5 (8) (23)<br />
Net Cash (Used in) Provided by Investing Activities (237) 522 302<br />
Cash Flows – Financing Activities<br />
Proceeds from Notes – – 604<br />
Revolving Credit Facility activity, by original maturity<br />
More than three months – proceeds – – 400<br />
More than three months – payments – – (900)<br />
Three months or less, net 82 (860) (120)<br />
Proceeds from long-term debt – 4 4<br />
Payments of long-term debt (99) (180) (1,068)<br />
Short-term borrowings – three months or less, net (11) 21 (53)<br />
Repurchase shares of common stock (216) (134) –<br />
Other, net 37 30 13<br />
Net Cash Used in Financing Activities (207) (1,119) (1,120)<br />
Effect of Exchange Rate Changes on Cash and Cash Equivalents (3) – (3)<br />
Net Increase (Decrease) in Cash and Cash Equivalents 44 (32) (147)<br />
Cash and Cash Equivalents – Beginning of Year 89 121 268<br />
Cash and Cash Equivalents – End of Year $«133 $÷÷÷89 $÷÷121<br />
Supplemental Cash Flow Information<br />
Interest paid $«194 $÷÷212 $÷÷303<br />
Income taxes paid 252 340 310<br />
Significant Non-Cash Investing and Financing Activities<br />
Issuance of promissory note to acquire an unconsolidated affiliate $«««25 – –<br />
Contribution of non-cash net assets to an unconsolidated affiliate 67 – –<br />
See accompanying Notes to Consolidated Financial Statements.<br />
TRICON GLOBAL RESTAURANTS, INC. AND SUBSIDIARIES 41
Consolidated Balance Sheets<br />
December 30, <strong>2000</strong> and December 25, 1999<br />
(in millions) <strong>2000</strong> 1999<br />
ASSETS<br />
Current Assets<br />
Cash and cash equivalents $÷÷133 $÷÷÷89<br />
Short-term investments, at cost 63 48<br />
Accounts and notes receivable, less allowance: $82 in <strong>2000</strong> and $13 in 1999 302 161<br />
Inventories 47 61<br />
Prepaid expenses and other current assets 68 68<br />
Deferred income tax assets 75 59<br />
Total Current Assets 688 486<br />
Property, Plant and Equipment, net 2,540 2,531<br />
Intangible Assets, net 419 527<br />
Investments in Unconsolidated Affiliates 257 170<br />
Other Assets 245 247<br />
Total Assets $«4,149 $«3,961<br />
LIABILITIES AND SHAREHOLDERS’ DEFICIT<br />
Current Liabilities<br />
Accounts payable and other current liabilities $÷÷978 $«1,085<br />
Income taxes payable 148 96<br />
Short-term borrowings 90 117<br />
Total Current Liabilities 1,216 1,298<br />
Long-term Debt 2,397 2,391<br />
Other Liabilities and Deferred Credits 848 825<br />
Deferred Income Taxes 10 7<br />
Total Liabilities 4,471 4,521<br />
Shareholders’ Deficit<br />
Preferred stock, no par value, 250 shares authorized; no shares issued – –<br />
Common stock, no par value, 750 shares authorized; 147 and 151 shares issued<br />
in <strong>2000</strong> and 1999, respectively 1,133 1,264<br />
Accumulated deficit (1,278) (1,691)<br />
Accumulated other comprehensive income (177) (133)<br />
Total Shareholders’ Deficit (322) (560)<br />
Total Liabilities and Shareholders’ Deficit $«4,149 $«3,961<br />
See accompanying Notes to Consolidated Financial Statements.<br />
42 TRICON GLOBAL RESTAURANTS, INC. AND SUBSIDIARIES
Consolidated Statements of Shareholders’ Deficit<br />
and Comprehensive Income<br />
Fiscal years ended December 30, <strong>2000</strong>, December 25, 1999 and December 26, 1998<br />
Accumulated<br />
Other<br />
Issued Common Stock Accumulated Comprehensive<br />
(in millions) Shares Amount Deficit Income Total<br />
Balance at December 27, 1997 152 $1,271 $(2,763) $(128) $(1,620)<br />
Net income 445 445<br />
Foreign currency translation adjustment<br />
Minimum pension liability adjustment<br />
(20) (20)<br />
(includes tax of $1 million) (2) (2)<br />
Comprehensive Income<br />
Adjustment to opening equity related to<br />
423<br />
net advances from PepsiCo<br />
Stock option exercises<br />
12 12<br />
(includes tax benefits of $3 million) 1 22 22<br />
Balance at December 26, 1998 153 $1,305 $(2,318) $(150) $(1,163)<br />
Net income 627 627<br />
Foreign currency translation adjustment<br />
Minimum pension liability adjustment<br />
15 15<br />
(includes tax of $1 million) 2 2<br />
Comprehensive Income<br />
Adjustment to opening equity related to<br />
644<br />
net advances from PepsiCo 7 7<br />
Repurchase of shares of common stock<br />
Stock option exercises<br />
(3) (134) (134)<br />
(includes tax benefits of $14 million) 1 39 39<br />
Compensation-related events 47 47<br />
Balance at December 25, 1999 151 $1,264 $(1,691) $(133) $÷«(560)<br />
Net income 413 413<br />
Foreign currency translation adjustment (44) (44)<br />
Comprehensive Income 369<br />
Repurchase of shares of common stock<br />
Stock option exercises<br />
(6) (216) (216)<br />
(includes tax benefits of $5 million) 2 46 46<br />
Compensation-related events 39 39<br />
Balance at December 30, <strong>2000</strong> 147 $1,133 $(1,278) $(177) $÷«(322)<br />
See accompanying Notes to Consolidated Financial Statements.<br />
TRICON GLOBAL RESTAURANTS, INC. AND SUBSIDIARIES 43
Notes to Consolidated Financial Statements<br />
(tabular amounts in millions, except share data)<br />
Note 1 Description of Business<br />
TRICON Global Restaurants, Inc. and Subsidiaries (collectively<br />
referred to as “TRICON” or the “Company”) is comprised<br />
of the worldwide operations of KFC, Pizza Hut and Taco Bell<br />
(the “Concepts”) and is the world’s largest quick service<br />
restaurant company based on the number of system units,<br />
with over 30,000 units in over 100 countries and territories.<br />
Approximately 34% of our system units are located outside the<br />
U.S. References to TRICON throughout these Consolidated<br />
Financial Statements are made using the first person notations<br />
of “we,” “us” or “our.” Through our widely-recognized<br />
Concepts, TRICON develops, operates, franchises and licenses<br />
a system of both traditional and non-traditional quick service<br />
restaurants. Our traditional restaurants feature dine-in, carryout<br />
and, in some instances, drive-thru or delivery service.<br />
Non-traditional units, which are principally licensed outlets,<br />
include express units and kiosks which have a more limited<br />
menu and operate in non-traditional locations like airports,<br />
gasoline service stations, convenience stores, stadiums,<br />
amusement parks and colleges, where a full-scale traditional<br />
outlet would not be practical or efficient. Each Concept has<br />
proprietary menu items and emphasizes the preparation of<br />
food with high quality ingredients as well as unique recipes<br />
and special seasonings to provide appealing, tasty and attractive<br />
food at competitive prices.<br />
We also previously operated other restaurant businesses<br />
which were disposed of in 1997, which included California<br />
Pizza Kitchen, Chevys Mexican Restaurant, D’Angelo’s<br />
Sandwich Shops, East Side Mario’s and Hot ’n Now (collectively,<br />
the “Non-core Businesses”).<br />
Note 2 Summary of Significant Accounting Policies<br />
Our preparation of the accompanying Consolidated Financial<br />
Statements in conformity with accounting principles generally<br />
accepted in the U.S. requires us to make estimates and assumptions<br />
that affect reported amounts of assets and liabilities,<br />
disclosure of contingent assets and liabilities at the date of the<br />
financial statements, and the reported amounts of revenues<br />
and expenses during the reporting period. Actual results<br />
could differ from the estimates.<br />
Principles of Consolidation and Basis of Preparation<br />
TRICON was created as an independent, publicly owned<br />
company on October 6, 1997 (the “Spin-off Date”) via a<br />
tax-free distribution by our former parent, PepsiCo, Inc.<br />
(“PepsiCo”), of our Common Stock (the “Distribution”<br />
44 TRICON GLOBAL RESTAURANTS, INC. AND SUBSIDIARIES<br />
or “Spin-off”) to its shareholders. Intercompany accounts<br />
and transactions have been eliminated. Investments in<br />
unconsolidated affiliates in which we exercise significant<br />
influence but do not control are accounted for by the equity<br />
method. Our share of the net income or loss of those unconsolidated<br />
affiliates and net foreign exchange gains or losses<br />
are included in other (income) expense.<br />
Internal Development Costs and Abandoned Site Costs<br />
We capitalize direct costs associated with the site acquisition<br />
and construction of a Company unit on that site, including<br />
direct internal payroll and payroll-related costs and direct<br />
external costs. Only those site-specific costs incurred subsequent<br />
to the time that the site acquisition is considered<br />
probable are capitalized. We consider acquisition probable<br />
upon final site approval. If we subsequently make a determination<br />
that a site for which internal development costs have<br />
been capitalized will not be acquired or developed, any previously<br />
capitalized internal development costs are expensed at<br />
this date and included in general and administrative expenses.<br />
Fiscal Year<br />
Our fiscal year ends on the last Saturday in December and,<br />
as a result, a fifty-third week is added every five or six years.<br />
Fiscal year <strong>2000</strong> included 53 weeks. Fiscal years 1999 and<br />
1998 included 52 weeks. The first three quarters of each fiscal<br />
year consist of 12 weeks and the fourth quarter consists of<br />
17 weeks in fiscal years with 53 weeks and 16 weeks in fiscal<br />
years with 52 weeks. Our subsidiaries operate on similar fiscal<br />
calendars with period end dates suited to their businesses.<br />
Period end dates are within one week of TRICON’s period<br />
end date with the exception of our international businesses,<br />
which close one period or one month earlier to facilitate<br />
consolidated reporting.<br />
Direct Marketing Costs<br />
We report substantially all of our direct marketing costs in<br />
occupancy and other operating expenses. We<br />
charge direct marketing costs to expense ratably<br />
in relation to revenues over the year in which<br />
incurred and, in the case of advertising production<br />
costs, in the year first shown. Deferred<br />
direct marketing costs, which are classified as<br />
prepaid expenses, consist of media and<br />
related advertising production costs<br />
which will generally be used for the<br />
first time in the next fiscal year.
To the extent we participate in independent advertising cooperatives,<br />
we expense our contributions as incurred. At the end<br />
of <strong>2000</strong> and 1999, we had deferred marketing costs of $8 million<br />
and $3 million, respectively. Our advertising expenses<br />
were $325 million, $385 million and $435 million in <strong>2000</strong>,<br />
1999 and 1998, respectively. The decline in our advertising<br />
expense is primarily due to fewer Company stores as a result<br />
of our refranchising program.<br />
Research and Development Expenses<br />
Research and development expenses, which we expense as<br />
incurred, were $24 million in both <strong>2000</strong> and 1999 and $21<br />
million in 1998.<br />
Stock-Based Employee Compensation<br />
We measure stock-based employee compensation cost for<br />
financial statement purposes in accordance with Accounting<br />
Principles Board Opinion No. 25, “Accounting for Stock<br />
Issued to Employees,” and its related interpretations. We<br />
include pro forma information in Note 15 as required by Statement<br />
of Financial Accounting Standards (“SFAS”) No. 123,<br />
“Accounting for Stock-Based Compensation” (“SFAS 123”).<br />
Accordingly, we measure compensation cost for the stock<br />
option grants to the employees as the excess of the average<br />
market price of the Common Stock at the grant date over<br />
the amount the employee must pay for the stock. Our policy<br />
is to generally grant stock options at the average market price<br />
of the underlying Common Stock at the date of grant.<br />
Derivative Instruments<br />
As discussed in the New Accounting Pronouncement Not<br />
Yet Adopted section which follows, we have not yet adopted<br />
SFAS No. 133 “Accounting for Derivative Instruments and<br />
Hedging Activities,” (“SFAS 133”) as of December 30, <strong>2000</strong>.<br />
In all years presented, our treatment of derivative instruments<br />
is as follows.<br />
We utilize interest rate swaps, collars and forward rate<br />
agreements to hedge our exposure to fluctuations in interest<br />
rates. We recognize the interest differential to be paid or<br />
received on interest rate swap and forward rate agreements<br />
as an adjustment to interest expense as the differential occurs.<br />
We recognize the interest differential to be paid or received<br />
on an interest rate collar as an adjustment to interest expense<br />
when the interest rate falls below or rises above the collared<br />
range. We reflect the recognized interest differential not yet<br />
settled in cash in the accompanying Consolidated Balance<br />
Sheets as a current receivable or payable. If we terminate an<br />
interest rate swap, collar or forward rate position, any gain or<br />
loss realized upon termination would be deferred and amortized<br />
to interest expense over the remaining term of the underlying<br />
debt instrument it was intended to modify or would be<br />
recognized immediately if the underlying debt instrument<br />
was settled prior to maturity.<br />
Each period, we recognize in income foreign exchange<br />
gains and losses on forward contracts that are designated<br />
and effective as hedges of foreign currency receivables<br />
or payables as the differential occurs.<br />
These gains or losses are largely offset by<br />
the corresponding gain or loss recognized in<br />
income on the currency translation of the receivable<br />
or payable, as both amounts are based upon the<br />
same exchange rates. We reflect the recognized foreign<br />
currency differential for forward contracts not yet settled<br />
in cash on the accompanying Consolidated Balance<br />
Sheets each period as a current receivable or payable.<br />
Each period, we recognize in income the change in fair<br />
value of foreign exchange gains and losses on forward<br />
contracts that are entered into to mitigate the<br />
foreign exchange risk of certain forecasted<br />
foreign currency denominated royalty<br />
receipts. We reflect the fair value of<br />
these forward contracts not yet settled<br />
on the Consolidated Balance Sheets as<br />
a current receivable or payable. If a foreign<br />
currency forward contract is terminated prior to maturity,<br />
the gain or loss recognized upon termination would be<br />
immediately recognized in income.<br />
We defer gains and losses on futures and options contracts<br />
that are designated and effective as hedges of future commodity<br />
purchases and include them in the cost of the related raw<br />
materials when purchased. Changes in the value of futures<br />
and options contracts that we use to hedge components of our<br />
commodity purchases are highly correlated to changes in the<br />
value of the purchased commodity attributable to the hedged<br />
component. If the degree of correlation were to diminish such<br />
that the two were no longer considered highly correlated, we<br />
would immediately recognize subsequent changes in the value<br />
of the futures and option contracts in income.<br />
Cash and Cash Equivalents<br />
Cash equivalents represent funds we have temporarily<br />
invested (with original maturities not exceeding three months)<br />
as part of managing our day-to-day operating cash receipts<br />
and disbursements.<br />
Inventories<br />
We value our inventories at the lower of cost (computed on<br />
the first-in, first-out method) or net realizable value.<br />
TRICON GLOBAL RESTAURANTS, INC. AND SUBSIDIARIES 45
Property, Plant and Equipment<br />
We state property, plant and equipment (“PP&E”) at cost<br />
less accumulated depreciation and amortization, impairment<br />
writedowns and valuation allowances. We calculate depreciation<br />
and amortization on a straight-line basis over the estimated<br />
useful lives of the assets as follows: 5 to 25 years for buildings<br />
and improvements, 3 to 20 years for machinery and equipment<br />
and 3 to 7 years for capitalized software costs. As discussed further<br />
below, we suspend depreciation and amortization on assets<br />
related to restaurants that are held for disposal. Our depreciation<br />
and amortization expense was $319 million, $345 million<br />
and $372 million in <strong>2000</strong>, 1999 and 1998, respectively.<br />
Intangible Assets<br />
Intangible assets include both identifiable intangibles and<br />
goodwill arising from the allocation of purchase prices of<br />
businesses acquired. Where appropriate, intangible assets are<br />
allocated to individual restaurants at the time of acquisition.<br />
We base amounts assigned to identifiable intangibles on independent<br />
appraisals or internal estimates. Goodwill represents<br />
the residual purchase price after allocation to all identifiable<br />
net assets. Our intangible assets are stated at historical allocated<br />
cost less accumulated amortization and impairment writedowns.<br />
We amortize intangible assets on a straight-line basis<br />
as follows: up to 20 years for reacquired franchise rights, 3 to<br />
34 years for trademarks and other identifiable intangibles and<br />
up to 20 years for goodwill. As discussed further below, we<br />
suspend amortization on intangible assets allocated to restaurants<br />
that are held for disposal. Our amortization expense was<br />
$38 million, $44 million and $52 million in <strong>2000</strong>, 1999<br />
and 1998, respectively.<br />
Franchise and License Fees<br />
We execute franchise or license agreements for each point of<br />
distribution which sets out the terms of our arrangement with<br />
the franchisee or licensee. Our franchise and certain license<br />
agreements require the franchisee or licensee to pay an initial,<br />
non-refundable fee and continuing fees based upon a percentage<br />
of sales. Subject to our approval and payment of a renewal<br />
fee, a franchisee may generally renew its agreement upon its<br />
expiration. Our direct costs of the sales and servicing of<br />
franchise and license agreements are charged to general and<br />
administrative expenses as incurred.<br />
We recognize initial fees as revenue when we have performed<br />
substantially all initial services required by the franchise<br />
or license agreement, which is generally upon opening of a<br />
store. We recognize continuing fees as earned with an appropriate<br />
provision for estimated uncollectible amounts, which<br />
is included in general and administrative expenses. We recognize<br />
renewal fees in income when a renewal agreement becomes<br />
effective. We include initial fees collected upon the sale of a<br />
restaurant to a franchisee in refranchising gains (losses). Fees<br />
for development rights are capitalized and amortized over<br />
the life of the development agreement.<br />
46 TRICON GLOBAL RESTAURANTS, INC. AND SUBSIDIARIES<br />
Refranchising Gains (Losses)<br />
Refranchising gains (losses) includes the gains or losses from<br />
the sales of our restaurants to new and existing franchisees<br />
and the related initial franchise fees, reduced by transaction<br />
costs and direct administrative costs of refranchising. In<br />
executing our refranchising initiatives, we most often offer<br />
groups of restaurants. We recognize gains on restaurant<br />
refranchisings when the sale transaction closes, the franchisee<br />
has a minimum amount of the purchase price in at-risk<br />
equity and we are satisfied that the franchisee can meet its<br />
financial obligations. Otherwise, we defer refranchising gains<br />
until those criteria have been met. We only consider the<br />
stores in the group “held for disposal” when the group is<br />
expected to be sold at a loss. We recognize estimated losses<br />
on restaurants to be refranchised and suspend depreciation<br />
and amortization when: (a) we make a decision to refranchise<br />
stores; (b) the estimated fair value less costs to sell is less than<br />
the carrying amount of the stores; and (c) the stores can be<br />
immediately removed from operations. When we make a<br />
decision to retain a store previously held for refranchising, we<br />
revalue the store at the lower of its net book value at our<br />
original disposal decision date less normal depreciation and<br />
amortization during the period held for disposal or its current<br />
fair market value. This value becomes the store’s new<br />
cost basis. We charge (or credit) any difference between the<br />
store’s carrying amount and its new cost basis to refranchising<br />
gains (losses). When we make a decision to close a store previously<br />
held for refranchising, we reverse any previously<br />
recognized refranchising loss and then record the store closure<br />
costs as described below. For groups of restaurants expected<br />
to be sold at a gain, we typically do not suspend depreciation<br />
and amortization until the sale is probable. For practical purposes,<br />
we treat the closing date as the point at which the sale<br />
is probable. Refranchising gains (losses) also include charges<br />
for estimated exposures related to those partial guarantees of<br />
franchisee loan pools and contingent lease liabilities which<br />
arose from refranchising activities. These exposures are more<br />
fully discussed in Note 21.<br />
Store Closure Costs<br />
Effective for closure decisions made on or subsequent<br />
to April 23, 1998, we recognize the cost<br />
of writing down the carrying amount of a<br />
restaurant’s assets as store closure costs when<br />
we have closed or replaced the restaurant<br />
within the same quarter our decision<br />
is made. Store closure<br />
costs also include costs<br />
of disposing of the assets<br />
as well as other facilityrelated<br />
expenses from
previously closed stores. These costs are expensed as incurred.<br />
Additionally, we record a liability for the net present value of<br />
any remaining operating lease obligations after the expected<br />
closure date, net of estimated sublease income, if any, at the<br />
date the closure is considered probable.<br />
Considerable management judgment is necessary to estimate<br />
future cash flows. Accordingly, actual results could vary<br />
significantly from the estimates.<br />
Impairment of Long-Lived Assets<br />
We review our long-lived assets related to each restaurant<br />
to be held and used in the business, including any allocated<br />
intangible assets, semi-annually for impairment, or whenever<br />
events or changes in circumstances indicate that the carrying<br />
amount of a restaurant may not be recoverable. We evaluate<br />
restaurants using a “two-year history of operating losses” as<br />
our primary indicator of potential impairment. Based on the<br />
best information available, we write down an impaired restaurant<br />
to its estimated fair market value, which becomes its new<br />
cost basis. We generally measure estimated fair market value<br />
by discounting estimated future cash flows. In addition, after<br />
April 23, 1998, when we decide to close a store beyond the<br />
quarter in which the closure decision is made, it is reviewed<br />
for impairment and depreciable lives are adjusted. The impairment<br />
evaluation is based on the estimated cash flows from<br />
continuing use until the expected disposal date plus the<br />
expected terminal value.<br />
Considerable management judgment is necessary to estimate<br />
future cash flows. Accordingly, actual results could vary<br />
significantly from our estimates.<br />
Impairment of Investments in Unconsolidated Affiliates<br />
and Enterprise-Level Goodwill<br />
Our methodology for determining and measuring impairment<br />
of our investments in unconsolidated affiliates and enterpriselevel<br />
goodwill is similar to the methodology we use for our<br />
restaurants except: (a) the recognition test for an investment<br />
in an unconsolidated affiliate compares the carrying amount<br />
of our investment to a forecast of our share of the unconsolidated<br />
affiliate’s undiscounted cash flows after interest and<br />
taxes instead of undiscounted cash flows before interest and<br />
taxes used for our restaurants; and (b) enterprise-level goodwill<br />
is generally evaluated at a country level instead of by<br />
individual restaurant. Also, we record impairment charges<br />
related to investments in unconsolidated affiliates whenever<br />
other circumstances indicate that a decrease in the value of<br />
an investment has occurred which is other than temporary.<br />
Considerable management judgment is necessary to estimate<br />
future cash flows. Accordingly, actual results could vary<br />
significantly from our estimates.<br />
New Accounting Pronouncement Not Yet Adopted<br />
In June 1998, the Financial Accounting Standards Board (the<br />
“FASB”) issued SFAS 133. SFAS 133 establishes accounting<br />
and reporting standards requiring that every derivative instrument<br />
(including certain derivative instruments embedded in<br />
other contracts) be recorded in the balance sheet as either an<br />
asset or liability measured at its fair value. SFAS 133 requires<br />
that changes in the derivative’s fair value be recognized currently<br />
in earnings unless specific hedge accounting criteria are met.<br />
Special accounting for qualifying hedges allows a derivative’s<br />
gains and losses to offset the related change in fair value on<br />
the hedged item in the Consolidated Statements of Income<br />
or be deferred through Accumulated Other Comprehensive<br />
Income until a hedged forecasted transaction affects earnings.<br />
SFAS 133 requires that a company formally document, designate<br />
and assess the effectiveness of transactions to receive<br />
hedge accounting treatment. In June <strong>2000</strong>, the FASB issued<br />
SFAS No. 138, “Accounting for Certain Derivative Instruments<br />
and Certain Hedging Activities,” which amended<br />
certain provisions of SFAS 133.<br />
As required, we adopted these statements on December 31,<br />
<strong>2000</strong>, which is the beginning of our 2001 fiscal year. The<br />
transition adjustments resulting from the adoption of SFAS 133<br />
were not significant. In addition, the adoption of these statements<br />
could increase volatility in our earnings and other<br />
comprehensive income.<br />
Note 3 Comprehensive Income<br />
Accumulated Other Comprehensive Income of $177 million<br />
and $133 million as of December 30, <strong>2000</strong> and December 25,<br />
1999, respectively, consisted entirely of foreign currency<br />
translation adjustment.<br />
The changes in foreign currency translation adjustment<br />
are as follows:<br />
<strong>2000</strong> 1999 1998<br />
Foreign currency translation adjustment<br />
arising during the period $(44) $15 $(21)<br />
Less: Foreign currency translation<br />
adjustment included in net income – – 1<br />
Net foreign currency translation<br />
adjustment $(44) $15 $(20)<br />
TRICON GLOBAL RESTAURANTS, INC. AND SUBSIDIARIES 47
Note 4 Earnings Per Common Share (“EPS”)<br />
48 TRICON GLOBAL RESTAURANTS, INC. AND SUBSIDIARIES<br />
<strong>2000</strong> 1999 1998<br />
Net income<br />
Basic EPS:<br />
Weighted-average common<br />
$«413 $«627 $«445<br />
shares outstanding 147 153 153<br />
Basic EPS $2.81 $4.09 $2.92<br />
Diluted EPS:<br />
Weighted-average common<br />
shares outstanding 147 153 153<br />
Shares assumed issued on exercise<br />
of dilutive share equivalents 19 24 20<br />
Shares assumed purchased with<br />
proceeds of dilutive share equivalents (17) (17) (17)<br />
Shares applicable to diluted earnings 149 160 156<br />
Diluted EPS $2.77 $3.92 $2.84<br />
Unexercised employee stock options to purchase approximately<br />
10.8 million, 2.5 million and 1.0 million shares of<br />
our Common Stock for the years ended December 30, <strong>2000</strong>,<br />
December 25, 1999 and December 26, 1998, respectively,<br />
were not included in the computation of diluted EPS because<br />
their exercise prices were greater than the average market<br />
price of our Common Stock during the year.<br />
Note 5 Items Affecting Comparability of Net Income<br />
Accounting Changes<br />
In 1998 and 1999, we adopted several accounting and<br />
human resource policy changes (collectively, the “accounting<br />
changes”) that impacted our 1999 operating profit. These<br />
changes, which we believe are material in the aggregate, fall<br />
into three categories:<br />
• required changes in accounting principles generally accepted<br />
in the U.S. (“GAAP”),<br />
• discretionary methodology changes implemented to more<br />
accurately measure certain liabilities and<br />
• policy changes driven by our human resource and accounting<br />
standardization programs.<br />
Required Changes in GAAP<br />
Effective December 27, 1998, we adopted Statement of Position<br />
98-1 (“SOP 98-1”), “Accounting for the Costs of Computer<br />
Software Developed or Obtained for Internal Use.” SOP 98-1<br />
identifies the characteristics of internal-use software and specifies<br />
that once the preliminary project stage is complete, direct external<br />
costs, certain direct internal payroll and payroll-related costs<br />
and interest costs incurred during the development of computer<br />
software for internal use should be capitalized and amortized.<br />
Previously, we expensed all software development and procurement<br />
costs as incurred. In 1999, we capitalized approximately<br />
$13 million of internal software development costs and third<br />
party software costs that we would have previously expensed.<br />
The amortization of computer software assets that became<br />
ready for their intended use in 1999 was insignificant.<br />
In addition, we adopted Emerging Issues Task Force Issue<br />
No. 97-11 (“EITF 97-11”), “Accounting for Internal Costs<br />
Relating to Real Estate Property Acquisitions,” upon its<br />
issuance in March 1998. EITF 97-11 limits the capitalization<br />
of internal real estate acquisition costs to those site-specific<br />
costs incurred subsequent to the time that the real estate<br />
acquisition is probable. We consider acquisition of the property<br />
probable upon final site approval. In the first quarter of<br />
1999, we also made a discretionary policy change limiting the<br />
types of costs eligible for capitalization to those direct cost<br />
types described as capitalizable under SOP 98-1. Prior to the<br />
adoption of EITF 97-11, all pre-acquisition real estate activities<br />
were considered capitalizable. This change unfavorably impacted<br />
our 1999 operating profit by approximately $3 million.<br />
To conform to the Securities and Exchange Commission’s<br />
April 23, 1998 interpretation of SFAS No. 121, “Accounting<br />
for the Impairment of Long-Lived Assets and for Long-Lived<br />
Assets to Be Disposed Of,” our store closure accounting policy<br />
was changed in 1998. Effective for closure decisions made<br />
on or subsequent to April 23, 1998, we recognize store closure<br />
costs when we have closed the restaurant within the same<br />
quarter the closure decision is made. When we decide to close<br />
a restaurant beyond the quarter in which the closure decision<br />
is made, it is reviewed for impairment. The impairment evaluation<br />
is based on the estimated cash flows from continuing<br />
use until the expected date of disposal plus the expected<br />
terminal value. If the restaurant is not fully impaired, we<br />
continue to depreciate the assets over their estimated remaining<br />
useful life. Prior to April 23, 1998, we recognized store<br />
closure costs and generally suspended depreciation and amortization<br />
when we decided to close a restaurant within the<br />
next twelve months. In fiscal year 1999, this change resulted<br />
in additional depreciation and amortization of approximately<br />
$3 million through April 23, 1999.<br />
Discretionary Methodology Changes<br />
In 1999, the methodology used by our independent actuary<br />
was refined and enhanced to provide a more reliable estimate<br />
of the self-insured portion of our current and prior years’<br />
ultimate loss projections related to workers’ compensation,<br />
general liability and automobile liability insurance programs<br />
(collectively “casualty loss(es)”). Our prior practice was to apply<br />
a fixed factor to increase our independent actuary’s ultimate<br />
loss projections which was at the 51% confidence level for<br />
each year to approximate our targeted 75% confidence level.
Confidence level means the likelihood that our actual casualty<br />
losses will be equal to or below those estimates. Based on our<br />
independent actuary’s opinion, our prior practice produced a<br />
very conservative confidence factor at a level higher than our<br />
target of 75%. Our actuary now provides an actuarial estimate<br />
at our targeted 75% confidence level in the aggregate<br />
for all self-insured years. The change in methodology resulted<br />
in a one-time increase in our 1999 operating profit of over<br />
$8 million.<br />
At the end of 1998, we changed our method of determining<br />
the pension discount rate to better reflect the assumed<br />
investment strategies we would most likely use to invest any<br />
short-term cash surpluses. Accounting for pensions requires<br />
us to develop an assumed interest rate on securities with which<br />
the pension liabilities could be effectively settled. In estimating<br />
this discount rate, we look at rates of return on high-quality<br />
corporate fixed income securities currently available and<br />
expected to be available during the period to maturity of the<br />
pension benefits. As it is impractical to find an investment<br />
portfolio which exactly matches the estimated payment stream<br />
of the pension benefits, we often have projected short-term<br />
cash surpluses. Previously, we assumed that all short-term cash<br />
surpluses would be invested in U.S. government securities.<br />
Our new methodology assumes that our investment strategies<br />
would be equally divided between U.S. government securities<br />
and high-quality corporate fixed income securities. The pension<br />
discount methodology change resulted in a one-time increase<br />
in our 1999 operating profit of approximately $6 million.<br />
Human Resource and Accounting Standardization Programs<br />
In 1999, our vacation policies were conformed to a calendaryear<br />
based, earn-as-you-go, use-or-lose policy. The change<br />
provided a one-time favorable increase in our 1999 operating<br />
profit of approximately $7 million. Other accounting policy<br />
standardization changes by our three U.S. Concepts provided<br />
a one-time favorable increase in our 1999 operating profit of<br />
approximately $1 million.<br />
Our 1999 operating results included the favorable impact<br />
of approximately $29 million ($18 million after-tax or $0.11<br />
per diluted share) from these accounting changes. The estimated<br />
impact is summarized below:<br />
1999<br />
Restaurant Operating<br />
Margin G&A Profit<br />
U.S. $11 $÷4 $15<br />
Unallocated – 14 14<br />
Total $11 $18 $29<br />
1997 Fourth Quarter Charge<br />
In the fourth quarter of 1997, we recorded a $530 million<br />
unusual charge ($425 million after-tax). The charge included<br />
estimates for (a) costs of closing stores, primarily at Pizza Hut<br />
and Tricon Restaurants International; (b) reductions to fair<br />
market value, less costs to sell, of the carrying amounts of<br />
certain restaurants we intended to refranchise; (c) impairments<br />
of certain restaurants intended to be used in the business;<br />
(d) impairments of certain investments in unconsolidated<br />
affiliates to be retained; and (e) costs of related personnel<br />
reductions. Below is a summary of the 1999 and 1998 activity<br />
related to our asset valuation allowances and liabilities<br />
recognized as a result of the 1997 fourth quarter charge:<br />
Asset<br />
Valuation<br />
Allowances Liabilities Total<br />
Balance at December 27, 1997 $261 $129 $390<br />
Amounts used (131) (54) (185)<br />
(Income) expense impacts:<br />
Completed transactions (27) (7) (34)<br />
Decision changes (22) (17) (39)<br />
Estimate changes 15 (7) 8<br />
Other 1 – 1<br />
Balance at December 26, 1998 97 44 141<br />
Amounts used (87) (32) (119)<br />
(Income) expense impacts:<br />
Completed transactions (5) – (5)<br />
Decision changes 1 (3) (2)<br />
Estimate changes (7) (9) (16)<br />
Other 1 – 1<br />
Balance at December 25, 1999 $÷÷– $÷÷– $÷÷–<br />
During 1999 and 1998, we continued to re-evaluate our<br />
prior estimates of the fair market value of units to be refranchised<br />
or closed and other liabilities arising from the charge.<br />
In 1999, we recorded favorable adjustments of $13 million<br />
($10 million after-tax) and $11 million ($10 million aftertax)<br />
included in facility actions net gain and unusual items,<br />
respectively. In 1998, favorable adjustments of $54 million<br />
($33 million after-tax) and $11 million ($7 million after-tax)<br />
were included in facility actions net gain and unusual items,<br />
respectively. The 1999 and 1998 adjustments primarily related<br />
to decisions to retain certain stores originally expected to be<br />
disposed of, lower-than-expected losses from stores disposed<br />
of, favorable lease settlements with certain lessors related to<br />
stores closed and changes in estimated costs.<br />
Our operating profit reflects the benefit from the suspension<br />
of depreciation and amortization of approximately<br />
$12 million ($7 million after-tax) and $33 million ($21 million<br />
after-tax) in 1999 and 1998, respectively, for stores held<br />
for disposal. The benefits from the suspension of depreciation<br />
and amortization related to stores that were operating at the<br />
end of the respective periods ceased when the stores were<br />
refranchised or closed or a subsequent decision was made to<br />
retain the stores.<br />
TRICON GLOBAL RESTAURANTS, INC. AND SUBSIDIARIES 49
Facility Actions Net Gain<br />
Facility actions net gain consists of three components as described in Note 2:<br />
• Refranchising gains (losses),<br />
• Store closure costs (credits), and<br />
• Impairment of long-lived assets for restaurants we intend to continue to use in the business and, since April 23, 1998,<br />
restaurants we intend to close beyond the quarter in which the closure decision is made.<br />
The components of facility actions net gain for <strong>2000</strong>, 1999 and 1998 were as follows:<br />
<strong>2000</strong> 1999 1998<br />
(Excluding (Excluding<br />
1997 4th 1997 4th<br />
Qtr. Charge Qtr. Charge<br />
Total Total Adjustments) Total Adjustments)<br />
U.S.<br />
Refranchising net gains (a) $(202) $(405) $(396) $(275) $(249)<br />
Store closure costs (credits) 6 5 15 (9) 27<br />
Impairment charges for stores that will continue to be used in the business 3 6 6 23 23<br />
Impairment charges for stores to be closed in the future 5 9 9 5 5<br />
Facility actions net gain (188) (385) (366) (256) (194)<br />
International<br />
Refranchising net (gains) losses (a) 2 (17) (22) (4) (32)<br />
Store closure costs (credits) 4 8 7 (18) 2<br />
Impairment charges for stores that will continue to be used in the business 5 10 10 2 2<br />
Impairment charges for stores to be closed in the future 1 3 3 1 1<br />
Facility actions net (gain) loss 12 4 (2) (19) (27)<br />
Worldwide<br />
Refranchising net gains (a) (200) (422) (418) (279) (281)<br />
Store closure costs (credits) 10 13 22 (27) 29<br />
Impairment charges for stores that will continue to be used in the business (b) 8 16 16 25 25<br />
Impairment charges for stores to be closed in the future (b) 6 12 12 6 6<br />
Facility actions net gain $(176) $(381) $(368) $(275) $(221)<br />
Facility actions net gain, after-tax $÷(98) $(226) $(216) $(162) $(129)<br />
(a) Includes initial franchise fees in the U.S. of $17 million in <strong>2000</strong>, $38 million in 1999 and $39 million in 1998, and in International of $3 million,<br />
$7 million and $5 million in <strong>2000</strong>, 1999 and 1998, respectively. See Note 6.<br />
(b) Impairment charges for <strong>2000</strong> and 1999 were recorded against the following asset categories:<br />
<strong>2000</strong> 1999<br />
Property, plant and equipment $12 $25<br />
Intangible assets:<br />
Goodwill – 1<br />
Reacquired franchise rights 2 2<br />
Total impairment $14 $28<br />
50 TRICON GLOBAL RESTAURANTS, INC. AND SUBSIDIARIES
The following table summarizes the <strong>2000</strong> and 1999 activity<br />
related to all stores disposed of or held for disposal including<br />
the stores that were covered by the fourth quarter 1997 charge.<br />
We believe that the remaining carrying amounts are adequate<br />
to complete our disposal actions.<br />
Asset<br />
Impairment<br />
Allowances Liabilities<br />
Carrying amount at December 26, 1998 $«127 $«77<br />
Amounts used (100) (36)<br />
(Income) expense impact:<br />
New decisions 9 15<br />
Estimate/decision changes (20) 15<br />
Other 4 –<br />
Carrying amount at December 25, 1999 $«÷20 $«÷71<br />
Amounts used (10) (22)<br />
(Income) expense impact:<br />
New decisions 14 5<br />
Estimate/decision changes (4) (7)<br />
Other – 3<br />
Carrying amount at December 30, <strong>2000</strong> $«÷20 $«÷50<br />
The carrying values of assets held for disposal, which<br />
were all located in the U.S., were $2 million and $40 million<br />
at December 30, <strong>2000</strong> and December 25, 1999, respectively.<br />
These assets included restaurants and in 1999, our idle processing<br />
facility in Wichita, Kansas, which was sold in <strong>2000</strong><br />
for its approximate net book value.<br />
The following table summarizes Company sales and restaurant<br />
margin related to stores held for disposal at December 30,<br />
<strong>2000</strong> or disposed of through refranchising or closure during<br />
<strong>2000</strong>, 1999 and 1998. Restaurant margin represents Company<br />
sales less the cost of food and paper, payroll and employee<br />
benefits and occupancy and other operating expenses. These<br />
amounts do not include the impact of Company stores that<br />
have been or are expected to be contributed to new unconsolidated<br />
affiliates.<br />
<strong>2000</strong> 1999 1998<br />
Stores held for disposal or disposed of in <strong>2000</strong>:<br />
Sales $408 $750 $690<br />
Restaurant margin 55 97 92<br />
Stores disposed of in 1999 and 1998:<br />
Sales $659 $1,825<br />
Restaurant margin 66 192<br />
The margin reported above reflects a benefit from the suspension<br />
of depreciation and amortization of approximately<br />
$2 million, $9 million and $32 million in <strong>2000</strong>, 1999 and<br />
1998, respectively. The loss of restaurant margin from the<br />
disposal of these stores was largely mitigated by (a) increased<br />
franchise fees from stores refranchised; (b) lower field general<br />
and administrative expenses; and (c) the estimated interest<br />
savings from the reduction of average debt with net after-tax<br />
refranchising proceeds.<br />
Unusual Items<br />
<strong>2000</strong> 1999 1998<br />
U.S. $÷29 $13 $12<br />
International 8 3 4<br />
Unallocated 167 35 (1)<br />
Worldwide $204 $51 $15<br />
After-tax $129 $29 $÷3<br />
Unusual items in <strong>2000</strong> included: (a) $170 million of<br />
charges and direct incremental costs related to the AmeriServe<br />
Food Distribution, Inc. (“AmeriServe”) bankruptcy reorganization<br />
process; (b) an increase in the estimated costs of<br />
settlement of certain wage and hour litigation and associated<br />
defense costs incurred in <strong>2000</strong>; (c) costs associated with the<br />
formation of an unconsolidated affiliate in Canada; and<br />
(d) the reversal of excess provisions arising from the resolution<br />
of a dispute associated with the disposition of our<br />
Non-core Businesses. See Note 21 for further discussion of<br />
the AmeriServe bankruptcy reorganization process and wage<br />
and hour litigation.<br />
Unusual items in 1999 included: (a) the write-off of<br />
approximately $41 million owed to us by AmeriServe at the<br />
AmeriServe bankruptcy petition date; (b) an increase in the<br />
estimated costs of settlement of certain wage and hour litigation<br />
and associated defense and other costs incurred in 1999;<br />
(c) favorable adjustments to our 1997 fourth quarter charge;<br />
(d) the write-down to estimated fair market value less cost to<br />
sell of our idle Wichita processing facility; (e) costs associated<br />
with the formation of unconsolidated affiliates in Canada<br />
and Poland; (f) the impairment of enterprise-level goodwill<br />
in one of our international businesses; and (g) severance and<br />
other exit costs related to strategic decisions to streamline<br />
the infrastructure of our international business.<br />
Unusual items in 1998 included: (a) an increase in the<br />
estimated costs of settlement of certain wage and hour litigation<br />
and associated defense and other costs incurred in 1998;<br />
(b) severance and other exit costs related to strategic decisions<br />
to streamline the infrastructure of our international businesses;<br />
(c) favorable adjustments to our 1997 fourth quarter charge<br />
related to anticipated actions that were not taken, primarily<br />
severance; (d) the writedown to estimated fair market value<br />
less costs to sell our minority interest in a privately held Noncore<br />
Business, previously carried at cost; and (e) reversals of<br />
certain impairment allowances and lease liabilities relating to<br />
better-than-expected proceeds from the sale of properties and<br />
settlement of lease liabilities associated with properties retained<br />
upon the sale of a Non-core Business.<br />
TRICON GLOBAL RESTAURANTS, INC. AND SUBSIDIARIES 51
Note 6 Franchise and License Fees<br />
52 TRICON GLOBAL RESTAURANTS, INC. AND SUBSIDIARIES<br />
<strong>2000</strong> 1999 1998<br />
Initial fees, including renewal fees<br />
Initial franchise fees included in<br />
$÷÷48 $÷÷«÷71 $÷÷÷67<br />
refranchising gains (20) (45) (44)<br />
28 26 23<br />
Continuing fees 760 697 604<br />
Note 7 Other (Income) Expense<br />
$÷788 $÷÷«723 $÷÷627<br />
<strong>2000</strong> 1999 1998<br />
Equity income from investments in<br />
unconsolidated affiliates $÷«(25) $÷÷÷(19) $÷÷«(18)<br />
Foreign exchange net loss (gain) – 3 (6)<br />
Note 8 Property, Plant and Equipment, net<br />
$÷«(25) $÷÷÷(16) $÷÷«(24)<br />
<strong>2000</strong> 1999<br />
Land $÷÷543 $÷÷572<br />
Buildings and improvements 2,469 2,553<br />
Capital leases, primarily buildings 82 102<br />
Machinery and equipment 1,522 1,598<br />
4,616 4,825<br />
Accumulated depreciation and amortization (2,056) (2,279)<br />
Impairment allowances (20) (15)<br />
Note 9 Intangible Assets, net<br />
$÷2,540 $«2,531<br />
<strong>2000</strong> 1999<br />
Reacquired franchise rights $÷÷«264 $÷÷326<br />
Trademarks and other identifiable intangibles 102 124<br />
Goodwill 53 77<br />
$÷÷«419 $÷÷527<br />
In determining the above amounts, we have subtracted<br />
accumulated amortization of $415 million for <strong>2000</strong> and<br />
$456 million for 1999.<br />
Note 10 Accounts Payable and Other Current Liabilities<br />
<strong>2000</strong> 1999<br />
Accounts payable $÷÷«326 $«÷«375<br />
Accrued compensation and benefits 209 281<br />
Other current liabilities 443 429<br />
$÷÷«978 $«1,085<br />
Note 11 Short-term Borrowings and Long-term Debt<br />
<strong>2000</strong> 1999<br />
Short-term Borrowings<br />
Current maturities of long-term debt $÷÷«10 $÷÷«47<br />
International lines of credit 68 45<br />
Other 12 25<br />
$«««««90 $«««117<br />
Long-term Debt<br />
Senior, unsecured Term Loan Facility,<br />
due October 2002<br />
Senior, unsecured Revolving Credit<br />
$÷«689 $÷«774<br />
Facility, expires October 2002 1,037 955<br />
Senior, Unsecured Notes, due May 2005 (7.45%) 351 352<br />
Senior, Unsecured Notes, due May 2008 (7.65%) 251 251<br />
Capital lease obligations (see Note 12) 74 97<br />
Other, due through 2010 (6% –11%) 5 9<br />
2,407 2,438<br />
Less current maturities of long-term debt (10) (47)<br />
$2,397 $2,391<br />
Our primary bank credit agreement, as amended in <strong>2000</strong><br />
and 1999, is comprised of a senior, unsecured Term Loan<br />
Facility and a $3 billion senior unsecured Revolving Credit<br />
Facility (collectively referred to as the “Credit Facilities”) both<br />
of which mature on October 2, 2002. Amounts outstanding<br />
under our Revolving Credit Facility are expected to fluctuate,<br />
but Term Loan Facility reductions may not be reborrowed.<br />
The Credit Facilities are subject to various covenants including<br />
financial covenants relating to maintenance of specific<br />
leverage and fixed charge coverage ratios. In addition, the<br />
Credit Facilities contain affirmative and negative covenants<br />
including, among other things, limitations on certain additional<br />
indebtedness, guarantees of indebtedness, cash dividends,<br />
aggregate non-U.S. investment and certain other transactions,<br />
as defined in the agreement. The Credit Facilities require<br />
prepayment of a portion of the proceeds from certain capital<br />
market transactions and refranchising of restaurants.<br />
Interest on amounts borrowed is payable at least quarterly<br />
at variable rates, based principally on the London Interbank<br />
Offered Rate (“LIBOR”) plus a variable margin factor. At<br />
December 30, <strong>2000</strong> and December 25, 1999, the weighted<br />
average interest rate on our variable rate debt was 7.2% and<br />
6.6%, respectively, which includes the effects of associated<br />
interest rate swaps. See Note 13 for a discussion of our use<br />
of derivative instruments, our management of credit risk<br />
inherent in derivative instruments and fair value information<br />
related to debt and interest rate swaps.
At December 30, <strong>2000</strong>, we had unused borrowings available<br />
under the Revolving Credit Facility of approximately<br />
$1.8 billion, net of outstanding letters of credit of $190 million.<br />
Under the terms of the Revolving Credit Facility, we<br />
may borrow up to $3.0 billion less outstanding letters of<br />
credit. We pay a facility fee on the Revolving Credit Facility.<br />
The facility fee rate and the aforementioned variable margin<br />
factor are determined based on the more favorable of our<br />
leverage ratio or third-party senior debt ratings as defined<br />
in the agreement.<br />
In 1997, we filed a shelf registration statement with the<br />
Securities and Exchange Commission with respect to offerings<br />
of up to $2 billion of senior unsecured debt. In May 1998, we<br />
issued $350 million 7.45% Unsecured Notes due May 15,<br />
2005 and $250 million 7.65% Unsecured Notes due May 15,<br />
2008 (collectively referred to as the “Notes”). Interest commenced<br />
on November 15, 1998 and is payable semi-annually<br />
thereafter. The effective interest rate on the 2005 Notes and<br />
the 2008 Notes is 7.6% and 7.8%, respectively.<br />
Interest expense on the short-term borrowings and longterm<br />
debt was $190 million, $218 million and $291 million<br />
in <strong>2000</strong>, 1999 and 1998, respectively. As more fully discussed<br />
in Note 21, interest expense of $9 million on incremental<br />
borrowings related to the AmeriServe bankruptcy reorganization<br />
process has been included in unusual items.<br />
The annual maturities of long-term debt through 2005<br />
and thereafter, excluding capital lease obligations, are 2001 –<br />
$2.4 million; 2002 – $1.7 billion; 2003 – $1 million; 2004 –<br />
$0.2 million; 2005 – $352 million and $251 million thereafter.<br />
Note 12 Leases<br />
We have non-cancelable commitments under both capital<br />
and long-term operating leases, primarily for our restaurants.<br />
Capital and operating lease commitments expire at various<br />
dates through 2087 and, in many cases, provide for rent escalations<br />
and renewal options. Most leases require us to pay<br />
related executory costs, which include property taxes, maintenance<br />
and insurance.<br />
Future minimum commitments and sublease receivables<br />
under non-cancelable leases are set forth below:<br />
Commitments Sublease Receivables<br />
Direct<br />
Capital Operating Financing Operating<br />
2001 $÷12 $÷«194 $÷2 $10<br />
2002 12 176 2 9<br />
2003 11 154 1 8<br />
2004 11 137 1 7<br />
2005 10 127 1 6<br />
Thereafter 94 630 9 37<br />
$150 $1,418 $16 $77<br />
At year-end <strong>2000</strong>, the present value of minimum payments<br />
under capital leases was $74 million.<br />
The details of rental expense and income are set forth below:<br />
<strong>2000</strong> 1999 1998<br />
Rental expense<br />
Minimum $253 $263 $308<br />
Contingent 28 28 25<br />
$281 $291 $333<br />
Minimum rental income $÷18 $÷20 $÷18<br />
Contingent rentals are generally based on sales levels in<br />
excess of stipulated amounts contained in the lease agreements.<br />
Note 13 Financial Instruments<br />
Derivative Instruments<br />
Our policy prohibits the use of derivative instruments for<br />
trading purposes, and we have procedures in place to monitor<br />
and control their use. Our use of derivative instruments has<br />
included interest rate swaps, collars and forward rate agreements.<br />
In addition, we utilize on a limited basis, foreign<br />
currency forward contracts and commodity futures and options<br />
contracts. Our interest rate and foreign currency derivative<br />
contracts are entered into with financial institutions while<br />
our commodity contracts are generally exchange traded.<br />
We enter into interest rate swaps, collars, and forward rate<br />
agreements with the objective of reducing our exposure to<br />
interest rate risk for a portion of our debt and to lower our<br />
overall borrowing costs. Reset dates and the floating rate<br />
indices on the swaps and forward rate agreements match<br />
those of the underlying bank debt. Accordingly, any change<br />
in market value associated with the swaps and forward rate<br />
agreements is offset by the opposite market impact on the<br />
related debt. At December 30, <strong>2000</strong> and December 25,<br />
1999, we had outstanding pay-fixed interest rate swaps with<br />
notional amounts of $450 million and $800 million, respectively.<br />
At December 30, <strong>2000</strong> we also had outstanding<br />
pay-variable interest rate swaps with notional amounts of<br />
$350 million. Under the contracts, we agree with other parties<br />
to exchange, at specified intervals, the difference between<br />
variable rate and fixed rate amounts calculated on a notional<br />
principal amount. We had an aggregate receivable under the<br />
related swaps of $0.9 million and $0.4 million at December 30,<br />
<strong>2000</strong> and December 25, 1999, respectively. The swaps mature<br />
at various dates through 2005.<br />
During <strong>2000</strong> and 1999, we entered<br />
into interest rate collars to reduce interest<br />
rate sensitivity on a portion of our variable<br />
rate bank debt. Interest rate collars<br />
effectively lock in a range of interest<br />
rates by establishing a cap and floor.<br />
Reset dates and the floating index<br />
on the collars match those of<br />
the underlying bank debt.
If interest rates remain within the collared cap and floor, no<br />
payments are made. If rates rise above the cap level, we receive<br />
a payment. If rates fall below the floor level, we make a payment.<br />
At December 30, <strong>2000</strong> and December 25, 1999, we<br />
did not have any outstanding interest rate collars.<br />
We enter into foreign currency exchange contracts with the<br />
objective of reducing our exposure to earnings and cash flow<br />
volatility associated with foreign currency fluctuations. In<br />
<strong>2000</strong> and 1999, we entered into forward contracts to hedge<br />
our exposure related to certain foreign currency receivables<br />
and payables. The notional amount and maturity dates of<br />
these contracts match those of the underlying receivables or<br />
payables. Accordingly, any change in market value associated<br />
with the forward contracts is offset by the opposite market<br />
impact on the related receivables or payables. At December 30,<br />
<strong>2000</strong> and December 25, 1999, we had outstanding forward<br />
contracts related to certain foreign currency receivables and<br />
payables with notional amounts of $13 million and $9 million,<br />
respectively. Our net receivable under the related forward<br />
agreements, all of which terminate in 2001, was insignificant<br />
at December 30, <strong>2000</strong> and December 25, 1999.<br />
In <strong>2000</strong>, we entered into forward contracts to reduce our<br />
exposure to cash flow volatility associated with certain forecasted<br />
foreign currency denominated royalties. These forward<br />
contracts are short-term in nature, with termination dates<br />
matching royalty payments forecasted to be received within the<br />
next twelve months. At December 30, <strong>2000</strong>, we had outstanding<br />
forward contracts associated with forecasted royalty cash<br />
flows with notional amounts of $3 million. Our net receivable<br />
for these contracts as of December 30, <strong>2000</strong> was insignificant.<br />
Our credit risk from the interest rate swap, collar and<br />
forward rate agreements and foreign exchange contracts is<br />
dependent both on the movement in interest and currency<br />
rates and possibility of non-payment by counterparties. We<br />
mitigate credit risk by entering into these agreements with<br />
high-quality counterparties, netting swap and forward rate<br />
payments within contracts and limiting payments associated<br />
with the collars to differences outside the collared range.<br />
Open commodity future and option contracts and<br />
deferred gains and losses at year-end <strong>2000</strong> and 1999, as well<br />
as gains and losses recognized as part of cost of sales in <strong>2000</strong>,<br />
1999 and 1998, were not significant.<br />
Concentrations of Credit Risk<br />
Accounts receivable consists primarily of amounts due from<br />
franchisees and licensees. Concentrations of credit risk with<br />
respect to accounts receivable generally are limited due to a<br />
large number of franchisees and licensees. At December 30,<br />
<strong>2000</strong>, accounts receivable included amounts due from franchisees<br />
related to the temporary direct purchase program,<br />
which is more fully described in Note 21.<br />
54 TRICON GLOBAL RESTAURANTS, INC. AND SUBSIDIARIES<br />
Fair Value<br />
Excluding the financial instruments included in the table below,<br />
the carrying amounts of our other financial instruments<br />
approximate fair value.<br />
The carrying amounts and fair values of TRICON’s financial<br />
instruments are as follows:<br />
<strong>2000</strong> 1999<br />
Carrying Fair Carrying Fair<br />
Amount Value Amount Value<br />
Debt<br />
Short-term borrowings<br />
and long-term debt,<br />
excluding capital leases $2,413 $2,393 $2,411 $2,377<br />
Debt-related derivative<br />
instruments<br />
Open contracts in an<br />
asset position – (24) – (3)<br />
Debt, excluding<br />
capital leases $2,413 $2,369 $2,411 $2,374<br />
Guarantees and letters<br />
of credit $÷÷÷«– $÷÷«51 $÷÷÷«– $÷÷«27<br />
We estimated the fair value of debt, debt-related derivative<br />
instruments, guarantees and letters of credit using market<br />
quotes and calculations based on market rates. See Note 2<br />
for recently issued accounting pronouncements relating to<br />
derivative financial instruments.<br />
Note 14 Pension Plans and Postretirement Medical Benefits<br />
Pension Benefits<br />
We sponsor noncontributory defined benefit pension plans<br />
covering substantially all full-time U.S. salaried employees,<br />
certain hourly employees and certain international employees.<br />
Benefits are based on years of service and earnings or<br />
stated amounts for each year of service.<br />
Postretirement Medical Benefits<br />
Our postretirement plans provide health care benefits,<br />
principally to U.S. retirees and<br />
their dependents. These plans<br />
include retiree cost sharing provisions.<br />
Employees are eligible for<br />
benefits if they meet age and<br />
service requirements and qualify<br />
for retirement benefits.
The components of net periodic benefit cost are set forth below:<br />
Pension Benefits Postretirement Medical Benefits<br />
<strong>2000</strong> 1999 1998 <strong>2000</strong> 1999 1998<br />
Service cost $«19 $«20 $«21 $÷«2 $÷«2 $÷«2<br />
Interest cost 24 22 20 3 3 3<br />
Amortization of prior service cost 1 1 – (1) (2) (2)<br />
Expected return on plan assets (25) (24) (21)<br />
Amortization of transition (asset) obligation – – (2)<br />
Recognized actuarial loss – – 2<br />
Net periodic benefit cost $«19 $«19 $«20 $÷«4 $÷«3 $÷«3<br />
Additional (gain) loss recognized due to:<br />
Curtailment $÷(4) $÷(4) $÷«– $÷(1) $÷(1) $÷(3)<br />
Special termination benefits – – 3 – – 1<br />
Prior service costs are amortized on a straight-line basis over the average remaining service period of employees expected<br />
to receive benefits. Curtailment gains have generally been recognized in facility actions net gain.<br />
The change in benefit obligation and plan assets and reconciliation of funded status is as follows:<br />
Postretirement<br />
Pension Benefits Medical Benefits<br />
<strong>2000</strong> 1999 <strong>2000</strong> 1999<br />
Change in benefit obligation<br />
Benefit obligation at beginning of year $315 $315 $«45 $«38<br />
Service cost 19 20 2 2<br />
Interest cost 24 22 3 3<br />
Plan amendments – 6 – –<br />
Curtailment (gain) (5) (5) (2) (1)<br />
Benefits and expenses paid (19) (24) (3) (2)<br />
Actuarial loss (gain) 17 (19) 3 5<br />
Benefit obligation at end of year $351 $315 $«48 $«45<br />
Change in plan assets<br />
Fair value of plan assets at beginning of year $290 $259<br />
Actual return on plan assets 39 51<br />
Employer contributions 4 5<br />
Benefits paid (19) (23)<br />
Administrative expenses (1) (2)<br />
Fair value of plan assets at end of year $313 $290<br />
Reconciliation of funded status<br />
Funded status $«(38) $«(25) $(48) $(45)<br />
Unrecognized actuarial (gain) loss (30) (35) 5 3<br />
Unrecognized prior service costs 5 7 (1) (2)<br />
Accrued benefit liability at year-end $«(63) $«(53) $(44) $(44)<br />
Other comprehensive income attributable to change in<br />
additional minimum liability recognition<br />
Additional year-end information for pension plans with benefit<br />
obligations in excess of plan assets:<br />
$÷÷– $÷«(3)<br />
Benefit obligation $÷42 $÷31<br />
Fair value of plan assets – –<br />
Additional year-end information for pension plans with<br />
accumulated benefit obligations in excess of plan assets:<br />
Benefit obligation $÷42 $÷31<br />
Accumulated benefit obligation 21 12<br />
Fair value of plan assets – –<br />
TRICON GLOBAL RESTAURANTS, INC. AND SUBSIDIARIES 55
The assumptions used to compute the information above are set forth below:<br />
56 TRICON GLOBAL RESTAURANTS, INC. AND SUBSIDIARIES<br />
Postretirement<br />
Pension Benefits Medical Benefits<br />
<strong>2000</strong> 1999 1998 <strong>2000</strong> 1999 1998<br />
Discount rate 8.0% 7.8% 6.8% 8.3% 7.6% 7.0%<br />
Long-term rate of return on plan assets 10.0% 10.0% 10.0% – – –<br />
Rate of compensation increase 5.0% 5.5% 4.5% 5.0% 5.5% 4.5%<br />
We have assumed the annual increase in cost of postretirement<br />
medical benefits was 8.0% in <strong>2000</strong> and will be 7.5%<br />
in 2001. We are assuming the rate will decrease to an ultimate<br />
rate of 5.5% by 2007 and remain at that level thereafter.<br />
There is a cap on our medical liability for certain retirees, which<br />
is expected to be reached between the years 2001-2004; at<br />
that point our cost for a retiree will not increase.<br />
Assumed health care cost trend rates have a significant<br />
effect on the amounts reported for our postretirement health<br />
care plans. A one percent increase in the assumed<br />
healthcare cost trend rates would have increased our<br />
accumulated postretirement benefit<br />
obligation at December 30, <strong>2000</strong><br />
by $2.7 million. The impact<br />
on our <strong>2000</strong> benefit expense<br />
would not have been significant.<br />
Note 15 Employee Stock-Based<br />
Compensation<br />
At year-end <strong>2000</strong>, we had four stock<br />
option plans in effect: the TRICON<br />
Global Restaurants, Inc. Long-Term<br />
Incentive Plan (“1999 LTIP”), the<br />
1997 Long-Term Incentive Plan (“1997<br />
LTIP”), the TRICON Global Restaurants,<br />
Inc. Restaurant General Manager<br />
Stock Option Plan (“YUMBUCKS”) and<br />
the TRICON Global Restaurants, Inc.<br />
SharePower Plan (“SharePower”).<br />
We may grant options to purchase up to 7.6 million and<br />
22.5 million shares of stock under the 1999 LTIP and 1997<br />
LTIP, respectively, at a price equal to or greater than the average<br />
market price of the stock on the date of grant. New option<br />
grants can have varying vesting provisions and exercise periods.<br />
Previously granted options vest in periods ranging from<br />
immediate to 2006 and expire ten to fifteen years after grant.<br />
Potential awards to employees and non-employee directors<br />
under the 1999 LTIP include stock options, incentive stock<br />
options, stock appreciation rights, restricted stock, stock units,<br />
restricted stock units, performance shares and performance<br />
units. Potential awards to employees and non-employee<br />
directors under the 1997 LTIP include stock options, incen-<br />
tive stock options, stock appreciation rights, restricted stock<br />
and performance restricted stock units. We have issued only<br />
stock options and performance restricted stock units under<br />
the 1997 LTIP and have issued only stock options under<br />
the 1999 LTIP.<br />
We may grant options to purchase up to 7.5 million shares<br />
of stock under YUMBUCKS at a price equal to or greater than<br />
the average market price of the stock on the date of grant.<br />
YUMBUCKS options granted have a four year vesting period<br />
and expire ten years after grant. We do not anticipate that<br />
any further SharePower grants will be made although options<br />
previously granted could be outstanding through 2006.<br />
At the Spin-off Date, we converted certain of the unvested<br />
options to purchase PepsiCo stock that were held by our<br />
employees to TRICON stock options under either the 1997<br />
LTIP or SharePower. We converted the options at amounts<br />
and exercise prices that maintained the amount of unrealized<br />
stock appreciation that existed immediately prior to the Spinoff.<br />
The vesting dates and exercise periods of the options<br />
were not affected by the conversion. Based on their original<br />
PepsiCo grant date, our converted options vest in periods<br />
ranging from one to ten years and expire ten to fifteen years<br />
after grant.<br />
The following table reflects pro forma net income and<br />
earnings per common share had we elected to adopt the fair<br />
value approach of SFAS 123.<br />
<strong>2000</strong> 1999 1998<br />
Net Income<br />
As reported $«413 $«627 $«445<br />
Pro forma 379 597 425<br />
Basic Earnings per Common Share<br />
As reported $2.81 $4.09 $2.92<br />
Pro forma 2.58 3.90 2.79<br />
Diluted Earnings per Common Share<br />
As reported $2.77 $3.92 $2.84<br />
Pro forma 2.55 3.73 2.72<br />
The effects of applying SFAS 123 in the pro forma disclosures<br />
are not likely to be representative of the effects on<br />
pro forma net income for future years because variables such<br />
as the number of option grants, exercises and stock price<br />
volatility included in these disclosures may not be indicative<br />
of future activity.
We estimated the fair value of each option grant made during <strong>2000</strong>, 1999 and 1998 as of the date of grant using the<br />
Black-Scholes option pricing model with the following weighted average assumptions:<br />
<strong>2000</strong> 1999 1998<br />
Risk-free interest rate 6.4% 4.9% 5.5%<br />
Expected life (years) 6.0 6.0 6.0<br />
Expected volatility 32.6% 29.7% 28.8%<br />
Expected dividend yield 0.0% 0.0% 0.0%<br />
A summary of the status of all options granted to employees and non-employee directors as of December 30, <strong>2000</strong>,<br />
December 25, 1999 and December 26, 1998, and changes during the years then ended is presented below (tabular options<br />
in thousands):<br />
December 30, <strong>2000</strong> December 25, 1999 December 26, 1998<br />
Wtd. Avg. Wtd. Avg. Wtd. Avg.<br />
Options Exercise Price Options Exercise Price Options Exercise Price<br />
Outstanding at beginning of year 24,166 $31.18 22,699 $26.16 15,245 $23.03<br />
Granted at price equal to average market price 7,860 30.33 5,709 49.07 12,084 29.37<br />
Exercised (1,829) 21.84 (1,273) 19.51 (962) 18.93<br />
Forfeited (3,518) 33.99 (2,969) 31.94 (3,668) 25.60<br />
Outstanding at end of year 26,679 $31.20 24,166 $31.18 22,699 $26.16<br />
Exercisable at end of year 7,622 $24.59 3,665 $22.44 3,006 $21.16<br />
Weighted average fair value of options at date of grant $13.48 $19.20 $11.65<br />
The following table summarizes information about stock options outstanding and exercisable at December 30, <strong>2000</strong><br />
(tabular options in thousands):<br />
Options Outstanding<br />
Wtd. Avg.<br />
Options Exercisable<br />
Remaining Wtd. Avg. Wtd. Avg.<br />
Range of Exercise Prices Options Contractual Life Exercise Price Options Exercise Price<br />
$÷0.01 –17.80 1,395 3.91 $15.22 1,394 $15.22<br />
÷22.02–29.84 9,692 6.23 25.74 4,659 24.38<br />
÷30.28–34.47 10,799 8.44 30.97 1,292 31.47<br />
÷35.13–46.97 4,307 8.16 44.53 272 42.71<br />
÷72.75 486 8.26 72.75 5 72.75<br />
In November 1997, we granted two awards of performance<br />
restricted stock units of TRICON’s Common Stock to our<br />
Chief Executive Officer (“CEO”). The awards were made<br />
under the 1997 LTIP and may be paid in Common Stock or<br />
cash at the discretion of the Compensation Committee of the<br />
Board of Directors. Payments of the awards of $2.7 million<br />
and $3.6 million are contingent upon the CEO’s continued<br />
employment through January 25, 2001 and 2006, respectively,<br />
and our attainment of certain pre-established earnings thresholds,<br />
as defined. We expense these awards over the performance<br />
periods stipulated above. The annual amount included in<br />
earnings for <strong>2000</strong>, 1999 and 1998 was $1.3 million.<br />
During <strong>2000</strong> and 1999, modifications were made to certain<br />
1997 LTIP and SharePower options held by terminated<br />
employees. These modifications resulted in additional compensation<br />
expense of an insignificant amount in <strong>2000</strong> and<br />
$5.0 million in 1999 with a corresponding increase in our<br />
Common Stock account.<br />
26,679 7,622<br />
Note 16 Other Compensation and Benefit Programs<br />
We sponsor two deferred compensation benefit programs,<br />
the Executive Income Deferral Program and the Restaurant<br />
Deferred Compensation Plan (the “EID Plan” and the “RDC<br />
Plan,” respectively) for eligible employees and non-employee<br />
directors. The EID Plan allows participants to defer receipt of<br />
all or a portion of their annual salary and incentive compensation.<br />
The RDC Plan allows participants to defer a portion of<br />
their annual salary. As defined by the benefit programs, we credit<br />
the amounts deferred with earnings based<br />
on certain investment options<br />
selected by the participants.<br />
The EID Plan includes an<br />
investment option that allows<br />
participants to defer certain<br />
incentive compensation to purchase<br />
phantom shares of our<br />
Common Stock at a 25% discount<br />
from the average market<br />
price at the date of deferral (the<br />
“Discount Stock Account”).
Participants bear the risk of forfeiture of both the discount<br />
and any amounts deferred if they voluntarily separate from<br />
employment during the two year vesting period. We expense<br />
the intrinsic value of the discount over the vesting period.<br />
We phased in certain program changes to the EID Plan<br />
during 1999 and <strong>2000</strong>. These changes included limiting<br />
investment options, primarily to phantom shares of our<br />
Common Stock, and requiring the distribution of investments<br />
in the TRICON Common Stock investment options<br />
to be paid in shares of our Common Stock. Due to these<br />
changes, in 1998 we agreed to credit a one time premium<br />
to participant accounts on January 1, <strong>2000</strong>. The premium<br />
totaled approximately $3 million and was equal to 10% of<br />
the participants’ account balances as of December 31, 1999,<br />
excluding (a) investments in the Discount Stock Account<br />
and (b) deferrals made in 1999.<br />
Prior to January 1, 1999, we recognized as compensation<br />
expense all investment appreciation or depreciation within<br />
the EID Plan. Subsequent to January 1, 1999, we no longer<br />
recognize as compensation expense the appreciation or depreciation,<br />
if any, attributable to investments in the Discount<br />
Stock Account since these investments can only be settled in<br />
shares of our Common Stock. For 1998, we expensed $9 million<br />
related to appreciation attributable to investments in the<br />
Discount Stock Account. We also reduced our liabilities by<br />
$21 million related to investments in the Discount Stock<br />
Account and increased the Common Stock Account by the<br />
same amount at January 1, 1999.<br />
Subsequent to January 1, <strong>2000</strong>, we no longer recognized<br />
as compensation expense the appreciation or depreciation, if<br />
any, attributable to investments in the phantom shares of our<br />
Common Stock, since these investments can only be settled<br />
in shares of our Common Stock. For 1999, we recorded a<br />
benefit of $3 million related to depreciation of investments<br />
in phantom shares of our Common Stock impacted by the<br />
January <strong>2000</strong> plan amendment. We also reduced our liabilities<br />
by $12 million related to investments in the phantom shares<br />
of our Common Stock and increased the Common Stock<br />
Account by the same amount at January 1, <strong>2000</strong>.<br />
Our obligations under the EID Plan as of the end of <strong>2000</strong><br />
and 1999 were $27 million and $50 million, respectively. We<br />
recognized compensation expense of $6 million in both <strong>2000</strong><br />
and 1999 and $20 million in 1998 for the EID Plan.<br />
Investment options in the RDC Plan consist of phantom<br />
shares of various mutual funds and TRICON Common<br />
Stock. During 1998, RDC participants also became eligible<br />
to purchase phantom shares of our Common Stock<br />
under YUMSOP as defined below. We recognize<br />
compensation expense for the appreciation or<br />
depreciation, if any, attributable to all investments<br />
in the RDC Plan as well as for our<br />
matching contribution. Our obligations<br />
under the RDC program as of the end<br />
58 TRICON GLOBAL RESTAURANTS, INC. AND SUBSIDIARIES<br />
of <strong>2000</strong> and 1999 were $10 million and $6 million, respectively.<br />
We recognized annual compensation expense of<br />
$1 million in <strong>2000</strong>, 1999 and 1998 for the RDC Plan.<br />
We sponsor a contributory plan to provide retirement<br />
benefits under the provisions of Section 401(k) of the Internal<br />
Revenue Code (“401(k) Plan”) for eligible full-time U.S.<br />
salaried and certain hourly employees. Participants may elect<br />
to contribute up to 15% of their eligible compensation on a<br />
pre-tax basis. We are not required to make contributions to the<br />
Plan. In 1998, a Stock Ownership Program (“YUMSOP”)<br />
was added to the TRICON Common Stock investment option.<br />
Under YUMSOP, we make a partial discretionary matching<br />
contribution equal to a predetermined percentage of each<br />
participant’s contribution to the TRICON Common Stock<br />
Fund. We determine our percentage match at the beginning<br />
of each year based on the immediate prior year performance<br />
of our Concepts. We recognized as compensation expense our<br />
total matching contribution of $4 million in both <strong>2000</strong> and<br />
1999 and $1 million in 1998.<br />
Note 17 Shareholders’ Rights Plan<br />
On July 21, 1998, our Board of Directors declared a dividend<br />
distribution of one right for each share of Common Stock<br />
outstanding as of August 3, 1998 (the “Record Date”). Each<br />
right initially entitles the registered holder to purchase a unit<br />
consisting of one one-thousandth of a share (a “Unit”) of<br />
Series A Junior Participating Preferred Stock, without par<br />
value, at a purchase price of $130 per Unit, subject to adjustment.<br />
The rights, which do not have voting rights, will<br />
become exercisable for our Common Stock ten business days<br />
following a public announcement that a person or group has<br />
acquired, or has commenced or intends to commence a tender<br />
offer for, 15% or more, or 20% or more if such person<br />
or group owned 10% or more on the adoption date of this<br />
plan, of our Common Stock. In the event the rights become<br />
exercisable for Common Stock, each right will entitle its holder<br />
(other than the Acquiring Person as defined in the Agreement)<br />
to purchase, at the right’s then-current exercise price, TRICON<br />
Common Stock having a value of twice the exercise price of<br />
the right. In the event the rights become exercisable for<br />
Common Stock and thereafter we are acquired in a merger or<br />
other business combination, each right will entitle its holder to<br />
purchase, at the right’s then-current exercise price,<br />
common stock of the acquiring company having<br />
a value of twice the exercise price of the right.<br />
We can redeem the rights in their<br />
entirety, prior to becoming exercisable, at<br />
$0.01 per right under certain specified conditions.<br />
The rights expire on July 21,<br />
2008, unless we extend that date or we<br />
have earlier redeemed or exchanged the<br />
rights as provided in the Agreement.
This description of the rights is qualified in its entirety by<br />
reference to the Rights Agreement between TRICON and<br />
BankBoston, N.A., as Rights Agent, dated as of July 21,<br />
1998 (including the exhibits thereto).<br />
Note 18 Share Repurchase Program<br />
In 1999, our Board of Directors authorized the repurchase<br />
of up to $350 million of our outstanding Common Stock,<br />
excluding applicable transaction fees. This Share Repurchase<br />
Program was completed in <strong>2000</strong>. During <strong>2000</strong>, we repurchased<br />
over 6.4 million shares for approximately $216 million at an<br />
average price per share of $34. During 1999, we repurchased<br />
over 3.3 million shares for approximately $134 million at<br />
an average price of $40 per share. In total, we repurchased<br />
approximately 9.8 million shares at an average price of $36.<br />
On February 14, 2001, our Board of Directors authorized<br />
a new Share Repurchase Program. The new Share Repurchase<br />
Program authorizes us to repurchase, over a two-year period,<br />
up to $300 million of our outstanding Common Stock,<br />
excluding applicable transaction fees. Based on market conditions<br />
and other factors, repurchases may be made from time<br />
to time in the open market or through privately negotiated<br />
transactions, at the discretion of the Company.<br />
Note 19 Income Taxes<br />
The details of our income tax provision (benefit) are set<br />
forth below:<br />
<strong>2000</strong> 1999 1998<br />
Current<br />
Federal $215 $342 $231<br />
Foreign 66 46 55<br />
State 41 39 22<br />
322 427 308<br />
Deferred<br />
Federal (11) (18) (2)<br />
Foreign (9) 17 10<br />
State (31) (15) (5)<br />
(51) (16) 3<br />
$271 $411 $311<br />
Taxes payable were reduced by $5 million, $14 million, and<br />
$3 million in <strong>2000</strong>, 1999 and 1998, respectively, as a result<br />
of stock option exercises. In addition, goodwill and other<br />
intangibles were reduced by $2 million and $22 million in<br />
<strong>2000</strong> and 1999, respectively, as a result of the settlement of a<br />
disputed claim with the Internal Revenue Service relating to the<br />
deductibility of reacquired franchise rights and other intangibles.<br />
These reductions were offset by reductions in deferred and<br />
accrued taxes payable.<br />
In <strong>2000</strong>, valuation allowances that relate to deferred tax<br />
assets in certain states and foreign countries were reduced by<br />
$35 million ($23 million, net of federal tax) and $6 million,<br />
respectively, as a result of making a determination that it is<br />
more likely than not that these assets will be utilized in the<br />
current and future years. In 1999, valuation allowances that<br />
related to deferred tax assets in certain foreign countries were<br />
reduced by $13 million as a result of establishing a pattern<br />
of profitability.<br />
U.S. and foreign income before income taxes are set<br />
forth below:<br />
<strong>2000</strong> 1999 1998<br />
U.S. $518 $÷«876 $617<br />
Foreign 166 162 139<br />
$684 $1,038 $756<br />
The reconciliation of income taxes calculated at the<br />
U.S. federal tax statutory rate to our effective tax rate is<br />
set forth below:<br />
<strong>2000</strong> 1999 1998<br />
U.S. federal statutory rate 35.0% 35.0% 35.0%<br />
State income tax, net of federal tax benefit 3.7 3.0 2.8<br />
Foreign and U.S. tax effects attributable to<br />
foreign operations (0.4) 1.7 4.4<br />
Effect of unusual items (0.5) (0.5) (0.6)<br />
Adjustments relating to prior years 1.6 0.4 (1.1)<br />
Other, net 0.2 (0.1) 0.6<br />
Effective income tax rate 39.6% 39.5% 41.1%<br />
The details of <strong>2000</strong> and 1999 deferred tax liabilities<br />
(assets) are set forth below:<br />
<strong>2000</strong> 1999<br />
Intangible assets and property, plant and equipment $«184 $«170<br />
Other 35 25<br />
Gross deferred tax liabilities $«219 $«195<br />
Net operating loss and tax credit carryforwards $(137) $(140)<br />
Employee benefits (82) (91)<br />
Self-insured casualty claims (55) (38)<br />
Stores held for disposal – (12)<br />
Various liabilities and other (219) (178)<br />
Gross deferred tax assets (493) (459)<br />
Deferred tax assets valuation allowances 132 173<br />
Net deferred tax assets (361) (286)<br />
Net deferred tax (assets) liabilities $(142) $÷(91)<br />
<strong>Report</strong>ed in Consolidated Balance Sheets as:<br />
Deferred income tax assets $÷(75) $÷(59)<br />
Other assets (78) (51)<br />
Accounts payable and other current liabilities 1 12<br />
Deferred income taxes 10 7<br />
$(142) $÷(91)<br />
Our valuation allowances related to deferred tax assets<br />
decreased by $41 million in <strong>2000</strong> primarily due to the previously<br />
discussed change in circumstances related to deferred<br />
tax assets in certain states and foreign countries.<br />
A determination of the unrecognized deferred tax liability<br />
for temporary differences related to our investments in foreign<br />
subsidiaries and investments in foreign unconsolidated affiliates<br />
that are essentially permanent in duration is not practicable.<br />
TRICON GLOBAL RESTAURANTS, INC. AND SUBSIDIARIES 59
We have available net operating loss and tax credit carryforwards<br />
totaling $856 million at December 30, <strong>2000</strong> to<br />
reduce future tax of TRICON and certain subsidiaries. The<br />
carryforwards are related to a number of foreign and state<br />
jurisdictions. Of these carryforwards, $13 million expire in<br />
2001 and $760 million expire at various times between 2002<br />
and 2020. The remaining $83 million of carryforwards do<br />
not expire.<br />
Note 20 <strong>Report</strong>able Operating Segments<br />
We are engaged principally in developing, operating, franchising<br />
and licensing the worldwide KFC, Pizza Hut and Taco Bell<br />
concepts. KFC, Pizza Hut and Taco Bell operate throughout<br />
the U.S. and in 84, 87 and 13 countries and territories outside<br />
the U.S., respectively. Our five largest international markets<br />
based on ongoing operating profit in <strong>2000</strong> are Australia, China,<br />
Japan, Korea and the United Kingdom. At December 30, <strong>2000</strong>,<br />
we had 10 investments in unconsolidated affiliates outside the<br />
U.S. which operate KFC and/or Pizza Hut restaurants, the<br />
most significant of which are operating in Canada, Japan and<br />
the United Kingdom.<br />
We identify our operating segments based on management<br />
responsibility within the U.S. and International. For purposes<br />
of applying SFAS No. 131 “Disclosure About Segments of An<br />
Enterprise and Related Information” we consider our three<br />
U.S. Concept operating segments to be similar and therefore<br />
have aggregated them into a single reportable operating segment.<br />
Other than the U.S., no individual country represented 10%<br />
or more of our total revenues, profits or assets.<br />
Revenues <strong>2000</strong> 1999 1998<br />
United States $5,062 $5,748 $6,439<br />
International 2,031 2,074 2,040<br />
60 TRICON GLOBAL RESTAURANTS, INC. AND SUBSIDIARIES<br />
$7,093 $7,822 $8,479<br />
Operating Profit; Interest Expense, Net; and<br />
Income Before Income Taxes <strong>2000</strong> 1999 1998<br />
United States $÷«742 $÷«828 $÷«740<br />
International (a) 309 265 191<br />
Foreign exchange (loss) gain – (3) 6<br />
Unallocated and corporate expenses (163) (180) (169)<br />
Facility actions net gain (b) 176 381 275<br />
Unusual items (b) (204) (51) (15)<br />
Total Operating Profit 860 1,240 1,028<br />
Interest expense, net 176 202 272<br />
Income before income taxes $÷«684 $1,038 $÷«756<br />
Depreciation and Amortization <strong>2000</strong> 1999 1998<br />
United States $÷«231 $÷«266 $÷«300<br />
International 110 110 104<br />
Corporate 13 10 13<br />
$÷«354 $÷«386 $÷«417<br />
Capital Spending <strong>2000</strong> 1999 1998<br />
United States $÷«370 $÷«315 $÷« 305<br />
International 192 139 150<br />
Corporate 10 16 5<br />
$÷«572 $÷«470 $÷«460<br />
Identifiable Assets <strong>2000</strong> 1999<br />
United States $2,400 $2,444<br />
International (c) 1,501 1,367<br />
Corporate (d) 248 150<br />
$4,149 $3,961<br />
Long-Lived Assets (e) <strong>2000</strong> 1999<br />
United States $2,101 $2,143<br />
International 828 874<br />
Corporate 30 41<br />
$2,959 $3,058<br />
(a) Includes equity income of unconsolidated affiliates of $25 million, $22 million<br />
and $18 million in <strong>2000</strong>, 1999 and 1998, respectively.<br />
(b) See Note 5 for a discussion by reportable operating segment of facility actions<br />
net gain and unusual items.<br />
(c) Includes investment in unconsolidated affiliates of $257 million and<br />
$170 million for <strong>2000</strong> and 1999, respectively.<br />
(d) Primarily includes accounts receivable arising from the AmeriServe<br />
bankruptcy reorganization process as further discussed in Note 21, PP&E<br />
related to our office facilities and restricted cash.<br />
(e) Includes PP&E, net and Intangible Assets, net.<br />
See Note 5 for additional operating segment disclosures<br />
related to impairment and the carrying amount of assets held<br />
for disposal.<br />
Note 21 Commitments and Contingencies<br />
Impact of AmeriServe Bankruptcy Reorganization Process<br />
Overview<br />
We and our franchisees and licensees are dependent on frequent<br />
replenishment of food ingredients and paper supplies<br />
required by our restaurants. We and a large number of our<br />
franchisees and licensees operated under multi-year contracts,<br />
which have now been assumed by McLane Company, Inc.<br />
(“McLane”), which required the use of AmeriServe to purchase<br />
and make deliveries of most of these supplies. AmeriServe<br />
filed for protection under Chapter 11 of the U.S. Bankruptcy<br />
Code on January 31, <strong>2000</strong>. A plan of reorganization for<br />
AmeriServe (the “POR”) was approved by the U.S. Bankruptcy<br />
Court on November 28, <strong>2000</strong>.<br />
During the AmeriServe bankruptcy reorganization process,<br />
we took a number of actions to ensure continued supply to<br />
our system. These actions, which are described below, have<br />
resulted in a total net expense of $170 million in <strong>2000</strong>, which<br />
has been recorded as unusual items. Based upon the actions<br />
contemplated by the POR which have been completed to<br />
date and other currently available information, we believe
the ultimate cost of the AmeriServe bankruptcy reorganization<br />
process will not materially exceed the amounts already<br />
provided. A summary of the expense is as follows:<br />
DIP Facility $÷«70<br />
Gross Settlement Amount 246<br />
Less: Dismissed Payables (101)<br />
Residual Assets (86)<br />
Net Settlement Amount 59<br />
TDPP and Other 41<br />
Bankruptcy Causes of Action –<br />
Each of the amounts in this table is more fully<br />
described below.<br />
$«170<br />
DIP Facility<br />
On February 2, <strong>2000</strong>, AmeriServe was provided with a<br />
$150 million interim debtor-in-possession (“DIP”) revolving<br />
credit facility (the “DIP Facility”). Through a series of transactions,<br />
our effective net commitment under the DIP Facility<br />
was $70 million. At November 30, <strong>2000</strong>, the total DIP commitment<br />
had essentially been funded.<br />
Replacement Lien<br />
During the bankruptcy reorganization process, we consented<br />
to a cash collateral order by the U.S. Bankruptcy Court<br />
under which the pre-petition secured lenders of AmeriServe<br />
agreed to allow certain AmeriServe pre-petition collateral<br />
(principally inventory and receivables) to be used in the normal<br />
course of business. In exchange, we agreed to grant a lien<br />
(“Replacement Lien”) to these lenders on inventory that we<br />
purchased and the receivables resulting from the sale of this<br />
inventory under the Temporary Direct Purchase Program<br />
described below.<br />
AmeriServe POR<br />
The POR provided for the sale of the AmeriServe U.S. distribution<br />
business to McLane effective on November 30, <strong>2000</strong>.<br />
In connection with this sale, we have agreed to (a) an extension<br />
of the sales and distribution agreement for U.S. Companyowned<br />
stores (the “Distribution Agreement”) through<br />
October 31, 2010; (b) a five-percent increase in distribution<br />
fees under the Distribution Agreement; and (c) a reduction<br />
in our payment terms for supplies from 30 to 15 days.<br />
Beginning on November 30, <strong>2000</strong> (the closing date of the<br />
sale), McLane assumed all supply and distribution responsibilities<br />
under our Distribution Agreement, as well as under<br />
the distribution agreements of most of our franchisees and<br />
licensees previously serviced by AmeriServe.<br />
Under the terms of the POR, TRICON provided approximately<br />
$246 million to AmeriServe (the “Gross Settlement<br />
Amount”) to facilitate a global settlement with holders of<br />
allowed secured and administrative priority claims in the<br />
bankruptcy. In exchange, TRICON will receive the proceeds<br />
from the liquidation of AmeriServe’s remaining inventory,<br />
accounts receivable and certain other assets (the “Residual<br />
Assets”). We have currently estimated these proceeds to be<br />
approximately $86 million and have recorded a receivable<br />
from the AmeriServe bankruptcy estate in this amount. We<br />
expect that these proceeds will be primarily realized over<br />
the next twelve months. Through March 9, 2001, we have<br />
collected approximately $29 million.<br />
The POR also released us from any further obligations or<br />
claims under the Replacement Lien and provided for the dismissal<br />
of the legal action filed by AmeriServe against TRICON<br />
seeking payment of the $101 million in pre-petition trade<br />
accounts payable to AmeriServe (the “Dismissed Payables”).<br />
As previously disclosed, we had accrued for, but withheld<br />
payment of the Dismissed Payables.<br />
In addition, the POR grants TRICON a priority right to<br />
proceeds (up to a maximum of $220 million) from certain<br />
litigation claims and causes of action held by the AmeriServe<br />
bankruptcy estate, including certain avoidance and preference<br />
actions (collectively, the “Bankruptcy Causes of Action”).<br />
We expect that any such proceeds, the potential amounts of<br />
which are not yet reasonably estimable, will be primarily<br />
realized over the next twelve to twenty-four months. These<br />
recoveries, if any, will be recorded as unusual items as they<br />
are realized.<br />
Temporary Direct Purchase Program<br />
During the bankruptcy reorganization process, to help ensure<br />
that our supply chain remained open, we purchased supplies<br />
directly from suppliers for use in our restaurants, as well as<br />
for resale to our franchisees and licensees who previously purchased<br />
supplies from AmeriServe (the “Temporary Direct<br />
Purchase Program” or “TDPP”). AmeriServe agreed, for the<br />
same fee in effect prior to the bankruptcy filing, to continue to<br />
be responsible for distributing supplies to us and our participating<br />
franchisee and licensee restaurants. Operations under<br />
the TDPP ceased on November 30, <strong>2000</strong>, the date on which<br />
McLane purchased AmeriServe’s U.S. distribution business.<br />
In connection with the TDPP, we incurred approximately<br />
$41 million of costs, principally related to allowances for<br />
estimated uncollectible receivables from our franchisees and<br />
licensees and the incremental interest cost arising from the<br />
additional debt required to finance the inventory purchases<br />
and the receivables arising from supply sales to our franchisees<br />
and licensees. These costs also included inventory obsolescence<br />
and certain general and administrative expenses. Under<br />
SFAS No. 45, “Accounting for Franchise Fee Revenue,” the<br />
results of these agency distribution activities are reported on a<br />
net basis in the Consolidated Statement of Income.<br />
At December 30, <strong>2000</strong>, our remaining receivables from<br />
franchisees and licensees for sales of supplies under the TDPP<br />
were approximately $52 million, net of related allowances for<br />
doubtful accounts. The Company intends to vigorously pursue<br />
collection of these receivables. Through March 9, 2001,<br />
TRICON GLOBAL RESTAURANTS, INC. AND SUBSIDIARIES 61
we have collected approximately $43 million. On November<br />
30, <strong>2000</strong>, we sold our remaining inventories to McLane at an<br />
amount approximating book value. We have no remaining<br />
payables to suppliers under the TDPP.<br />
Other<br />
We have incurred and will continue to incur other incremental<br />
costs (principally professional fees) as a result of the AmeriServe<br />
bankruptcy reorganization process which are being charged as<br />
incurred to unusual items. We expect that these costs, though<br />
substantially reduced from pre-POR levels, will continue until<br />
the affairs of the estate can be substantially concluded; however,<br />
we do not expect that these costs, net of any recoveries from<br />
the Bankruptcy Causes of Action, will be material to our<br />
annual results of operations, financial condition or cash flows.<br />
Other Commitments and Contingencies<br />
Contingent Liabilities<br />
We were directly or indirectly contingently liable in the<br />
amounts of $401 million and $386 million at year-end <strong>2000</strong><br />
and 1999, respectively, for certain lease assignments and<br />
guarantees. At December 30, <strong>2000</strong>, $333 million represented<br />
contingent liabilities to lessors as a result of assigning our<br />
interest in and obligations under real estate leases as a condition<br />
to the refranchising of Company restaurants and the<br />
contribution of certain Company restaurants to a new venture<br />
in Canada. The $333 million represented the present value of<br />
the minimum payments of the assigned leases, excluding any<br />
renewal option periods, discounted at our pre-tax cost of debt.<br />
On a nominal basis, the contingent liability resulting from<br />
the assigned leases was $513 million. The remaining amounts<br />
of the contingent liabilities primarily relates to our guarantees<br />
to support financial arrangements of certain unconsolidated<br />
affiliates and franchisees. The contingent liabilities related to<br />
financial arrangements of franchisees include partial guarantees<br />
of franchisee loan pools originated primarily in connection<br />
with the Company’s refranchising programs. In support of<br />
these guarantees, we have posted $22 million of letters of<br />
credit and $10 million in cash collateral. The cash collateral<br />
balances are included in Other Assets. Also, TRICON provides<br />
a standby letter of credit under which TRICON could<br />
potentially be required to fund a portion (up to $25 million)<br />
of one of the franchisee loan pools discussed above. Any such<br />
funding under the standby letter of credit would then be<br />
fully secured by franchisee loan collateral. We have provided<br />
for our estimated probable exposures under these contingent<br />
liabilities largely through charges to refranchising gains (losses).<br />
Casualty Loss Programs and Estimates<br />
We are currently self-insured for a portion of our current and<br />
prior years’ casualty losses, property losses and certain other<br />
insurable risks. To mitigate the cost of our exposures for certain<br />
casualty losses, we make annual decisions to either retain<br />
the risks of loss up to certain maximum per occurrence or<br />
62 TRICON GLOBAL RESTAURANTS, INC. AND SUBSIDIARIES<br />
aggregate loss limits negotiated with our insurance carriers or<br />
to fully insure those risks. Since the Spin-off, we have elected<br />
to retain the risks subject to insured limitations. In addition,<br />
we also purchased insurance in 1998 to limit the cost for<br />
certain of our retained risks for the years 1994 to 1996.<br />
Effective August 16, 1999, we made changes to our U.S.<br />
and portions of our International property and casualty loss<br />
programs. For fiscal year <strong>2000</strong> and the period from August 16,<br />
1999 through fiscal year end, 1999, we bundled our risks for<br />
casualty losses, property losses and various other insurable<br />
risks into one risk pool with a single maximum loss limit.<br />
Certain losses in excess of the single maximum loss limit<br />
are covered under reinsurance agreements. Since all of these<br />
risks have been pooled and there are no per occurrence limits<br />
for individual claims, it is possible that we may experience<br />
increased volatility in property and casualty losses on a quarter<br />
to quarter basis. This would occur if an individual large loss<br />
is incurred either early in a program year or when the latest<br />
actuarial projection of losses for a program year is significantly<br />
below our aggregate loss retention. A large loss is defined as<br />
a loss in excess of $2 million which was our predominant<br />
per occurrence casualty loss limit under our previous insurance<br />
program.<br />
We have accounted for our retained liabilities for casualty<br />
losses, including reported and incurred but not reported<br />
claims, based on information provided by our independent<br />
actuary. Effective August 16, 1999, property losses are also<br />
included in our actuary’s valuation. Prior to that date, property<br />
losses were based on our internal estimates.<br />
Actuarial valuations are performed and resulting adjustments<br />
to current and prior years’ self-insured casualty losses,<br />
property losses and other insurable risks, are made in the second<br />
and fourth quarters of each fiscal year. The adjustments<br />
recorded to our casualty loss reserves in <strong>2000</strong> were insignificant.<br />
We recorded favorable adjustments of $30 million in 1999<br />
and $23 million in 1998. The 1999 and 1998 adjustments<br />
resulted primarily from improved loss trends related to 1998<br />
casualty losses at all three of our U.S. Concepts. In addition,<br />
the favorable insurance adjustments in 1998 included the<br />
benefit of the insurance transaction to limit the cost for<br />
certain of our retained risk for the years 1994 to 1996.<br />
We will continue to make adjustments both based on our<br />
actuary’s periodic valuations as well<br />
as whenever there are significant<br />
changes in the expected costs of<br />
settling large claims that have<br />
occurred since the last actuarial<br />
valuation was performed.
Due to the inherent volatility of our actuarially determined<br />
casualty loss estimates, it is reasonably possible that we could<br />
experience changes in estimated losses which could be material<br />
to our growth in net income in 2001. We believe that,<br />
since we record our reserves for casualty losses at a 75% confidence<br />
level, we have mitigated the potential negative impact<br />
of adverse development and/or volatility.<br />
Change of Control Severance Agreements<br />
In September <strong>2000</strong>, the Compensation Committee of the<br />
Board of Directors approved renewing severance agreements<br />
with certain key executives (the “Agreements”) that were set<br />
to expire on December 31, <strong>2000</strong>. These Agreements are triggered<br />
by a termination, under certain conditions, of the<br />
executive’s employment following a change in control of the<br />
Company, as defined in the Agreements. If triggered, the<br />
affected executives would generally receive twice the amount<br />
of both their annual base salary and their annual incentive in<br />
a lump sum, outplacement services and a tax gross-up for any<br />
excise taxes. These Agreements have a three-year term and<br />
automatically renew each January 1 for another three-year<br />
term unless the Company elects not to renew the Agreements.<br />
Since the timing of any payments under these Agreements<br />
cannot be anticipated, the amounts are not estimable. However,<br />
these payments, if made, could be substantial. In the event<br />
of a change of control, rabbi trusts would be established and<br />
used to provide payouts under existing deferred and incentive<br />
compensation plans.<br />
Wage and Hour Litigation<br />
We are subject to various claims and contingencies related<br />
to lawsuits, taxes, environmental and other matters arising<br />
out of the normal course of business. Like certain other large<br />
retail employers, Pizza Hut and Taco Bell have been faced in<br />
certain states with allegations of purported class-wide wage<br />
and hour violations.<br />
On May 11, 1998, a purported class action lawsuit against<br />
Pizza Hut, Inc., and one of its franchisees, PacPizza, LLC,<br />
entitled Aguardo, et al. v. Pizza Hut, Inc., et al. (“Aguardo”),<br />
was filed in the Superior Court of the State of California of<br />
the County of San Francisco. The lawsuit was filed by three<br />
former Pizza Hut restaurant general managers purporting to<br />
represent approximately 1,300 current and former California<br />
restaurant general managers of Pizza Hut and PacPizza, LLC.<br />
The lawsuit alleges violations of state wage and hour laws<br />
involving unpaid overtime wages and vacation pay and seeks<br />
an unspecified amount in damages. On January 12, <strong>2000</strong>, the<br />
Court certified a class of approximately 1,300 current and<br />
former restaurant general managers. The Court amended the<br />
class on June 1, <strong>2000</strong> to include approximately 150 additional<br />
current and former restaurant general managers. This lawsuit<br />
is in the early discovery phase, and no trial date has been set.<br />
On August 29, 1997, a class action lawsuit against Taco<br />
Bell Corp., entitled Bravo, et al. v. Taco Bell Corp. (“Bravo”),<br />
was filed in the Circuit Court of the State of Oregon of the<br />
County of Multnomah. The lawsuit was filed by two former<br />
Taco Bell shift managers purporting to represent approximately<br />
17,000 current and former hourly employees statewide. The<br />
lawsuit alleges violations of state wage and hour laws, principally<br />
involving unpaid wages including overtime, and rest<br />
and meal period violations, and seeks an unspecified amount<br />
in damages. Under Oregon class action procedures, Taco Bell<br />
was allowed an opportunity to “cure” the unpaid wage and<br />
hour allegations by opening a claims process to all putative<br />
class members prior to certification of the class. In this cure<br />
process, Taco Bell has currently paid out less than $1 million.<br />
On January 26, 1999, the Court certified a class of all current<br />
and former shift managers and crew members who claim one<br />
or more of the alleged violations. A trial date of November 2,<br />
1999 was set. However, on November 1, 1999, the Court<br />
issued a proposed order postponing the trial and establishing<br />
a pre-trial claims process. The final order regarding the claims<br />
process was entered on January 14, <strong>2000</strong>. Taco Bell moved<br />
for certification of an immediate appeal of the Court-ordered<br />
claims process and requested a stay of the proceedings. This<br />
motion was denied on February 8, <strong>2000</strong>. Taco Bell appealed<br />
this decision to the Supreme Court of Oregon and the Court<br />
denied Taco Bell’s Writ of Mandamus on March 21, <strong>2000</strong>.<br />
A Court-approved notice and claim form was mailed to<br />
approximately 14,500 class members on January 31, <strong>2000</strong>.<br />
A Court ordered pre-trial claims process went forward, and<br />
hearings were held for claimants employed or previously<br />
employed in selected Taco Bell restaurants. After the initial<br />
hearings, the damage claims hearings were discontinued. Trial<br />
began on January 4, 2001. On March 9, 2001, the jury reached<br />
verdicts on the substantive issues in this matter. A number of<br />
these verdicts were in favor of the Taco Bell position; however,<br />
certain issues were decided in favor of the plaintiffs. A number<br />
of procedural issues, including possible appeals, remain to<br />
determine the ultimate damages in this matter.<br />
We have provided for the estimated costs of the Aguardo<br />
and Bravo litigations, based on a projection of eligible claims<br />
(including claims filed to date, where applicable), the cost<br />
of each eligible claim, the estimated legal fees incurred by<br />
plaintiffs and the results of settlement negotiations in these<br />
and other wage and hour litigation matters. Although the<br />
outcome of these lawsuits cannot be determined at this time,<br />
we believe the ultimate cost of these cases in excess of the<br />
amounts already provided will not be material to our annual<br />
results of operations, financial condition or cash flows. Any<br />
provisions have been recorded in unusual items.<br />
On October 2, 1996, a class action lawsuit against Taco<br />
Bell Corp., entitled Mynaf, et al. v. Taco Bell Corp. (“Mynaf”),<br />
was filed in the Superior Court of the State of California<br />
of the County of Santa Clara. The lawsuit was filed by two<br />
former restaurant general managers and two former assistant<br />
TRICON GLOBAL RESTAURANTS, INC. AND SUBSIDIARIES 63
estaurant general managers purporting to represent all<br />
current and former Taco Bell restaurant general managers<br />
and assistant restaurant general managers in California.<br />
The lawsuit alleged violations of California wage and hour<br />
laws involving unpaid overtime wages, and violations of the<br />
State Labor Code’s record-keeping requirements. The complaint<br />
also included an unfair business practices claim.<br />
Plaintiffs claimed individual damages ranging from $10,000<br />
to $100,000 each. On September 17, 1998, the court certified<br />
a class of approximately 3,000 current and former<br />
assistant restaurant general managers and restaurant general<br />
managers. Taco Bell petitioned the appellate court to review<br />
the trial court’s certification order. The petition was denied<br />
on December 31, 1998. Taco Bell then filed a petition for<br />
review with the California Supreme Court, and the petition<br />
was subsequently denied. Class notices were mailed on August<br />
31, 1999 to over 3,400 class members. Trial began on<br />
January 29, 2001. Before conclusion of the trial, the parties<br />
reached an agreement to settle this matter, and entered into<br />
a stipulation of discontinuance of the case. This settlement<br />
agreement is subject to approval by the court of the terms<br />
and conditions of the agreement and notice to the class with<br />
an opportunity to object and be heard. We have provided<br />
for the costs of this settlement in unusual items.<br />
Other Litigation<br />
C&F Packing Co., Inc. v. Pizza Hut, Inc. This action was<br />
originally filed in 1993 by C&F Packing Co., Inc., a Chicago<br />
meat packing company (“C&F”), in the United States District<br />
court for the Northern District of Illinois. This lawsuit alleges<br />
that Pizza Hut misappropriated various trade secrets relating to<br />
C&F’s alleged process for manufacturing a precooked Italian<br />
sausage pizza topping. C&F’s trade secret claims against Pizza<br />
Hut were originally dismissed by the trial court on statute of<br />
limitations grounds. That ruling was later overturned by the<br />
U.S. Court of Appeals for the Federal Circuit in August <strong>2000</strong><br />
and the case was remanded to the trial court for further proceedings.<br />
On remand, Pizza Hut moved for summary judgment<br />
on its statute of limitations defense. That motion was denied<br />
in January 2001. This lawsuit is in the discovery phase and<br />
no trial date has been set. Similar trade secret claims against<br />
another defendant were tried by a jury in late 1998 and the<br />
jury returned a verdict for C&F. Judgment on that verdict<br />
was affirmed by the U.S. Court of Appeals for the Federal<br />
Circuit in August <strong>2000</strong>.<br />
TRICON believes that C&F’s claims are without merit<br />
and is vigorously defending the case. However, in view of the<br />
inherent uncertainties of litigation, the outcome of this case<br />
cannot be predicted at this time. Likewise, the amount of any<br />
potential loss cannot be reasonably estimated.<br />
Obligations to PepsiCo After Spin-off<br />
In connection with the October 6, 1997 Spin-off from<br />
PepsiCo, we entered into separation and other related agree-<br />
64 TRICON GLOBAL RESTAURANTS, INC. AND SUBSIDIARIES<br />
ments (the “Separation Agreements”), governing the Spin-off<br />
transaction and our subsequent relationship with PepsiCo.<br />
These agreements provide certain indemnities to PepsiCo.<br />
The Separation Agreements provided for, among other<br />
things, our assumption of all liabilities relating to the restaurant<br />
businesses, including the Non-core Businesses, and our<br />
indemnification of PepsiCo with respect to these liabilities.<br />
We have included our best estimates of these liabilities in<br />
the accompanying Consolidated Financial Statements.<br />
Subsequent to Spin-off, claims were made by certain Noncore<br />
Business franchisees and a purchaser of one of the<br />
businesses. To date, we have resolved these disputes within<br />
amounts previously recorded.<br />
In addition, we have indemnified PepsiCo for any costs or<br />
losses it incurs with respect to all letters of credit, guarantees<br />
and contingent liabilities relating to our businesses under<br />
which PepsiCo remains liable. As of December 30, <strong>2000</strong>,<br />
PepsiCo remains liable for approximately $139 million<br />
related to these contingencies. This obligation ends at the<br />
time PepsiCo is released, terminated or replaced by a qualified<br />
letter of credit. We have not been required to make any<br />
payments under this indemnity.<br />
Under the Separation Agreements, PepsiCo maintains full<br />
control and absolute discretion with regard to any combined<br />
or consolidated tax filings for periods through October 6,<br />
1997. PepsiCo also maintains full control and absolute discretion<br />
regarding any common tax audit issues. Although<br />
PepsiCo has contractually agreed to, in good faith, use its<br />
best efforts to settle all joint interests in any common audit<br />
issue on a basis consistent with prior practice, there can be<br />
no assurance that determinations made by PepsiCo would<br />
be the same as we would reach, acting on our own behalf.<br />
Through December 30, <strong>2000</strong>, there have not been any determinations<br />
made by PepsiCo where we would have reached<br />
a different determination.<br />
We also agreed to certain restrictions on our actions to<br />
help ensure that the Spin-off maintained its tax-free status.<br />
These restrictions, which were generally applicable to the twoyear<br />
period following the Spin-off Date, included among<br />
other things, limitations on any liquidation, merger or consolidation<br />
with another company, certain issuances and<br />
redemptions of our Common Stock, our granting of stock<br />
options and our sale, refranchising, distribution or other disposition<br />
of assets. If we failed to abide by these restrictions or<br />
to obtain waivers from PepsiCo and, as a result, the Spin-off<br />
fails to qualify as a tax-free reorganization, we will be obligated<br />
to indemnify PepsiCo for any resulting tax liability,<br />
which could be substantial. No payments under these indemnities<br />
have been required or are expected to be required.<br />
Additionally, PepsiCo is entitled to the federal income tax<br />
benefits related to the exercise after the Spin-off of vested<br />
PepsiCo options held by our employees. We expense the payroll<br />
taxes related to the exercise of these options as incurred.
Note 22 Selected Quarterly Financial Data (Unaudited)<br />
<strong>2000</strong> First Quarter Second Quarter Third Quarter Fourth Quarter Total<br />
Revenues:<br />
Company sales $1,425 $1,480 $1,470 $1,930 $6,305<br />
Franchise and license fees 172 176 188 252 788<br />
Total revenues 1,597 1,656 1,658 2,182 7,093<br />
Total costs and expenses, net 1,355 1,436 1,526 1,916 6,233<br />
Operating profit 242 220 132 266 860<br />
Net income 120 106 59 128 413<br />
Diluted earnings per common share<br />
Operating profit attributable to:<br />
0.80 0.71 0.40 0.86 2.77<br />
Facility actions net gain 47 66 3 60 176<br />
Unusual items<br />
Net income attributable to:<br />
(4) (72) (92) (36) (204)<br />
Facility actions net gain 26 39 3 30 98<br />
Unusual items (2) (47) (57) (23) (129)<br />
1999 First Quarter Second Quarter Third Quarter Fourth Quarter Total<br />
Revenues:<br />
Company sales $1,662 $1,723 $1,639 $2,075 $7,099<br />
Franchise and license fees 151 163 173 236 723<br />
Total revenues 1,813 1,886 1,812 2,311 7,822<br />
Total costs and expenses, net 1,577 1,537 1,435 2,033 6,582<br />
Operating profit 236 349 377 278 1,240<br />
Net income 106 179 197 145 627<br />
Diluted earnings per common share<br />
Operating profit attributable to:<br />
0.66 1.10 1.23 0.93 3.92<br />
Accounting changes 10 6 5 8 29<br />
Facility actions net gain 34 133 144 70 381<br />
Unusual items<br />
Net income attributable to:<br />
– (4) (3) (44) (51)<br />
Accounting changes 6 4 3 5 18<br />
Facility actions net gain 19 80 84 43 226<br />
Unusual items – (2) (3) (24) (29)<br />
See Note 5 for details of facility actions net gain, unusual items and the 1999 accounting changes.<br />
TRICON GLOBAL RESTAURANTS, INC. AND SUBSIDIARIES 65
Management’s Responsibility for<br />
Financial Statements<br />
To Our Shareholders:<br />
We are responsible for the preparation, integrity and fair presentation<br />
of the Consolidated Financial Statements, related notes and<br />
other information included in this annual report. The financial<br />
statements were prepared in accordance with accounting principles<br />
generally accepted in the United States of America and include certain<br />
amounts based upon our estimates and assumptions, as<br />
required. Other financial information presented in the annual<br />
report is derived from the financial statements.<br />
We maintain a system of internal control over financial reporting,<br />
designed to provide reasonable assurance as to the reliability<br />
of the financial statements, as well as to safeguard assets from<br />
unauthorized use or disposition. The system is supported by formal<br />
policies and procedures, including an active Code of Conduct<br />
program intended to ensure employees adhere to the highest standards<br />
of personal and professional integrity. Our internal audit<br />
function monitors and reports on the adequacy of and compliance<br />
with the internal control system, and appropriate actions are taken<br />
to address significant control deficiencies and other opportunities<br />
for improving the system as they are identified.<br />
The Consolidated Financial Statements have been audited and<br />
reported on by our independent auditors, KPMG LLP, who were<br />
given free access to all financial records and related data, including<br />
minutes of the meetings of the Board of Directors and Committees<br />
of the Board. We believe that management representations made to<br />
the independent auditors were valid and appropriate.<br />
The Audit Committee of the Board of Directors, which is composed<br />
solely of outside directors, provides oversight to our financial<br />
reporting process and our controls to safeguard assets through periodic<br />
meetings with our independent auditors, internal auditors and<br />
management. Both our independent auditors and internal auditors<br />
have free access to the Audit Committee.<br />
Although no cost-effective internal control system will preclude<br />
all errors and irregularities, we believe our controls as of December<br />
30, <strong>2000</strong> provide reasonable assurance that our assets are reasonably<br />
safeguarded.<br />
David J. Deno<br />
Chief Financial Officer<br />
66 TRICON GLOBAL RESTAURANTS, INC. AND SUBSIDIARIES<br />
<strong>Report</strong> of Independent Auditors<br />
The Board of Directors<br />
TRICON Global Restaurants, Inc.:<br />
We have audited the accompanying consolidated balance sheets of<br />
TRICON Global Restaurants, Inc. and Subsidiaries ("TRICON") as<br />
of December 30, <strong>2000</strong> and December 25, 1999, and the related consolidated<br />
statements of income, cash flows and shareholders’ deficit<br />
and comprehensive income for each of the years in the three-year<br />
period ended December 30, <strong>2000</strong>. These consolidated financial<br />
statements are the responsibility of TRICON’s management. Our<br />
responsibility is to express an opinion on these consolidated financial<br />
statements based on our audits.<br />
We conducted our audits in accordance with auditing standards<br />
generally accepted in the United States of America. Those standards<br />
require that we plan and perform the audit to obtain reasonable<br />
assurance about whether the financial statements are free of material<br />
misstatement. An audit includes examining, on a test basis, evidence<br />
supporting the amounts and disclosures in the financial statements.<br />
An audit also includes assessing the accounting principles used and<br />
significant estimates made by management, as well as evaluating the<br />
overall financial statement presentation. We believe that our audits<br />
provide a reasonable basis for our opinion.<br />
In our opinion, the consolidated financial statements referred to<br />
above present fairly, in all material respects, the financial position of<br />
TRICON as of December 30, <strong>2000</strong> and December 25, 1999, and<br />
the results of its operations and its cash flows for each of the years<br />
in the three-year period ended December 30, <strong>2000</strong>, in conformity<br />
with accounting principles generally accepted in the United States<br />
of America.<br />
KPMG LLP<br />
Louisville, Kentucky<br />
February 13, 2001, except as to Note 18<br />
which is as of February 14, 2001<br />
and Note 21 which is as of March 9, 2001
Selected Financial Data<br />
Fiscal Year Ended<br />
(in millions, except per share and unit amounts) <strong>2000</strong> 1999 1998 1997 1996<br />
Summary of Operations<br />
System sales (a)<br />
U.S. $14,514 $14,516 $14,013 $13,502 $13,388<br />
International 7,645 7,246 6,607 6,963 6,892<br />
Total 22,159 21,762 20,620 20,465 20,280<br />
Revenues<br />
Company sales (b) 6,305 7,099 7,852 9,112 9,738<br />
Franchise and license fees 788 723 627 578 494<br />
Total 7,093 7,822 8,479 9,690 10,232<br />
Facility actions net gain (loss) (c) 176 381 275 (247) 37<br />
Unusual items (d) (204) (51) (15) (184) (246)<br />
Operating profit 860 1,240 1,028 241 372<br />
Interest expense, net 176 202 272 276 300<br />
)<br />
Income (loss) before income taxes 684 1,038 756 (35) 72<br />
Net income (loss) 413 627 445 (111) (53)<br />
Basic earnings per common share (e) 2.81 4.09 2 .92 N/A N/A<br />
Diluted earnings per common share (e) 2.77 3.92 2.84 N/A N/A<br />
Cash Flow Data<br />
Provided by operating activities $÷÷«491 $«««««565 $«««««674 $«««««810 $«««««713<br />
Capital spending 572 470 460 541 620<br />
Proceeds from refranchising of restaurants 381 916 784 770 355<br />
)<br />
Balance Sheet<br />
Total assets $÷4,149 $««3,961 $««4,531 $««5,114 $««6,520<br />
Operating working capital deficit (634) (832) (960) (1,073) (915)<br />
Long-term debt 2,397 2,391 3,436 4,551 231<br />
Total debt 2,487 2,508 3,532 4,675 290<br />
Investments by and advances from PepsiCo – – – – 4,266<br />
Other Data<br />
Number of stores at year end (a)<br />
Company 6,123 6,981 8,397 10,117 11,876<br />
Unconsolidated Affiliates 1,844 1,178 1,120 1,090 1,007<br />
Franchisees 19,287 18,414 16,650 15,097 13,066<br />
Licensees 3,163 3,409 3,596 3,408 3,147<br />
System 30,417 29,982 29,763 29,712 29,096<br />
U.S. Company same store sales growth (a)<br />
KFC (3) % 2% 3% 2 % 6 %<br />
Pizza Hut 1% 9% 6% (1) % (4) %<br />
Taco Bell (5) % – 3% 2 % (2) %<br />
Blended (2) % 4% 4% 1 % N/A<br />
Shares outstanding at year end (in millions) 147 151 153 152 N/A<br />
Market price per share at year end $««33.00 $««37.94 $««47.63 $««28.31 N/A<br />
N/A – Not Applicable.<br />
TRICON Global Restaurants, Inc. and Subsidiaries (“TRICON”) became an independent, publicly owned company on October 6, 1997 through the spin-off of the<br />
restaurant operations of its former parent, PepsiCo, Inc. (“PepsiCo”), to its shareholders. The historical consolidated financial data for 1997 and 1996 was prepared as if<br />
we had been an independent, publicly owned company for those periods. To facilitate this presentation, PepsiCo made certain allocations of its previously unallocated interest<br />
and general and administrative expenses as well as pro forma computations, to the extent possible, of separate income tax provisions for its restaurant segment. Fiscal<br />
year <strong>2000</strong> includes 53 weeks. Fiscal years 1996 to 1999 include 52 weeks. The selected financial data should be read in conjunction with the Consolidated Financial<br />
Statements and the Notes thereto.<br />
(a) Excludes Non-core Businesses.<br />
(b) Declining company sales are largely the result of our refranchising initiatives.<br />
(c) 1999 and 1998 include $13 million ($10 million after-tax) and $54 million ($33 million after-tax), respectively, of favorable adjustments to our 1997 fourth<br />
quarter charge which was $410 million ($300 million after-tax).<br />
(d) See Note 5 to the Consolidated Financial Statements for a description of unusual items in <strong>2000</strong>, 1999 and 1998. 1997 includes $120 million ($125 million<br />
after-tax) related to our 1997 fourth quarter charge and an additional $54 million ($34 million after-tax) related to the 1997 disposal of the Non-core Businesses.<br />
1996 includes a $246 million ($189 million after-tax) writedown of our Non-core Businesses. 1999 and 1998 included favorable adjustments to our 1997 fourth<br />
quarter charge of $11 million ($10 million after-tax) and $11 million ($7 million after-tax), respectively.<br />
(e) EPS data has been omitted for 1997 and 1996 as our capital structure as an independent, publicly owned company did not exist.<br />
TRICON GLOBAL RESTAURANTS, INC. AND SUBSIDIARIES 67
Shareholder Information<br />
<strong>Annual</strong> Meeting The <strong>Annual</strong> Meeting of Shareholders will be at<br />
Tricon’s headquarters, Louisville, KY at 9:00 a.m. (EDT), Thursday,<br />
May 17, 2001. Proxies for the meeting will be solicited by an<br />
independent proxy solicitor. This <strong>Annual</strong> <strong>Report</strong> is not part of the<br />
proxy solicitation.<br />
Inquiries Regarding Your Stock Holdings<br />
Registered Shareholders (shares held by you in your name) should<br />
address communications concerning statements, dividend payments,<br />
address changes, lost certificates and other administrative matters to:<br />
Tricon Global Restaurants, Inc.<br />
c/o EquiServe, L.P.<br />
P.O. Box 43016<br />
Providence, RI 02940-3016<br />
Telephone: (888) 439-4986<br />
www.equiserve.com<br />
or<br />
Shareholder Analyst<br />
Tricon Global Restaurants, Inc.<br />
1441 Gardiner Lane, Louisville, KY 40213<br />
Telephone: (888) 2yumyum<br />
email: tricon.investor@tricon-yum.com<br />
Internet: www.triconglobal.com<br />
In all correspondence or telephone inquires, please mention Tricon,<br />
your name as printed on your statement or stock certificate, your<br />
social security number, your address and telephone number.<br />
Beneflcial Shareholders (shares held in the name of your bank or<br />
broker) should direct communications on all administrative matters<br />
to your stockbroker.<br />
Tricon YUMBUCKS and SharePower Participants (employees with<br />
YUMBUCKS options or SharePower options) should address all<br />
questions regarding your account, outstanding options or shares<br />
received through option exercises to:<br />
Merrill Lynch/SharePower<br />
Stock Option Plan Services<br />
P.O. Box 30446<br />
New Brunswick, NJ 08989-0446<br />
Telephone: (800) 637-2432 (U.S., Puerto Rico and Canada)<br />
(732) 560-9444 (all other locations)<br />
In all correspondence, please provide your account number<br />
(for U.S. citizens, this is your social security number), your address,<br />
your telephone number and mention either Tricon YUMBUCKS<br />
or SharePower. For telephone inquiries, please have a copy of your<br />
most recent statement available.<br />
Employee Benefit Plan Participants<br />
Direct Stock Purchase Program (888) 439-4986<br />
Tricon 401(k) Plan (888) 875-4015<br />
Tricon Savings Center (617) 847-1013<br />
P.O. Box 1389 (outside U.S.)<br />
Boston, MA 02104-1389<br />
Please have a copy of your most recent statement available when<br />
calling. Press *0 for a customer service representative and give the<br />
representative the name of the Plan.<br />
68 TRICON GLOBAL RESTAURANTS, INC. AND SUBSIDIARIES<br />
Shareholder Services<br />
Direct Stock Purchase Plan A brochure explaining this convenient<br />
plan is available from our transfer agent:<br />
EquiServe, L.P.<br />
P.O. Box 43016<br />
Providence, RI 02940-3016<br />
(888) 439-4986<br />
www.equiserve.com<br />
Low-Cost Investment Plan Investors may purchase their initial share of<br />
stock through NAIC’s Low-Cost Investment Plan. For details contact:<br />
National Association of Investors Corporation (NAIC)<br />
711 West Thirteen Mile Road<br />
Madison Heights, Ml 48071<br />
(877) ASK-NAIC (275-6242)<br />
www.better-investing.org<br />
Financial and Other Information Earnings and other financial results,<br />
corporate news and company information are now available on<br />
Tricon’s Web site: www.triconglobal.com<br />
Copies of Tricon’s SEC Form 8-K, 10-K and 10-Q reports and<br />
quarterly earnings releases are available free of charge. Contact<br />
Tricon’s Shareholder Relations at (888) 2YUMYUM or email<br />
tricon.investor@tricon-yum.com<br />
Securities analysts, portfolio managers, representatives of financial<br />
institutions and other individuals with questions regarding Tricon’s<br />
performance are invited to contact:<br />
Tim Jerzyk<br />
Vice President, Investor Relations<br />
Tricon Global Restaurants, Inc.<br />
1441 Gardiner Lane<br />
Louisville, KY 40213<br />
Telephone: (502) 874-2543<br />
Independent Auditors<br />
KPMG LLP<br />
400 West Market Street, Suite 2600<br />
Louisville, KY 40202<br />
Telephone: (502) 587-0535<br />
Capital Stock Information<br />
Stock Trading Symbol – YUM<br />
The New York Stock Exchange is the principal market for Tricon<br />
Common Stock.<br />
Shareholders At year-end <strong>2000</strong>, there were approximately 157,000<br />
shareholders of record.<br />
Dividend Policy Tricon does not currently pay dividends, nor does it<br />
anticipate doing so in the near future.<br />
Tricon’s <strong>Annual</strong> <strong>Report</strong> contains many of the valuable trademarks owned and used by<br />
Tricon and subsidiaries and affiliates in the United States and internationally.<br />
Printed on recycled paper.
A<br />
B<br />
C<br />
D<br />
E<br />
F<br />
G<br />
H<br />
I<br />
J<br />
K<br />
L<br />
Board of Directors Executive Officers<br />
David C. Novak 48<br />
Chairman and Chief Executive<br />
Officer, Tricon<br />
Andrall E. Pearson 75<br />
Founding Chairman, Tricon<br />
D. Ronald Daniel 71<br />
Treasurer, Harvard University,<br />
Former Managing Partner,<br />
McKinsey and Company<br />
James Dimon 45<br />
Chairman and Chief Executive<br />
Officer, Bank One Corporation<br />
Massimo Ferragamo 43<br />
President and Vice Chairman,<br />
Ferragamo USA, Inc., a subsidiary<br />
of Salvatore Ferragamo Italia<br />
Robert Holland, Jr. 59<br />
Owner and Chief Executive<br />
Officer, WorkPlace Integrators,<br />
Michigan’s largest Steelcase<br />
office furniture dealer<br />
Sidney Kohl 70<br />
Former Chairman, Kohl’s<br />
Supermarkets, Founder, Kohl’s<br />
Department Stores<br />
Kenneth Langone 65<br />
Founder, Chairman of the Board<br />
and Chief Executive Officer,<br />
Invemed Associates, Inc., an<br />
investment banking firm,<br />
Founder, Home Depot, Inc.<br />
Jackie Trujillo 65<br />
Chairman of the Board, Harman<br />
Management Corporation<br />
Robert J. Ulrich 57<br />
Chairman and Chief Executive<br />
Officer, Target Corporation<br />
and Target Stores<br />
Jeanette S. Wagner 71<br />
Vice Chairman, Estee Lauder<br />
Companies, Inc.<br />
John L. Weinberg 76<br />
Director, Goldman Sachs<br />
Group, Inc.<br />
David C. Novak 48<br />
Chairman and Chief Executive<br />
Officer, Tricon<br />
Andrall E. Pearson 75<br />
Founding Chairman, Tricon<br />
Cheryl Bachelder 44<br />
President and Chief Concept<br />
Officer, KFC, U.S.A.<br />
Peter A. Bassi 51<br />
President, Tricon Restaurants<br />
International<br />
Jonathan D. Blum 42<br />
Senior Vice President, Public<br />
Affairs, Tricon<br />
Emil J. Brolick 53<br />
President and Chief Concept<br />
Officer, Taco Bell U.S.A.<br />
Christian Campbell 50<br />
Senior Vice President, General<br />
Counsel and Secretary, Tricon<br />
Mark S. Cosby 42<br />
Chief Operating Officer, KFC,<br />
U.S.A.<br />
Gregg Dedrick 41<br />
Executive Vice President, People<br />
and Shared Services, Tricon<br />
David J. Deno 43<br />
Chief Financial Officer, Tricon<br />
Peter R. Hearl 49<br />
Executive Vice President, Tricon<br />
Restaurants International<br />
Aylwin B. Lewis 46<br />
Chief Operating Officer, Tricon<br />
Michael A. Miles 39<br />
Chief Operating Officer,<br />
Pizza Hut, U.S.A.<br />
Robert T. Nilsen 41<br />
Chief Operating Officer,<br />
Taco Bell, U.S.A.<br />
Denise L. Ramos 44<br />
Senior Vice President, Treasurer,<br />
Tricon<br />
Charles E. Rawley 50<br />
Chief Development Officer,<br />
Tricon<br />
Michael S. Rawlings 46<br />
President and Chief Concept<br />
Officer, Pizza Hut, U.S.A.<br />
Brent A. Woodford 38<br />
Vice President and Controller,<br />
Tricon<br />
I F A<br />
B C L<br />
H K J<br />
G D E
SOLAS SOMOS<br />
DELICIOSAS, JUNTAS<br />
SOMOS YUM!<br />
SEULS NOUS SOMMES<br />
DÉLICIEUX, ENSEMBLE<br />
NOUS SOMMES YUM!<br />
Hungry for more information? Contact: www.triconglobal.com<br />
®<br />
TM<br />
EINZELN SIND<br />
WIR KÖSTLICH, ZUSAMMEN<br />
SIND WIR YUM!<br />
ALONE WE’RE<br />
DELICIOUS, TOGETHER<br />
WE’RE YUM!<br />
®