2000 Annual Report - Yum!
2000 Annual Report - Yum!
2000 Annual Report - Yum!

Create successful ePaper yourself
Turn your PDF publications into a flip-book with our unique Google optimized e-Paper software.
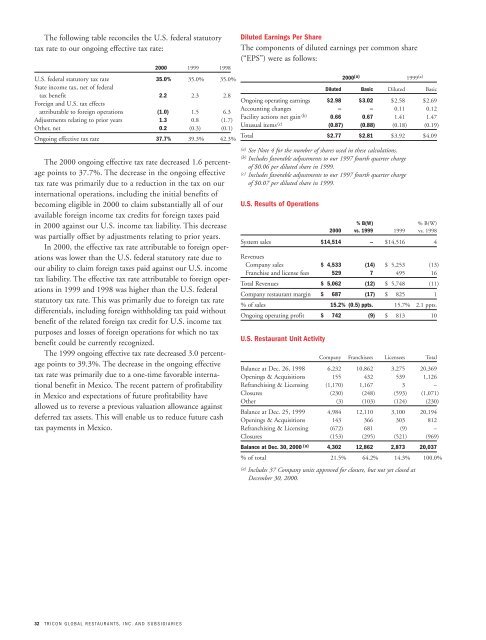
The following table reconciles the U.S. federal statutory<br />
tax rate to our ongoing effective tax rate:<br />
32 TRICON GLOBAL RESTAURANTS, INC. AND SUBSIDIARIES<br />
<strong>2000</strong> 1999 1998<br />
U.S. federal statutory tax rate 35.0% 35.0% 35.0%<br />
State income tax, net of federal<br />
tax benefit 2.2 2.3 2.8<br />
Foreign and U.S. tax effects<br />
attributable to foreign operations (1.0) 1.5 6.3<br />
Adjustments relating to prior years 1.3 0.8 (1.7)<br />
Other, net 0.2 (0.3) (0.1)<br />
Ongoing effective tax rate 37.7% 39.3% 42.3%<br />
The <strong>2000</strong> ongoing effective tax rate decreased 1.6 percentage<br />
points to 37.7%. The decrease in the ongoing effective<br />
tax rate was primarily due to a reduction in the tax on our<br />
international operations, including the initial benefits of<br />
becoming eligible in <strong>2000</strong> to claim substantially all of our<br />
available foreign income tax credits for foreign taxes paid<br />
in <strong>2000</strong> against our U.S. income tax liability. This decrease<br />
was partially offset by adjustments relating to prior years.<br />
In <strong>2000</strong>, the effective tax rate attributable to foreign operations<br />
was lower than the U.S. federal statutory rate due to<br />
our ability to claim foreign taxes paid against our U.S. income<br />
tax liability. The effective tax rate attributable to foreign operations<br />
in 1999 and 1998 was higher than the U.S. federal<br />
statutory tax rate. This was primarily due to foreign tax rate<br />
differentials, including foreign withholding tax paid without<br />
benefit of the related foreign tax credit for U.S. income tax<br />
purposes and losses of foreign operations for which no tax<br />
benefit could be currently recognized.<br />
The 1999 ongoing effective tax rate decreased 3.0 percentage<br />
points to 39.3%. The decrease in the ongoing effective<br />
tax rate was primarily due to a one-time favorable international<br />
benefit in Mexico. The recent pattern of profitability<br />
in Mexico and expectations of future profitability have<br />
allowed us to reverse a previous valuation allowance against<br />
deferred tax assets. This will enable us to reduce future cash<br />
tax payments in Mexico.<br />
Diluted Earnings Per Share<br />
The components of diluted earnings per common share<br />
(“EPS”) were as follows:<br />
<strong>2000</strong> (a) 1999 (a)<br />
Diluted Basic Diluted Basic<br />
Ongoing operating earnings $2.98 $3.02 $2.58 $2.69<br />
Accounting changes – – 0.11 0.12<br />
Facility actions net gain (b) 0.66 0.67 1.41 1.47<br />
Unusual items (c) (0.87) (0.88) (0.18) (0.19)<br />
Total $2.77 $2.81 $3.92 $4.09<br />
(a) See Note 4 for the number of shares used in these calculations.<br />
(b) Includes favorable adjustments to our 1997 fourth quarter charge<br />
of $0.06 per diluted share in 1999.<br />
(c) Includes favorable adjustments to our 1997 fourth quarter charge<br />
of $0.07 per diluted share in 1999.<br />
U.S. Results of Operations<br />
% B(W) % B(W)<br />
<strong>2000</strong> vs. 1999 1999 vs. 1998<br />
System sales $14,514 – $14,516 4<br />
Revenues<br />
Company sales $÷4,533 (14) $÷5,253 (13)<br />
Franchise and license fees 529 7 495 16<br />
Total Revenues $÷5,062 (12) $÷5,748 (11)<br />
Company restaurant margin $÷÷«687 (17) $÷÷«825 1<br />
% of sales 15.2% (0.5) «ppts. 15.7% 2.1 ppts.<br />
Ongoing operating profit $÷÷«742 (9) $÷÷«813 10<br />
U.S. Restaurant Unit Activity<br />
Company Franchisees Licensees Total<br />
Balance at Dec. 26, 1998 6,232 10,862 3,275 20,369<br />
Openings & Acquisitions 155 432 539 1,126<br />
Refranchising & Licensing (1,170) 1,167 3 –<br />
Closures (230) (248) (593) (1,071)<br />
Other (3) (103) (124) (230)<br />
Balance at Dec. 25, 1999 4,984 12,110 3,100 20,194<br />
Openings & Acquisitions 143 366 303 812<br />
Refranchising & Licensing (672) 681 (9) –<br />
Closures (153) (295) (521) (969)<br />
Balance at Dec. 30, <strong>2000</strong> (a) 4,302 12,862 2,873 20,037<br />
% of total 21.5% 64.2% 14.3% 100.0%<br />
(a) Includes 37 Company units approved for closure, but not yet closed at<br />
December 30, <strong>2000</strong>.