2000 Annual Report - Yum!
2000 Annual Report - Yum!
2000 Annual Report - Yum!

Create successful ePaper yourself
Turn your PDF publications into a flip-book with our unique Google optimized e-Paper software.
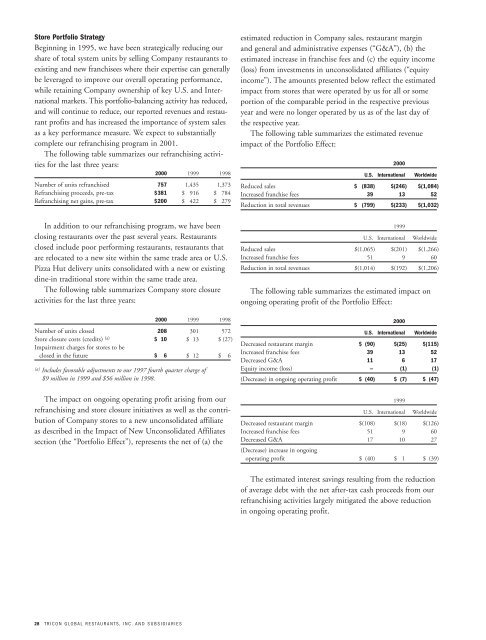
Store Portfolio Strategy<br />
Beginning in 1995, we have been strategically reducing our<br />
share of total system units by selling Company restaurants to<br />
existing and new franchisees where their expertise can generally<br />
be leveraged to improve our overall operating performance,<br />
while retaining Company ownership of key U.S. and International<br />
markets. This portfolio-balancing activity has reduced,<br />
and will continue to reduce, our reported revenues and restaurant<br />
profits and has increased the importance of system sales<br />
as a key performance measure. We expect to substantially<br />
complete our refranchising program in 2001.<br />
The following table summarizes our refranchising activities<br />
for the last three years:<br />
<strong>2000</strong> 1999 1998<br />
Number of units refranchised 757 1,435 1,373<br />
Refranchising proceeds, pre-tax $381 $«««916 $«««784<br />
Refranchising net gains, pre-tax $200 $«««422 $«««279<br />
In addition to our refranchising program, we have been<br />
closing restaurants over the past several years. Restaurants<br />
closed include poor performing restaurants, restaurants that<br />
are relocated to a new site within the same trade area or U.S.<br />
Pizza Hut delivery units consolidated with a new or existing<br />
dine-in traditional store within the same trade area.<br />
The following table summarizes Company store closure<br />
activities for the last three years:<br />
28 TRICON GLOBAL RESTAURANTS, INC. AND SUBSIDIARIES<br />
<strong>2000</strong> 1999 1998<br />
Number of units closed 208 301 572<br />
Store closure costs (credits) (a) $««10 $««13 $«(27)<br />
Impairment charges for stores to be<br />
closed in the future $««÷6 $««12 $«÷«6<br />
(a) Includes favorable adjustments to our 1997 fourth quarter charge of<br />
$9 million in 1999 and $56 million in 1998.<br />
The impact on ongoing operating profit arising from our<br />
refranchising and store closure initiatives as well as the contribution<br />
of Company stores to a new unconsolidated affiliate<br />
as described in the Impact of New Unconsolidated Affiliates<br />
section (the “Portfolio Effect”), represents the net of (a) the<br />
estimated reduction in Company sales, restaurant margin<br />
and general and administrative expenses (“G&A”), (b) the<br />
estimated increase in franchise fees and (c) the equity income<br />
(loss) from investments in unconsolidated affiliates (“equity<br />
income”). The amounts presented below reflect the estimated<br />
impact from stores that were operated by us for all or some<br />
portion of the comparable period in the respective previous<br />
year and were no longer operated by us as of the last day of<br />
the respective year.<br />
The following table summarizes the estimated revenue<br />
impact of the Portfolio Effect:<br />
<strong>2000</strong><br />
U.S. International Worldwide<br />
Reduced sales $«««(838) $(246) $(1,084)<br />
Increased franchise fees 39 13 52<br />
Reduction in total revenues $«««(799) $(233) $(1,032)<br />
1999<br />
U.S. International Worldwide<br />
Reduced sales $(1,065) $(201) $(1,266)<br />
Increased franchise fees 51 9 60<br />
Reduction in total revenues $(1,014) $(192) $(1,206)<br />
The following table summarizes the estimated impact on<br />
ongoing operating profit of the Portfolio Effect:<br />
<strong>2000</strong><br />
U.S. International Worldwide<br />
Decreased restaurant margin $««(90) $(25) $(115)<br />
Increased franchise fees 39 13 52<br />
Decreased G&A 11 6 17<br />
Equity income (loss) – (1) (1)<br />
(Decrease) in ongoing operating profit $««(40) $÷(7) $÷(47)<br />
1999<br />
U.S. International Worldwide<br />
Decreased restaurant margin $(108) $(18) $(126)<br />
Increased franchise fees 51 9 60<br />
Decreased G&A 17 10 27<br />
(Decrease) increase in ongoing<br />
operating profit $÷(40) $÷«1 $÷(39)<br />
The estimated interest savings resulting from the reduction<br />
of average debt with the net after-tax cash proceeds from our<br />
refranchising activities largely mitigated the above reduction<br />
in ongoing operating profit.