2000 Annual Report - Yum!
2000 Annual Report - Yum!
2000 Annual Report - Yum!

Create successful ePaper yourself
Turn your PDF publications into a flip-book with our unique Google optimized e-Paper software.
Worldwide System Sales<br />
System sales increased $397 million or 2% in <strong>2000</strong>, after a 1%<br />
unfavorable impact from foreign currency translation. Excluding<br />
the negative impact of foreign currency translation and the<br />
favorable impact of the fifty-third week, system sales increased<br />
1%. This increase was driven by new unit development, partially<br />
offset by store closures and same store sales declines.<br />
In 1999, system sales increased $1.1 billion or 6%. The<br />
improvement was driven by new unit development and same<br />
store sales growth. U.S. development was primarily at Taco<br />
Bell while International development was primarily in Asia.<br />
The increase was partially offset by store closures.<br />
Worldwide Revenues<br />
Company sales decreased $794 million or 11% in <strong>2000</strong>. As<br />
expected, the decline in Company sales was primarily due to<br />
the Portfolio Effect partially offset by the favorable impact<br />
from the fifty-third week in <strong>2000</strong>. Excluding these items,<br />
Company sales increased 4%. This increase was primarily<br />
due to new unit development and favorable Effective Net<br />
Pricing, partially offset by volume declines. Effective Net<br />
Pricing includes increases or decreases in price and the effect<br />
of changes in product mix.<br />
Franchise and license fees increased approximately $65 million<br />
or 9% in <strong>2000</strong>. The increase was driven by units acquired<br />
from us and new unit development, partially offset by store<br />
closures and franchisee same store sales declines in the U.S.<br />
The negative impact of foreign currency translation was<br />
essentially offset by the favorable impact from the fifty-third<br />
week in <strong>2000</strong>.<br />
Company sales decreased $753 million or 10% in 1999.<br />
As expected, the decline in Company sales was due to the<br />
Portfolio Effect. Excluding the Portfolio Effect, Company sales<br />
increased 8%. The increase was primarily due to new unit<br />
development, favorable Effective Net Pricing and volume<br />
increases in the U.S. and International. The volume increase in<br />
the U.S. was led by the launch of “The Big New Yorker” pizza.<br />
Franchise and license fees grew $96 million or 15% in<br />
1999. The growth was primarily driven by units acquired from<br />
us and new unit development, primarily in Asia and at Taco<br />
Bell in the U.S., partially offset by store closures by franchisees<br />
and licensees.<br />
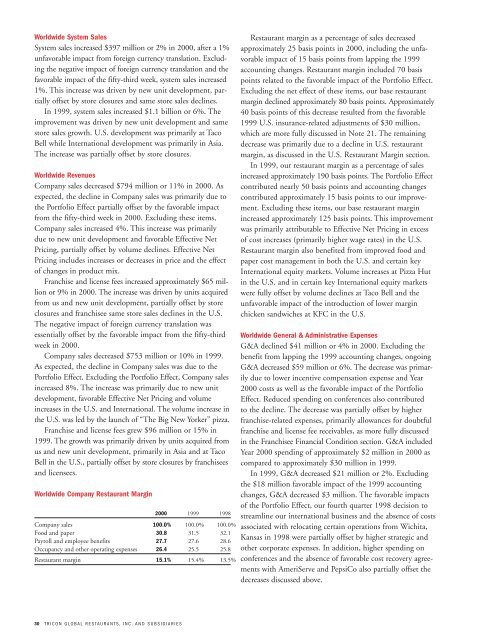
Worldwide Company Restaurant Margin<br />
30 TRICON GLOBAL RESTAURANTS, INC. AND SUBSIDIARIES<br />
<strong>2000</strong> 1999 1998<br />
Company sales 100.0% 100.0% 100.0%<br />
Food and paper 30.8 31.5 32.1<br />
Payroll and employee benefits 27.7 27.6 28.6<br />
Occupancy and other operating expenses 26.4 25.5 25.8<br />
Restaurant margin 15.1% 15.4% 13.5%<br />
Restaurant margin as a percentage of sales decreased<br />
approximately 25 basis points in <strong>2000</strong>, including the unfavorable<br />
impact of 15 basis points from lapping the 1999<br />
accounting changes. Restaurant margin included 70 basis<br />
points related to the favorable impact of the Portfolio Effect.<br />
Excluding the net effect of these items, our base restaurant<br />
margin declined approximately 80 basis points. Approximately<br />
40 basis points of this decrease resulted from the favorable<br />
1999 U.S. insurance-related adjustments of $30 million,<br />
which are more fully discussed in Note 21. The remaining<br />
decrease was primarily due to a decline in U.S. restaurant<br />
margin, as discussed in the U.S. Restaurant Margin section.<br />
In 1999, our restaurant margin as a percentage of sales<br />
increased approximately 190 basis points. The Portfolio Effect<br />
contributed nearly 50 basis points and accounting changes<br />
contributed approximately 15 basis points to our improvement.<br />
Excluding these items, our base restaurant margin<br />
increased approximately 125 basis points. This improvement<br />
was primarily attributable to Effective Net Pricing in excess<br />
of cost increases (primarily higher wage rates) in the U.S.<br />
Restaurant margin also benefited from improved food and<br />
paper cost management in both the U.S. and certain key<br />
International equity markets. Volume increases at Pizza Hut<br />
in the U.S. and in certain key International equity markets<br />
were fully offset by volume declines at Taco Bell and the<br />
unfavorable impact of the introduction of lower margin<br />
chicken sandwiches at KFC in the U.S.<br />
Worldwide General & Administrative Expenses<br />
G&A declined $41 million or 4% in <strong>2000</strong>. Excluding the<br />
benefit from lapping the 1999 accounting changes, ongoing<br />
G&A decreased $59 million or 6%. The decrease was primarily<br />
due to lower incentive compensation expense and Year<br />
<strong>2000</strong> costs as well as the favorable impact of the Portfolio<br />
Effect. Reduced spending on conferences also contributed<br />
to the decline. The decrease was partially offset by higher<br />
franchise-related expenses, primarily allowances for doubtful<br />
franchise and license fee receivables, as more fully discussed<br />
in the Franchisee Financial Condition section. G&A included<br />
Year <strong>2000</strong> spending of approximately $2 million in <strong>2000</strong> as<br />
compared to approximately $30 million in 1999.<br />
In 1999, G&A decreased $21 million or 2%. Excluding<br />
the $18 million favorable impact of the 1999 accounting<br />
changes, G&A decreased $3 million. The favorable impacts<br />
of the Portfolio Effect, our fourth quarter 1998 decision to<br />
streamline our international business and the absence of costs<br />
associated with relocating certain operations from Wichita,<br />
Kansas in 1998 were partially offset by higher strategic and<br />
other corporate expenses. In addition, higher spending on<br />
conferences and the absence of favorable cost recovery agreements<br />
with AmeriServe and PepsiCo also partially offset the<br />
decreases discussed above.