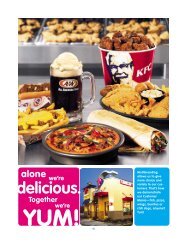
Multibranding - Yum!
Multibranding - Yum!
Multibranding - Yum!

Create successful ePaper yourself
Turn your PDF publications into a flip-book with our unique Google optimized e-Paper software.
as a decrease primarily driven by store closures was largely<br />
offset by new unit development.<br />
Company sales increased $491 million or 11% in<br />
2002. Excluding the favorable impact of the YGR acquisition,<br />
company sales increased 3%. The increase was driven<br />
by new unit development and same store sales growth.<br />
The increase was partially offset by store closures and<br />
refranchising.<br />
Franchise and license fees increased $29 million or<br />
5% in 2002. Excluding the favorable impact of the YGR<br />
acquisition, franchise and license fees increased 3%. The<br />
increase was driven by same store sales growth and new<br />
unit development, partially offset by store closures.<br />
U.S. SAME STORE SALES<br />
U.S. same store sales includes only company restaurants<br />
that have been open one year or more. U.S. blended same<br />
store sales include KFC, Pizza Hut, and Taco Bell company<br />
owned restaurants only. U.S. same store sales for Long John<br />
Silver’s and A&W restaurants are not included. Following are<br />
the same store sales growth results by brand:<br />
2003<br />
Same Average<br />
Store Trans- Guest<br />
Sales actions Check<br />
KFC (2)% (4)% 2%<br />
Pizza Hut (1)% (4)% 3%<br />
Taco Bell 2% 1%<br />
2002<br />
1%<br />
Same Average<br />
Store Trans- Guest<br />
Sales actions Check<br />
KFC — (2)% 2%<br />
Pizza Hut — (2)% 2%<br />
Taco Bell 7% 4% 3%<br />
For 2003, blended Company same store sales were flat<br />
due to a decrease in transactions offset by an increase in<br />
average guest check. For 2002, blended Company same<br />
store sales were up 2% due to increases in both transactions<br />
and average guest check.<br />
U.S. COMPANY RESTAURANT MARGIN<br />
2003 2002 2001<br />
Company sales 100.0% 100.0% 100.0%<br />
Food and paper 28.8 28.2 28.6<br />
Payroll and employee benefits<br />
Occupancy and other operating<br />
31.0 30.9 30.6<br />
expenses 25.6 24.9 25.6<br />
Company restaurant margin 14.6% 16.0% 15.2%<br />
Restaurant margin as a percentage of sales decreased<br />
approximately 140 basis points in 2003. The decrease<br />
was primarily driven by increased occupancy expenses<br />
<strong>Yum</strong>! Brands Inc. 39.<br />
due to higher rent, primarily due to additional rent expense<br />
associated with the amended YGR sale-leaseback agreements,<br />
and utilities. The higher food and paper costs were<br />
primarily due to the impact of unfavorable discounting and<br />
product mix. Also contributing to the decrease was higher<br />
labor costs, primarily driven by low single-digit increases<br />
in wage rates.<br />
Restaurant margin as a percentage of sales increased<br />
approximately 80 basis points in 2002. The increase<br />
includes the favorable impact of approximately 50 basis<br />
points from the adoption of SFAS 142, which was partially<br />
offset by the unfavorable impact of approximately 20 basis<br />
points from the YGR acquisition. The increase was primarily<br />
driven by the favorable impact of same store sales growth<br />
on margin and lower food and paper costs, partially offset by<br />
an increase in labor costs. The decrease in food and paper<br />
costs was primarily driven by cheese costs. The increase in<br />
labor costs was primarily driven by wage rates.<br />
U.S. OPERATING PROFIT<br />
Operating profit increased $10 million or 1% in 2003.<br />
Excluding the favorable impact of the YGR acquisition,<br />
operating profit was flat compared to 2002. Decreases<br />
driven by lower margins as a result of increased occupancy<br />
expenses and the impact of unfavorable discounting and<br />
product mix shift on food and paper costs were offset by<br />
lower franchise and license and general and administrative<br />
expenses.<br />
Operating profit increased $107 million or 15% in<br />
2002, including a 3% favorable impact from the adoption<br />
of SFAS 142. Excluding the favorable impact of both SFAS<br />
142 and the YGR acquisition, operating profit increased<br />
9%. The increase was driven by same store sales growth<br />
and the favorable impact of lapping franchise support costs<br />
related to the restructuring of certain Taco Bell franchisees<br />
in 2001. The increase was partially offset by higher restaurant<br />
operating costs, primarily due to higher labor costs, and<br />
the unfavorable impact of refranchising and store closures.<br />
The higher labor costs were driven by wage rates.<br />
INTERNATIONAL RESULTS OF OPERATIONS<br />
% B/(W) % B/(W)<br />
vs. vs.<br />
2003 2002 2002 2001<br />
Revenue<br />
Company sales $ 2,360 12 $ 2,113 14<br />
Franchise and license fees 365 23 297 8<br />
Total revenues $ 2,725 13 $ 2,410 13<br />
Company restaurant margin $ 365 8 $ 337 31<br />
% of Company sales 15.5% (0.5) ppts. 16.0% 2.1 )ppts.<br />
Operating profit $ 441 22 $ 361 19