EMG ppt
EMG ppt
EMG ppt

Create successful ePaper yourself
Turn your PDF publications into a flip-book with our unique Google optimized e-Paper software.
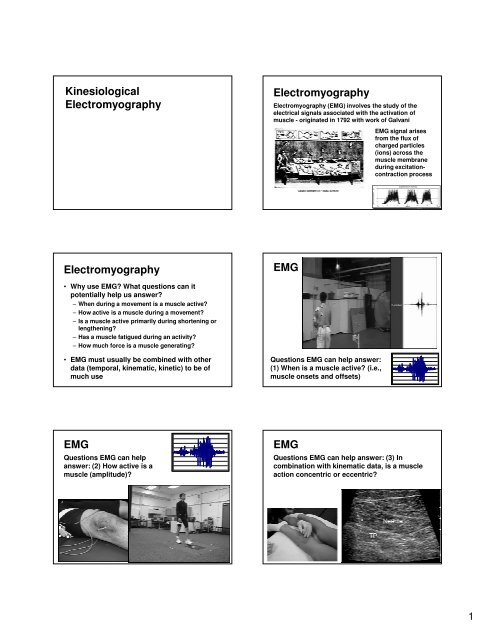
Kinesiological<br />
Electromyography<br />
Electromyography<br />
Electromyography (<strong>EMG</strong>) involves the study of the<br />
electrical signals associated with the activation of<br />
muscle - originated in 1792 with work of Galvani<br />
<strong>EMG</strong> signal arises<br />
from the flux of<br />
charged particles<br />
(ions) across the<br />
muscle membrane<br />
during excitationcontraction<br />
process<br />
Electromyography<br />
<strong>EMG</strong><br />
• Why use <strong>EMG</strong>? What questions can it<br />
potentially help us answer?<br />
– When during a movement is a muscle active?<br />
– How active is a muscle during a movement?<br />
– Is a muscle active primarily during shortening or<br />
lengthening?<br />
– Has a muscle fatigued during an activity?<br />
– How much force is a muscle generating?<br />
• <strong>EMG</strong> must usually be combined with other<br />
data (temporal, kinematic, kinetic) to be of<br />
much use<br />
Questions <strong>EMG</strong> can help answer:<br />
(1) When is a muscle active? (i.e.,<br />
muscle onsets and offsets)<br />
<strong>EMG</strong><br />
Questions <strong>EMG</strong> can help<br />
answer: (2) How active is a<br />
muscle (amplitude)?<br />
<strong>EMG</strong><br />
Questions <strong>EMG</strong> can help answer: (3) In<br />
combination with kinematic data, is a muscle<br />
action concentric or eccentric?<br />
1
<strong>EMG</strong><br />
Questions <strong>EMG</strong> can help<br />
answer: (4) Has a muscle<br />
fatigued during an<br />
activity?<br />
Basic Concepts<br />
Motor Unit<br />
One α-motorneuron and all<br />
the muscle fibers that it<br />
innervates<br />
The motor unit is the<br />
functional unit of the<br />
neuromuscular system<br />
Basic Concepts<br />
Neuromuscular Junction<br />
Synaptic junction between one<br />
axon of an α-motoneuron and the<br />
corresponding muscle fiber<br />
Acetycholine released from axon<br />
terminal into synaptic cleft, binds<br />
with receptor sites on motor end<br />
plate of muscle<br />
May lead to generation of an<br />
action potential that propagates<br />
outward from motor end plate<br />
along muscle membrane<br />
Basic Concepts<br />
Muscle Fiber Action<br />
Potential (MFAP)<br />
A single moving dipole<br />
associated with changes<br />
in membrane potential<br />
due to propagation of<br />
action potential along<br />
muscle membrane<br />
The moving dipole is the<br />
basis for <strong>EMG</strong>, and<br />
triggers the contraction<br />
process<br />
Basic Concepts<br />
Basic Concepts<br />
Motor Unit Action<br />
Potential (MUAP)<br />
The algebraic sum of all<br />
MFAP in a motor unit<br />
Each muscle fiber has a<br />
unique MFAP: affected by;<br />
size & location of fiber,<br />
surrounding tissue, etc<br />
Each muscle fiber makes<br />
a contribution to MUAP<br />
Motor Unit Action Potential (MUAP)<br />
Muscles can have 100’s of motor units with 1000’s<br />
of fibers each, resulting in a very complex signal<br />
e.g., Henneman reported cat gastrocnemius<br />
has > 1000 fibers/MU and > 300 MU/muscle<br />
The two following summations exist in the<br />
recorded <strong>EMG</strong> signal<br />
<strong>EMG</strong> = ΣMUAP’s and MUAP = ΣMFAP’s<br />
2
Basic Concepts<br />
Two primary strategies used by CNS to<br />
increase muscle force:<br />
Recruitment - activation of previously silent motor<br />
units<br />
Rate Coding - previously active motor units are<br />
stimulated at a higher rate<br />
Both processes will result in more force, and<br />
larger <strong>EMG</strong> amplitude, but not necessarily in a<br />
linear manner<br />
Electrodes<br />
Electrode types (typically<br />
Ag/AgCl, to minimize<br />
resistance to current flow)<br />
• Surface - placed on the skin<br />
with adhesive over muscle<br />
– larger pick-up zone, may be<br />
more representative of<br />
whole muscle activation<br />
– more susceptible to crosstalk<br />
– can only be used with<br />
superficial muscles<br />
Electrodes<br />
Electrode types (typically<br />
Ag/AgCl, to minimize<br />
resistance to current flow)<br />
• Indwelling - Needle or fine-wire<br />
inserted into muscle<br />
– smaller pick-up zone than<br />
surface electrodes<br />
– more selective, can be used<br />
for motor unit studies<br />
– can be used to reach deep<br />
muscles<br />
Electrodes<br />
Amplitude & Frequency Characteristics of<br />
<strong>EMG</strong> Signals<br />
Indwelling<br />
Surface<br />
Amplitude (mV)* 0.05 - 5 0.01 - 5<br />
Total Freq Range (Hz) 0.1 - 10000 1 - 3000<br />
Primary Freq Range (Hz) 40 - 400 20 - 200<br />
Min Sampling Rate (Hz) 800 400<br />
Preferred Samp Rate (Hz) 2000 1000<br />
*Low <strong>EMG</strong> signal amplitude requires amplification before recording<br />
Electrodes<br />
Frequency characteristics of <strong>EMG</strong> signals<br />
recorded with different electrodes<br />
Recording the <strong>EMG</strong><br />
Objective when recording an <strong>EMG</strong> signal<br />
Obtain a signal that is:<br />
– An undistorted representation of ΣMUAP’s<br />
– Free of noise and artifact<br />
– Stable and reliable<br />
– Has a minimum of cross-talk from other muscles<br />
– Has a high signal-to-noise ratio<br />
Other signals may be present that overlap with <strong>EMG</strong><br />
spectrum: ECG (1-100 Hz), power line hum (60 Hz),<br />
movement artifact (0-10 Hz)<br />
3
Recording the <strong>EMG</strong><br />
Signal is dependent on:<br />
– Amount and type of interspersed tissue<br />
– Electrode size<br />
– Electrode spacing<br />
– Electrode position over the muscle<br />
– Amplifier characteristics<br />
Recording the <strong>EMG</strong><br />
Electrode placement - should be between innervation<br />
zone and distal tendon, or between two innervation<br />
zones; long axis of electrode should be parallel to<br />
muscle fibers<br />
Noise arises from<br />
– Other biosignals (e.g., ECG)<br />
– Power line hum<br />
– Electrode movement<br />
– Cabling artifact<br />
– Amplifier<br />
Recording the <strong>EMG</strong><br />
Electrode placement<br />
Recording the <strong>EMG</strong><br />
Effect of electrode placement on signal characteristics<br />
– Do not place electrode near myotendonous<br />
junction<br />
– Do not place electrode at innervation zone (motor<br />
point); this was a commonly recommended<br />
location to put the electrode for many years<br />
– Approximate innervation zone locations and fiber<br />
orientations can be obtained from atlases<br />
– In the absence of better information, place the<br />
electrode just distal to mid-point of muscle belly<br />
– http://seniam.org/<br />
Recording the <strong>EMG</strong><br />
Amplifier Considerations<br />
• <strong>EMG</strong> amps come in two configurations<br />
– Single-ended<br />
– Differential<br />
• Major amplifier characteristics that affect<br />
signal quality are:<br />
– System gain<br />
– Input impedance<br />
– Frequency response<br />
– Common-mode rejection<br />
Recording the <strong>EMG</strong><br />
Single-ended amplifier (monopolar): recorded <strong>EMG</strong><br />
voltage at electrode is referenced to a distant ground<br />
electrode<br />
Differential amplifier (bipolar): recorded <strong>EMG</strong> voltage is<br />
difference between signal on two electrodes after<br />
comparison with reference ground electrode<br />
4
Recording the <strong>EMG</strong><br />
Amplifier Gain<br />
• The low amplitude of <strong>EMG</strong> signals (< 5 mV)<br />
necessitates amplification to the order of<br />
volts (e.g., ×1000)<br />
• Gain setting is typically user selectable<br />
• Preamplifiers - some electrodes have built-in<br />
amplifiers to boost signal at recording site<br />
– Increases signal-to-noise ratio<br />
– Minimizes movement artifact<br />
Recording the <strong>EMG</strong><br />
Amplifier Input Impedance (Resistance)<br />
• Amp input impedance must be high relative<br />
to skin-electrode impedance; otherwise<br />
signal amplitude will be attenuated<br />
• Minimum input impedance for s<strong>EMG</strong> is 1 MΩ;<br />
commercial systems typically 10-100 MΩ<br />
• Mathematically we want V INP ≈ V <strong>EMG</strong> , or<br />
V INP ≈ 1.0<br />
V <strong>EMG</strong><br />
Recording the <strong>EMG</strong><br />
Amplifier Input Impedance (Resistance)<br />
• Example 1 - poor <strong>EMG</strong> circuit<br />
– R Skin1 = R Skin2 = 10,000 Ω (minimal skin prep)<br />
– R INP = 80,000 Ω (low by today’s standards)<br />
– R TOT = 10,000 + 10,000 + 80,000 = 100 kΩ<br />
Current (I) due to a 2 mV signal (Ohm’s Law V=I⋅R)<br />
– I = V <strong>EMG</strong> / R TOT = (2×10 -3 V) / (1×10 5 Ω) = 2×10 -8 amps<br />
– Thus, V INP = I⋅R INP = (2×10 -8 amps)(8×10 4 Ω) = 1.6 mV<br />
The 2 mV signal has been attenuated by 20%<br />
This is not good!<br />
Recording the <strong>EMG</strong><br />
Amplifier Input Impedance (Resistance)<br />
• Example 2 - better <strong>EMG</strong> circuit<br />
– R Skin1 = R Skin2 = 1,000 Ω (substantial skin prep)<br />
– R INP = 1,000,000 Ω (higher input impedance)<br />
– R TOT = 1,000 + 1,000 + 1,000,000 = 1.002 MΩ<br />
Current (I) due to a 2 mV signal (Ohm’s Law V=I⋅R)<br />
– I = V <strong>EMG</strong> / R TOT = (2×10 -3 V) / (1.002×10 6 Ω) = 1.9962×10 -9 amps<br />
– Thus, V INP = I⋅R INP = (1.9962×10 -9 amps)(1×10 6 Ω) = 1.996 mV<br />
Now the 2 mV signal has been attenuated by at trivial<br />
0.2% - This is much better!<br />
Recording the <strong>EMG</strong><br />
Amplifier Frequency Response<br />
• Every amplifier has a bandwidth (range) over<br />
which it amplifies signals with limited<br />
distortion<br />
Recording the <strong>EMG</strong><br />
Amplifier Common-Mode Rejection Ratio<br />
• Differential amp set-up allows common noise<br />
to be removed from recorded <strong>EMG</strong> signal<br />
• Above and below this range the amplification<br />
will be less than desired<br />
• Recommended frequency response for <strong>EMG</strong><br />
– Surface 10-1000 Hz<br />
– Indwelling 20-2000 Hz<br />
m 1 - <strong>EMG</strong> at electrode 1<br />
m 2 - <strong>EMG</strong> at electrode 2<br />
n - noise, typically from<br />
electrical interference<br />
5
Recording the <strong>EMG</strong><br />
Amplifier Common-Mode Rejection Ratio<br />
• CMRR is a measure of how well common<br />
signals are rejected in a differential set-up<br />
• CMRR of 1000:1 means all but 1/1000 of a<br />
common signal will be removed from recording<br />
• Minimally acceptable CMRR for <strong>EMG</strong><br />
– 10,000:1<br />
• Typical CMRR for commercial <strong>EMG</strong> amps<br />
– 20,000-100,00:1<br />
Recording the <strong>EMG</strong><br />
Amplifiers - a final note<br />
• <strong>EMG</strong> amps commonly have one or more<br />
hardware filters; these are analog filters that<br />
are applied before A/D conversion<br />
– High-pass filter - for removing movement artifact;<br />
common cutoff frequency of 10-20 Hz<br />
– Low-pass filter - to prevent aliasing during the A/D<br />
conversion process; common cutoff frequency of<br />
500-1000 Hz<br />
– Band-pass filter - equivalent to a high-pass followed<br />
by a low-pass filter<br />
Processing the <strong>EMG</strong><br />
A recorded <strong>EMG</strong> can be processed in<br />
numerous ways – some of the most common:<br />
– DC bias removal<br />
– Full-wave rectification<br />
– Linear envelope<br />
– Temporal analysis<br />
– Root-mean-square<br />
– Average amplitude<br />
– Peak amplitude<br />
– True mathematical integration<br />
– Frequency analysis<br />
– Amplitude normalization<br />
Processing the <strong>EMG</strong><br />
After data have been DC-bias corrected, full wave<br />
rectified, and possibly low-pass filtered, the two most<br />
common means for quantifying <strong>EMG</strong> signal strength are<br />
average amplitude and root mean square (RMS) value<br />
Average amplitude is the mean value of the rectified<br />
signal over a specified period of time, and represents the<br />
area under the curve for this time interval<br />
RMS value is the square root of the average power of the<br />
<strong>EMG</strong> signal over a specified period of time<br />
Processing the <strong>EMG</strong><br />
Amplitude Normalization<br />
• Many factors affect amplitude of <strong>EMG</strong> signal<br />
• There is little basis for comparing absolute<br />
<strong>EMG</strong> values across subjects, or even<br />
between muscles within a subject<br />
• Normalizing <strong>EMG</strong> signal amplitude to a<br />
reference condition improves validity of such<br />
comparisons<br />
– Data during trials are then expressed as a<br />
percentage of value from the reference condition<br />
Processing the <strong>EMG</strong><br />
Common Normalization References:<br />
– Maximal isometric voluntary contraction<br />
– Submaximal isometric voluntary contraction<br />
– Peak <strong>EMG</strong> amplitude during activity<br />
– Average <strong>EMG</strong> amplitude during activity<br />
Yang and Winter (1984) found the last two<br />
methods greatly reduced inter-subject<br />
variability, but at the expense of a<br />
meaningfulness of <strong>EMG</strong> amplitude (no longer<br />
related to some standard level of effort)<br />
6
Applications of <strong>EMG</strong><br />
There are numerous uses of <strong>EMG</strong> in human<br />
movement; some of the most common are:<br />
• Temporal Analysis (on-off timing)<br />
• <strong>EMG</strong> - Muscle Force Relation<br />
• Muscle Fatigue Assessment<br />
<strong>EMG</strong> - Temporal Analysis<br />
<strong>EMG</strong> Onset Time Determination<br />
• Common approach is to use a threshold<br />
above which <strong>EMG</strong> is considered to be ‘on’<br />
– Determine a 2-3 SD window of the resting <strong>EMG</strong><br />
signal (represents baseline noise)<br />
– <strong>EMG</strong> signal must exceed this threshold for a<br />
minimum time (e.g., 20-50 ms) to be considered on<br />
– Similar approach is used to determine ‘off’ time<br />
<strong>EMG</strong> - Muscle Force Relation<br />
• In 1952 Lippold reported a linear relation<br />
between <strong>EMG</strong> amplitude of ankle plantarflexors,<br />
and the torque produced by these<br />
muscles for isometric contractions<br />
• Numerous studies have confirmed these<br />
results, while just as many have reported a<br />
nonlinear relation between <strong>EMG</strong> and<br />
isometric muscle force/torque<br />
<strong>EMG</strong> - Muscle Force Relation<br />
Note linear<br />
relation for FDI<br />
and nonlinear<br />
relations for<br />
deltoid and biceps<br />
• For nonlinear case, <strong>EMG</strong> increases faster<br />
than muscle force<br />
<strong>EMG</strong> - Muscle Force Relation<br />
<strong>EMG</strong> - Muscle Force Relation<br />
• Under non-isometric conditions, factors<br />
other than neural drive affect <strong>EMG</strong> amplitude<br />
and muscle force production<br />
• <strong>EMG</strong> signal affected by<br />
– location of muscle fibers under electrode<br />
– change in muscle temperature / subject sweating<br />
• Muscle force affected by<br />
– force-length relation<br />
– force-velocity relation<br />
force-length<br />
relation<br />
force-velocity<br />
relation at<br />
different<br />
activation<br />
levels<br />
active<br />
force-length<br />
relation at<br />
different<br />
activation<br />
levels<br />
combined<br />
force-length<br />
-velocity<br />
relation<br />
7
<strong>EMG</strong> - Muscle Force Relation<br />
Data from Komi (1973) suggest that force-velocity and forcelength<br />
factors are the major determinants of the dynamic<br />
<strong>EMG</strong>-force relation (other factors can not be ruled out though)<br />
<strong>EMG</strong> - Muscle Force Relation<br />
Electromechanical Delay<br />
– Build-up of muscle force trails the detection of<br />
<strong>EMG</strong> by some finite time period<br />
– Same thing happens with the cessation of <strong>EMG</strong> at<br />
end of a period of activity<br />
72 ms<br />
109 ms<br />
Cat soleus<br />
muscle <strong>EMG</strong><br />
and force<br />
during walking<br />
EMD values<br />
have been<br />
reported to<br />
range from<br />
10-100+ ms<br />
Equipment<br />
used may play<br />
a role<br />
<strong>EMG</strong> - Fatigue Assessment<br />
What is muscle fatigue? (multiple definitions exist)<br />
• Working definition: failure to generate or<br />
maintain the required or expected force,<br />
resulting from muscular activity, and<br />
reversible by rest<br />
• Major application of <strong>EMG</strong> in fatigue research<br />
is analysis of median (or mean) frequency<br />
– Median frequency shifts to the left (lower<br />
frequencies) with muscular fatigue<br />
<strong>EMG</strong> - Fatigue Assessment<br />
• The major physiological change with fatigue,<br />
perhaps affecting frequency content of the<br />
<strong>EMG</strong> signal is a decrease in muscle fiber<br />
conduction velocity<br />
• Some have argued that certain faster motor<br />
units drop out, but this is arguable<br />
• Increased synchronization of MU firing may<br />
also result in decreased median frequency<br />
<strong>EMG</strong> - Fatigue Assessment<br />
Again, I wish to acknowledge Brian<br />
Umberger, PHD for significant<br />
contributions to these slides<br />
From time ‘a’ to time ‘b’<br />
the muscle has fatigued,<br />
causing a shift in median<br />
frequency of PSD and a<br />
small increase in peak<br />
signal power<br />
Frequency Domain<br />
8