Relationships Between Ground Reaction Force Impulse And
Relationships Between Ground Reaction Force Impulse And
Relationships Between Ground Reaction Force Impulse And

Create successful ePaper yourself
Turn your PDF publications into a flip-book with our unique Google optimized e-Paper software.
GRF and Kinematics of Sprint Running 31<br />
JOURNAL OF APPLIED BIOMECHANICS, 2005, 21, 31-43<br />
© 2005 Human Kinetics Publishers, Inc.<br />
<strong>Relationships</strong> <strong>Between</strong> <strong>Ground</strong> <strong>Reaction</strong><br />
<strong>Force</strong> <strong>Impulse</strong> and Kinematics<br />
of Sprint-Running Acceleration<br />
Joseph P. Hunter1 , Robert N. Marshall1,2 , and Peter J. McNair3 1 2 The University of Auckland; Eastern Institute of Technology;<br />
3Auckland University of Technology<br />
The literature contains some hypotheses regarding the most favorable ground<br />
reaction force (GRF) for sprint running and how it might be achieved. This<br />
study tested the relevance of these hypotheses to the acceleration phase of a<br />
sprint, using GRF impulse as the GRF variable of interest. Thirty-six athletes<br />
performed maximal-effort sprints from which video and GRF data were collected<br />
at the 16-m mark. Associations between GRF impulse (expressed relative<br />
to body mass) and various kinematic measures were explored with simple<br />
and multiple linear regressions and paired t-tests. The regression results showed<br />
that relative propulsive impulse accounted for 57% of variance in sprint velocity.<br />
Relative braking impulse accounted for only 7% of variance in sprint<br />
velocity. In addition, the faster athletes tended to produce only moderate magnitudes<br />
of relative vertical impulse. Paired t-tests revealed that lower magnitudes<br />
of relative braking impulse were associated with a smaller touchdown<br />
distance (p < 0.01) and a more active touchdown (p < 0.001). Also, greater<br />
magnitudes of relative propulsive impulse were associated with a high mean<br />
hip extension velocity of the stance limb (p < 0.05). In conclusion, it is likely<br />
that high magnitudes of propulsion are required to achieve high acceleration.<br />
Although there was a weak trend for faster athletes to produce lower magnitudes<br />
of braking, the possibility of braking having some advantages could not<br />
be ruled out. Further research is required to see if braking, propulsive, and<br />
vertical impulses can be modified with specific training. This will also provide<br />
insight into how a change in one GRF component might affect the others.<br />
Key Words: braking impulse, propulsive impulse, vertical impulse<br />
The acceleration of the center of mass of a sprinter is determined by three<br />
external forces: ground reaction force (GRF), gravitational force, and wind resis-<br />
1 Dept. of Sport and Exercise Science, The University of Auckland, Auckland, New<br />
Zealand; 2 Faculty of Health and Sport Science, Eastern Institute of Technology, Hawkes<br />
Bay, NZ; 3 Physical Rehabilitation Research Centre, School of Physiotherapy, Auckland<br />
University of Technology, Auckland, NZ.<br />
31
32<br />
Hunter, Marshall, and McNair<br />
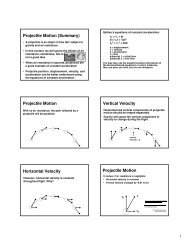
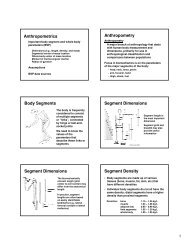
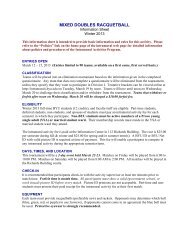
Figure 1 — The three external forces that determine the acceleration of a sprinter’s<br />
center of mass: ground reaction force (GRF), gravitational force (equivalent to body<br />
weight, BW), and wind resistance.<br />
tance (Figure 1). Of these three forces, the athlete has by far the most influence<br />
over the GRF. For analysis purposes, the GRF can be broken down into its three<br />
orthogonal components. In the case of sprint running, the horizontal (anteriorposterior)<br />
and vertical components are typically of most interest. Also of interest<br />
are the two subcomponents of the anterior-posterior horizontal GRF: a braking<br />
GRF acts posteriorly and usually occurs early in the stance phase, while a propulsive<br />
GRF acts anteriorly and usually occurs later in the stance phase.<br />
The literature on sprint running contains a number of hypotheses regarding<br />
the various GRF components. It has been recommended that sprinters should minimize<br />
the braking GRF (Mero & Komi, 1986; Mero, Komi, & Gregor, 1992; Wood,<br />
1987) and maximize the propulsive GRF (Mero et al., 1992). Furthermore, it has<br />
been suggested that, at maximal sprint velocity, the ability to produce a high, average<br />
vertical GRF in a short stance time is of advantage (Weyand, Sternlight, Bellizzi,<br />
& Wright, 2000).<br />
The literature also contains hypotheses on how a sprinter can reduce the<br />
braking GRF and increase the propulsive GRF. The braking GRF is thought to be<br />
reduced by the following: using a highly active touchdown (i.e., minimizing the<br />
forward horizontal velocity of the foot, relative to the ground, immediately before<br />
ground contact) (Hay, 1994, pp. 407-408; Mann & Sprague, 1983; Wood, 1987);<br />
ensuring a high extension velocity of the hip joint and a high flexion velocity of<br />
the knee joint at the instant of touchdown (Mann, Kotmel, Herman, Johnson, &<br />
Schultz, 1984; Mann & Sprague, 1983); and minimizing touchdown distance (i.e.,<br />
the distance the foot is placed in front of the center of mass at the instant of touchdown)<br />
(Mero et al., 1992). In contrast, the propulsive GRF is thought to be maximized<br />
by the following: ensuring a high angular velocity of the stance-limb hip<br />
joint (Mann & Sprague, 1983; Mann et al., 1984; Wiemann & Tidow, 1995); and<br />
fully extending the stance-limb hip, knee, and ankle joints at takeoff (see Hay,<br />
1994, pp. 408-409 for discussion).
GRF and Kinematics of Sprint Running 33<br />
These hypotheses, of which many have yet to be fully tested, were probably<br />
intended to have most relevance to the maximal-velocity phase of a sprint. In contrast,<br />
we were interested in their possible relevance to the acceleration phase. Furthermore,<br />
instead of focusing on the magnitude of the GRF as such, we wanted to<br />
focus on GRF impulse. GRF impulse is an informative measure because, when<br />
expressed relative to body mass, it reflects the change in velocity of the athlete (if<br />
the effect of wind resistance is ignored).<br />
Consequently, there were two purposes to this study. First, to determine the<br />
relationships between relative GRF impulse (“relative” indicating relative to body<br />
mass) and sprint velocity during the acceleration phase of a sprint. Second, to test<br />
the above stated hypotheses regarding the techniques to minimize braking and<br />
maximize propulsion, but from a GRF impulse perspective.<br />
Methods<br />
A total of 36 participants (31 M, 5 F) were tested for this study. All the men participated<br />
in sports involving sprint running (e.g., track and field, soccer, touch rugby)<br />
and all the women were track-and-field athletes. Mean ± SD for age, height, and<br />
body mass of the entire group were 23 ± 5 yrs, 1.76 ± 0.07 m, and 72 ± 8 kg,<br />
respectively. However, for the purpose of investigating group relationships, the<br />
entire group was considered too heterogeneous. Subsequently only the 28 fastest<br />
men (intended to represent a population of athletic men of average to very good<br />
sprint ability) were used for all regression analyses. The mean ± SD for age, height,<br />
and body mass of these 28 men were 22 ± 4 yrs, 1.77 ± 0.06 m, and 74 ± 6 kg,<br />
respectively. Note, though, that in other analyses in which each athlete was compared<br />
to him/herself (via paired t-tests), the entire group of 36 athletes was considered.<br />
Approval to undertake the study was given by The University of Auckland<br />
Human Subjects Ethics Committee. Written informed consent was obtained from<br />
each athlete.<br />
A detailed description of the data collection and data treatment is provided<br />
elsewhere (Hunter, Marshall, & McNair, 2004). Therefore only an overview is<br />
provided here. After warming up and being prepared with joint markers, each athlete<br />
performed maximal-effort sprint-running trials, 25 m in length, on a synthetic<br />
track in which a force plate (Bertec 6090s; Bertec Corp., Columbus, OH) was<br />
embedded. The sprints were performed from a standing start, and the athletes wore<br />
spiked track shoes. EVa 6.15 data collection system (Motion Analysis Corp., Santa<br />
Rosa, CA) was used to collect sagittal-plane video data (sampled at 240 Hz) and<br />
GRF data (sampled at 960 Hz) of a stride at the 16-m mark of the sprints. Successful<br />
trials were those in which the athlete clearly contacted the force plate without<br />
adjusting his or her natural running pattern. For this to occur, the sprint start line<br />
was adjusted by no more than 1 m. The foot to contact the force plate was the foot<br />
that was placed forward during the standing start. Typically, each athlete performed<br />
about 7 or 8 sprints which usually resulted in 4 or 5 successful trials (the range was<br />
3 to 6 successful trials). There was a rest period of about 4 minutes between sprints.<br />
The human body was modeled as 12 segments: feet, shanks, thighs, trunk,<br />
head (including neck), upper arms, and lower arms (including hands). Segment<br />
inertia parameters were obtained from de Leva (1996), with the exception of the<br />
foot’s center of mass location which was obtained from Winter (1990). The data<br />
were filtered with a low-pass Butterworth digital filter (Winter, 1990). Kinematic
34<br />
Hunter, Marshall, and McNair<br />
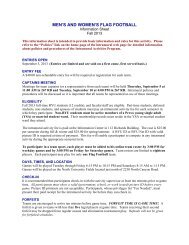
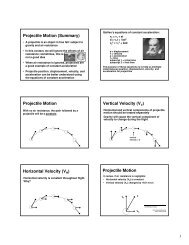
Figure 2 — Angles measured at touchdown and takeoff. The leg angle at touchdown<br />
(TD) was measured between horizontal and a line passing through the stance ankle<br />
and the body’s center of mass at the moment of touchdown. Hip (h), knee (k), and<br />
ankle (a) joint angles of the stance-limb were measured at the moment of takeoff.<br />
data were filtered with cutoff frequencies ranging from 7 Hz for upper-trunk markers<br />
to 12 Hz for foot markers. GRF data were filtered with a cutoff frequency of 75 Hz.<br />
The instants of touchdown and takeoff from the force plate were defined as<br />
when the vertical GRF first rose above 10 N (touchdown) and reduced to 25 N<br />
(takeoff). The instant of touchdown for the first ground contact beyond the force<br />
plate was assumed to occur at the instant of peak vertical acceleration of the head<br />
of the 2nd metatarsal (Hreljac & Marshall, 2000).<br />
The following variables were calculated from the kinematic data: (a) Sprint<br />
velocity: mean horizontal velocity of the center of mass during the step at the 16-m<br />
mark. (b) Hip joint kinematics: angular velocity at the moment of touchdown,<br />
mean and maximum angular velocities during stance, and the angle at the moment<br />
of takeoff (see Figure 2). (c) Knee joint kinematics: angular velocity at the moment<br />
of touchdown, and angle at the moment of takeoff (Figure 2). (d) Ankle joint kinematics:<br />
just one measurement, the angle at the moment of takeoff (Figure 2). For<br />
this measurement the foot was represented as a link from the posterior surface of<br />
the calcaneous to the head of the 2nd metatarsal. (e) Horizontal velocity of the foot<br />
before touchdown: horizontal velocity, relative to the ground, of the head of the<br />
2nd metatarsal, four frames (0.017 s) before touchdown. The lower the horizontal<br />
velocity of the foot, the more active the touchdown. That is, the athlete actively<br />
attempts to move the foot backward as fast as he or she is moving forward. (f) Leg<br />
angle at touchdown: measured between horizontal and a line passing through the<br />
stance ankle and center of mass, at the moment of touchdown (Figure 2). This<br />
angle was used as a measure of the horizontal distance the foot was placed in front<br />
of the center of mass at the moment of touchdown (i.e., touchdown distance).<br />
In addition, four measures of GRF impulse (hereafter referred to as impulse)<br />
were calculated from the force-plate data: relative vertical impulse, relative horizontal<br />
impulse, relative braking impulse, and relative propulsive impulse. The term
GRF and Kinematics of Sprint Running 35<br />
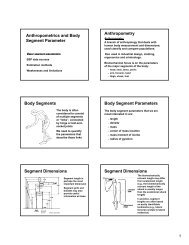
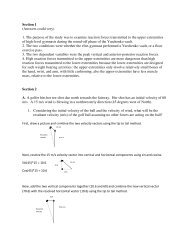
Figure 3 — <strong>Ground</strong> reaction force (GRF) impulses are shown as areas under the GRF<br />
curves. (a) p is the propulsive impulse, b is the braking impulse. Propulsive impulse was<br />
based on all horizontal positive force data during stance, and braking impulse was based<br />
on all horizontal negative force data during stance. Horizontal impulse was calculated as<br />
propulsive impulse less the absolute value of braking impulse. (b) v is the area under the<br />
vertical GRF curve, and BW impulse is the impulse due to body weight. Vertical impulse<br />
was calculated as v – BW impulse. When horizontal, braking, propulsive, and vertical<br />
impulses are expressed relative to body mass, they reflect the change in velocity of the<br />
center of mass (ignoring the effects of wind resistance) during the respective periods and in<br />
the respective directions.<br />
“relative” has been used to indicate that the impulses were expressed relative to<br />
body mass. Relative propulsive impulse was based on all horizontal positive force<br />
data during stance, and relative braking impulse was based on all horizontal negative<br />
force data during stance. Further details of how the relative impulses were<br />
calculated are given in Figure 3.<br />
Statistical analyses were performed in SPSS (release 10.0.5, SPSS Inc., Chicago).<br />
For all regression analyses, the means of the fastest three trials were used.<br />
For all paired t-tests, data from individual trials were used.<br />
To determine the relationships between sprint velocity and the relative impulses,<br />
we performed four simple (bivariate) linear regressions with sprint velocity<br />
as the dependent variable and each relative impulse as the independent variable.<br />
From the resulting regression equations, the influence of each relative impulse on
36<br />
Hunter, Marshall, and McNair<br />
sprint velocity was assessed by calculating the predicted increase in sprint velocity<br />
associated with a one standard deviation increase in relative impulse. In addition,<br />
we performed a stepwise multiple linear regression with sprint velocity as the dependent<br />
variable and relative vertical, braking, and propulsive impulses as the<br />
independent variables. The criterion for entry into the multiple regression model<br />
was p < 0.05, and the criterion for removal was p > 0.10. Alpha was set at 0.05 for<br />
all other statistical tests.<br />
The hypotheses regarding techniques to minimize braking (see introductory<br />
section) were assessed with paired t-tests. This involved selecting, from each athlete,<br />
two trials that clearly differed with regard to the magnitude of relative braking<br />
impulse, and then using paired t-tests on these two trials to detect differences<br />
in variables related to the braking hypotheses. That is, we wanted to know if a<br />
difference in relative braking impulse was associated with a difference in other<br />
variables of interest. For this analysis we were aware of two main requirements:<br />
(a) we needed a sample size large enough to ensured acceptable statistical power;<br />
and (b) we needed to exclude athletes for which relative braking impulse did not<br />
clearly differ (i.e., there was no point in testing for differences in the other variables<br />
if relative braking impulse itself did not differ).<br />
These two requirements were met by using the following method. From the<br />
fastest three trials of each athlete, the trial with the greatest magnitude of relative<br />
braking impulse was named the High Braking Trial, and the trial with the lowest<br />
magnitude was named the Low Braking Trial. If the difference between these two<br />
trials was less than 0.010 m/s, then that athlete was excluded from the analysis.<br />
According to this criterion, 6 athletes were excluded, thereby leaving 28 athletes<br />
(24 M and 4 F) included in the analysis. Paired t-tests were then used to contrast<br />
the High vs. Low Braking Trials for the following variables: sprint velocity, relative<br />
impulses, hip and knee joint angular velocities at touchdown, horizontal velocity<br />
of the foot before touchdown, and leg angle at touchdown.<br />
The hypotheses regarding techniques for maximizing propulsion were also<br />
assessed with paired t-tests. The within-subject variation of relative propulsive<br />
impulse (coefficient of variation of 4%) was smaller than that of relative braking<br />
impulse (coefficient of variation of 14%); however, the requirements of an acceptable<br />
sample size, and exclusion of athletes for which relative propulsive impulse<br />
did not clearly differ, could still be met using the following method. From all trials<br />
of each athlete (not the fastest three, as used for the braking analysis), the trial with<br />
the greatest magnitude of relative propulsive impulse was named the High Propulsion<br />
Trial, and the trial with the lowest magnitude was named the Low Propulsion<br />
Trial. If the difference between these two trials was less than 0.015 m/s, then that<br />
athlete was excluded from the analysis. According to this criterion, 6 athletes were<br />
excluded, thereby leaving 28 athletes (25 M and 3 F) in the analysis. Paired t-tests<br />
were then used to contrast the High vs. Low Propulsion Trials for the following<br />
variables: sprint velocity, relative impulses, mean and maximum hip joint extension<br />
velocities during stance, and hip, knee, and ankle angles at takeoff.<br />
According to the methods of Cohen (1977), 28 athletes provided 80% power<br />
in detecting a correlation coefficient of 0.50. Also, paired t-tests with 28 athletes<br />
and an expected test-retest correlation of 0.80 provided more than 70% power in<br />
detecting an effect size of 0.3.
GRF and Kinematics of Sprint Running 37<br />
Table 1 Sprint Velocity and Relative <strong>Impulse</strong>s of the 28 Male Athletes Used in All<br />
Regression Analyses<br />
Variables Mean SD<br />
Sprint velocity (m/s) a 8.29 0.34<br />
Relative vertical impulse (m/s) 0.99 0.10<br />
Relative horizontal impulse (m/s) 0.25 0.04<br />
Relative braking impulse (m/s) –0.10 0.02<br />
Relative propulsive impulse (m/s) 0.35 0.04<br />
a The range in sprint velocity was 7.44 to 8.80 m/s.<br />
Results<br />
Table 1 shows the means and standard deviations of sprint velocity and relative<br />
impulses of the 28 male athletes used in all regression analyses. Figure 4 shows<br />
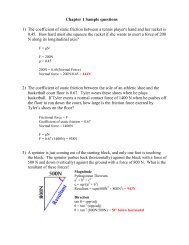
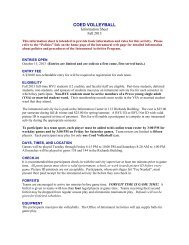
the results of the four simple linear regression analyses. The strongest predictor of<br />
sprint velocity was relative horizontal impulse (R 2 = 0.61, p < 0.001). A one standard<br />
deviation increase (0.04 m/s) in relative horizontal impulse resulted in a predicted<br />
increase of 0.26 m/s in sprint velocity. The next strongest predictor of sprint<br />
velocity was relative propulsive impulse (R 2 = 0.57, p < 0.001). A one standard<br />
deviation increase (0.04 m/s) in relative propulsive impulse also resulted in a predicted<br />
increase of 0.26 m/s in sprint velocity (i.e., an amount identical to the previous<br />
example). The linear relationship between relative vertical impulse and sprint<br />
velocity was comparatively weak but significant (R 2 = 0.17, p < 0.05). However,<br />
this relationship showed possible departure from linearity. The 4 fastest athletes<br />
had only moderate magnitudes of relative vertical impulse (ranging from 0.96 to<br />
1.03 m/s). Nonetheless, if using the linear regression equation, a one standard deviation<br />
increase (0.10 m/s) in relative vertical impulse resulted in a predicted increase<br />
of 0.14 m/s in sprint velocity (i.e., approx. half of the previous two examples).<br />
The simple linear regression between relative braking impulse and sprint velocity<br />
was not statistically significant (R 2 = 0.04, p > 0.05).<br />
The multiple linear regression to predict sprint velocity resulted in relative<br />
propulsive impulse being the first variable to enter the model, and explained 57%<br />
(R 2 = 0.57, p < 0.001) of the variance in sprint velocity. Relative braking impulse<br />
was the next variable to enter the model and explained a further 7% (R 2 increase =<br />
0.07, p < 0.05) of the variance. That is, the total variance in sprint velocity explained<br />
by relative propulsive impulse and relative braking impulse was 64% (total<br />
R 2 = 0.64, p < 0.001). Relative vertical impulse did not explain any further<br />
variance in sprint velocity and thus was not included in the model. The regression<br />
equation to predict sprint velocity (in m/s) was… velocity = 7.15·p + 4.12·b + 6.18<br />
…where p is the relative propulsive impulse and b is the relative braking impulse,<br />
both measured in m/s. Note that relative braking impulse was quantified as a negative<br />
value to indicate its posterior direction. Therefore, the multiple linear regres-
38<br />
Hunter, Marshall, and McNair<br />
Figure 4 — Simple linear regressions between sprint velocity and relative impulses.<br />
The relationship between sprint velocity and relative vertical impulse (a) shows possible<br />
departure from linearity. A nonlinear function, such as a quadratic equation (dashed<br />
line, R 2 = 0.24), is arguably a better description of this relationship. *p < 0.05, ***p <<br />
0.001<br />
sion revealed that greater magnitudes of relative braking impulse had a negative<br />
effect on sprint velocity, but greater magnitudes of relative propulsive impulse had<br />
a positive effect.<br />
Table 2 shows the results of the paired t-test used to analyze the hypotheses<br />
regarding techniques to minimize braking. Sprint velocity did not differ significantly,<br />
suggesting that fatigue was an unlikely cause of any of the other significant<br />
differences. The Low Braking Trials had a significantly lower relative vertical<br />
impulse, but relative propulsive impulse did not differ significantly. Of the hypotheses<br />
regarding minimization of braking, use of an active touchdown (i.e., low<br />
horizontal velocity of the foot before touchdown), and a small touchdown distance<br />
(i.e., large leg angle at touchdown) were statistically supported.<br />
Table 3 shows the results of the paired t-test used to analyze the hypotheses<br />
regarding techniques for maximizing propulsion. Sprint velocity did not differ sig-
GRF and Kinematics of Sprint Running 39<br />
Table 2 Paired t-test Results for Assessment of Hypotheses Regarding<br />
Minimization of Braking<br />
High Braking Trials Low Braking Trials<br />
Mean SD Mean SD<br />
Sprint Velocity and <strong>Impulse</strong>s<br />
Sprint velocity (m/s) 8.12 0.44 8.11 0.44<br />
Relative vertical impulse (m/s)*** 1.07 0.14 0.98 0.12<br />
Relative braking impulse (m/s)*** a –0.12 0.03 –0.09 0.03<br />
Relative propulsive impulse (m/s)<br />
Hypotheses<br />
Hip joint extension velocity at<br />
0.34 0.03 0.35 0.04<br />
touchdown (deg/s)<br />
Knee joint flexion velocity at<br />
388 93 396 75<br />
touchdown (deg/s) b Horizontal velocity of foot before<br />
–147 118 –150 88<br />
touchdown (m/s)*** 2.43 0.83 2.12 0.76<br />
Leg angle at touchdown (deg)** 80 3 81 3<br />
Note: a Negative value indicates that the impulse acted against the direction of progression<br />
of the sprinter; b negative value indicates flexion. 24 male and 4 female athletes were<br />
included in this analysis. **p < 0.01; ***p < 0.001<br />
nificantly, suggesting that fatigue was an unlikely cause of any of the other significant<br />
differences. The High Propulsion Trials had a significantly lower magnitude<br />
of relative braking impulse, but relative vertical impulse did not differ significantly.<br />
Of the hypotheses regarding maximization of propulsion, a greater mean<br />
hip joint extension velocity during stance was the only hypothesis that had statistical<br />
support.<br />
Discussion<br />
The GRF acting on a sprinter is obviously a major determinant of sprint running<br />
performance. However, as discussed in the introductory portion, there are numerous<br />
hypotheses regarding the relative importance of the various GRF components,<br />
and how they might be altered to achieve a better sprint performance. Many of<br />
these hypotheses were probably originally intended to be most applicable to the<br />
maximal-velocity phase of a sprint. We were interested, however, in their applicability<br />
to the acceleration phase. Furthermore, we chose to focus not on the magnitude<br />
of the GRF as such, but instead on GRF impulse.<br />
To investigate these hypotheses, we measured sprint velocity and GRF at<br />
the 16-m mark of a sprint. Sprint velocity at the 16-m mark is a product of sprint<br />
performance over that entire distance, whereas the GRF at the 16-m mark is that of<br />
a single stance phase. Nonetheless, the GRF at that mark is likely to be somewhat
40<br />
Table 3 Paired t-test Results for Assessment of Hypotheses Regarding<br />
Maximization of Propulsion<br />
Hunter, Marshall, and McNair<br />
High Propulsion Trials Low Propulsion Trials<br />
Mean SD Mean SD<br />
Sprint Velocity and <strong>Impulse</strong>s<br />
Sprint velocity (m/s) 8.15 0.47 8.12 0.45<br />
Relative vertical impulse (m/s) 1.01 0.11 1.00 0.14<br />
Relative braking impulse (m/s)* a –0.10 0.03 –0.11 0.03<br />
Relative propulsive impulse (m/s)***<br />
Hypotheses<br />
Mean hip joint extension velocity<br />
0.37 0.03 0.33 0.04<br />
during stance (deg/s)*<br />
Max. hip joint extension velocity<br />
570 61 558 58<br />
during stance (deg/s) 767 72 759 72<br />
Hip joint angle at takeoff (deg) 198 4 198 5<br />
Knee joint angle at takeoff (deg) 163 5 162 5<br />
Ankle joint angle at takeoff (deg) 116 5 116 6<br />
a Negative value indicates that the impulse acted against the sprinter’s direction of<br />
progression. 25 male and 3 female athletes were included in this analysis.<br />
*p < 0.05; ***p < 0.001<br />
representative of an athlete’s ability to apply GRF during at least some of the<br />
previous stance phases. The result of a strong relationship between relative horizontal<br />
impulse and sprint velocity supported this notion.<br />
The first purpose of this study was to determine the relationships between<br />
the relative impulses and sprint velocity during the acceleration phase of a sprint.<br />
To examine these relationships we used both simple and multiple linear regressions.<br />
The following paragraphs contain discussion on the relationships of relative<br />
propulsive, braking, and vertical impulses with sprint velocity.<br />
Both the simple and multiple regression results showed a relatively strong<br />
trend for faster athletes to produce greater magnitudes of relative propulsive impulse.<br />
This finding was expected because athletes with good acceleration ability<br />
would likely undergo larger increases in horizontal velocity during each stance<br />
phase. This finding is also in agreement with the research of Mero and Komi (1986),<br />
who reported a positive relationship between average resultant GRF during propulsion<br />
and sprint velocity between the 35-m and 45-m marks (r = 0.84, or r = 0.65<br />
when the resultant GRF was expressed relative to body weight).<br />
A simple linear regression did not support the existence of a relationship<br />
between sprint velocity and relative braking impulse. In contrast, the multiple linear<br />
regression showed a weak trend for faster athletes to produce lower magnitudes<br />
of relative braking impulse. These conflicting results, we believe, highlight a<br />
weakness in using simple linear regression alone to explore relationships among
GRF and Kinematics of Sprint Running 41<br />
variables. In the multiple linear regression, relative propulsive impulse suppressed<br />
irrelevant variance (Tabachnick & Fidell, 2001, pp. 148-149), thereby exposing<br />
the relationship between relative braking impulse and sprint velocity. The practical<br />
significance of this finding, however, is arguable.<br />
The hypothesis stating that braking should be minimized is reasonably popular<br />
with some researchers (Mero & Komi, 1986; Mero et al., 1992; Wood, 1987), and<br />
is based on the premise that a lower magnitude of braking would result in a smaller<br />
loss in horizontal velocity early in the stance phase. However, lack of evidence has<br />
led some researchers to advise caution. Putnam and Kozey (1989), for instance,<br />
warned that the braking force might be related to other important mechanical factors<br />
of performance. For example, the braking force could be involved in the storage<br />
of elastic energy (Cavagna, Komarek, & Mazzoleni, 1971). In summary,<br />
although we did find that relative braking impulse accounted for a small proportion<br />
(7%) of variance in sprint velocity, we do not know if the faster athletes actually<br />
minimized their magnitude of braking, and we cannot rule out that braking<br />
might also have some advantages. Further research is required to examine these<br />
issues.<br />
The relationship between relative vertical impulse and sprint velocity showed<br />
signs of nonlinearity. The fastest athletes tended to produce only moderate magnitudes<br />
of relative vertical impulse, about 1 m/s. We speculate that, during the acceleration<br />
phase of a sprint, the most favorable magnitude of relative vertical impulse<br />
is one that creates a flight time only just long enough for repositioning of the lower<br />
limbs. If the athlete can reposition the limbs quickly, then a lower relative vertical<br />
impulse is sufficient, and all other strength reserves should be applied horizontally.<br />
However, if an athlete cannot achieve or maintain a high step rate, such as<br />
when fatigued, then a greater relative vertical impulse becomes more important.<br />
This speculation differs somewhat from the view of Weyand et al. (2000),<br />
who proposed that a faster maximal velocity is achieved by applying a greater<br />
vertical GRF. We agree that faster sprinters have less time to apply the GRF, and<br />
therefore will require a greater force than usual. However, we believe that during<br />
the acceleration phase of a sprint, a large relative vertical impulse (i.e., notably<br />
greater than 1 m/s) will not be advantageous. Actually, a long flight time, determined<br />
by a large relative vertical impulse, may be a disadvantage. This would be<br />
due to a decrease in the percentage of time spent in contact with the ground. An<br />
athlete can only influence his or her sprint velocity when in contact with the ground.<br />
This topic remains an interesting area for future research.<br />
The second purpose of this study was to test the hypotheses regarding the<br />
techniques for minimizing braking and maximizing propulsion. With regard to the<br />
hypotheses stating how braking can be minimized, use of a high hip extension<br />
velocity and high knee flexion velocity at touchdown were not supported. In contrast,<br />
the use of a more active touchdown (i.e., smaller horizontal velocity of the<br />
foot before touchdown) and a smaller touchdown distance (larger leg angle at touchdown)<br />
were supported. An active touchdown and small touchdown distance have<br />
long been thought to play a role in determining the magnitude of braking. For<br />
example, Hay (1994) suggested, “the horizontal velocity of the foot is the sole<br />
determinant of whether there is a braking…effect” (p. 408). In contrast, Mero et<br />
al. (1992) suggested, “The primary reason for the decrease in running velocity is<br />
the horizontal distance between the first contact point and the centre of gravity of<br />
the body at touchdown” (p. 382).
42<br />
Hunter, Marshall, and McNair<br />
Possibly, the use of a more active touchdown is part of the cause of lower<br />
braking, and a smaller touchdown distance is a technique adjustment required to<br />
maintain balance. However, further research involving an intervention is required<br />
to test for causation. In addition, the possible effect that a decrease in braking<br />
might have on vertical impulse (see Table 2), and the consequences, should be<br />
examined.<br />
With regard to the hypotheses stating how propulsion can be maximized,<br />
extra extension of the stance limb at takeoff was not supported. However, the use<br />
of a greater hip extension velocity was partially supported (i.e., mean, but not<br />
maximum, hip extension velocity during stance was associated with greater propulsion).<br />
The notion that the hip extensor musculature is the main determinant of<br />
thigh kinematics during stance, and therefore the main determinant of propulsion,<br />
is popular with some researchers and many coaches. For example, Wiemann and<br />
Tidow (1995) stated, “the hamstrings in particular, together with a muscle rein<br />
consisting of gluteus maximus and adductor magnus, supply the energy needed for<br />
forward propulsion, by providing a high back-swing velocity of the support leg”<br />
(p. 47). However, even if the angular velocity of the stance thigh is important in<br />
producing propulsion, we feel that further research is required to see if the hip<br />
extensor musculature is the major determinant. Putnam (1991) showed that the<br />
kinematics of the swing-limb segments in running are determined by a combination<br />
of resultant joint moments and segment interactions. It is possible that the<br />
situation is similar for the stance limb. The possible indirect contribution of the<br />
swing limb to propulsion is also largely unknown.<br />
Before concluding, we must provide some cautionary notes regarding the<br />
results of this study. First, the results are not necessarily applicable to other phases<br />
of a sprint, for example the maximal-velocity phase. Second, we cannot predict<br />
with any confidence the relationships that might exist outside the caliber of athletes<br />
we tested. Third, we quantified components of the GRF. We emphasize that<br />
these components are of a single entity, the GRF, and therefore are interrelated. It<br />
is possible that a change in one component will result in a change in another component.<br />
Fourth, for all results in this paper, causation cannot automatically be assumed.<br />
In conclusion, relative propulsive impulse accounted for 57% of the variance<br />
in sprint velocity (greater magnitudes of relative propulsive impulse were<br />
associated with faster sprint velocities). Relative braking impulse accounted for<br />
only 7% of the variance in sprint velocity (lower magnitudes of relative braking<br />
impulse were associated with faster sprint velocities). It is likely that high magnitudes<br />
of horizontal propulsion are required to achieve high acceleration. However,<br />
the practical significance of the weak relationship between braking and sprint velocity<br />
is arguable. Furthermore, the possibility that braking might have some advantages<br />
(e.g., storage of elastic energy) could not be ruled out. The faster athletes<br />
tended to produce only moderate magnitudes of relative vertical impulse. We speculated<br />
that, during the acceleration phase, the most favorable magnitude of relative<br />
vertical impulse is one that creates a flight time just long enough to allow repositioning<br />
of the lower limbs; all other strength reserves should be directed horizontally.<br />
Further research is required to see if braking, propulsive, and vertical impulses<br />
can be modified with specific training. This would provide insight into how a<br />
change in one GRF component might affect the others, and ultimately how these<br />
changes affect sprint velocity.
GRF and Kinematics of Sprint Running 43<br />
References<br />
Cavagna, G., Komarek, L., & Mazzoleni, S. (1971). The mechanics of sprint running. Journal<br />
of Physiology, 217, 709-721.<br />
Cohen, J. (1977). Statistical power analysis for the behavioral sciences. New York: Academic<br />
Press.<br />
de Leva, P. (1996). Adjustments to Zatsiorsky-Seluyanov’s segment inertia parameters. Journal<br />
of Biomechanics, 29, 1223-1230.<br />
Hay, J.G. (1994). The biomechanics of sports techniques (4th ed.). London: Prentice Hall<br />
International.<br />
Hreljac, A., & Marshall, R. (2000). Algorithms to determine event timing during normal<br />
walking using kinematic data. Journal of Biomechanics, 33, 783-786.<br />
Hunter, J., Marshall, R., & McNair, P. (2004). Interaction of step length and step rate during<br />
sprint running. Medicine and Science in Sports and Exercise, 36, 261-271.<br />
Mann, R., & Sprague, P. (1983). Kinetics of sprinting. Track and Field Quarterly Review,<br />
83(2), 4-9.<br />
Mann, R.V., Kotmel, J., Herman, J., Johnson, B., & Schultz, C. (1984). Kinematic trends in<br />
elite sprinters. In J. Terauds et al. (Eds.), Proceedings of the International Symposium<br />
of Biomechanics in Sports (pp. 17-33). Del Mar, CA: Academic Publ.<br />
Mero, A., & Komi, P.V. (1986). <strong>Force</strong>-, EMG-, and elasticity-velocity relationships at<br />
submaximal, maximal and supramaximal running speeds in sprinters. European Journal<br />
of Applied Physiology, 55, 553-561.<br />
Mero, A., Komi, P.V., & Gregor, R.J. (1992). Biomechanics of sprint running. Sports Medicine,<br />
13, 376-392.<br />
Putnam, C.A. (1991). A segment interaction analysis of proximal-to-distal sequential segment<br />
motion patterns. Medicine and Science in Sports and Exercise, 23, 130-144.<br />
Putnam, C.A., & Kozey, J.W. (1989). Substantive issues in running. In C.L. Vaughan (Ed.),<br />
Biomechanics of sport (pp. 1-33). Boca Raton, FL: CRC Press.<br />
Tabachnick, B., & Fidell, L. (2001). Using multivariate statistics (4th ed.). Boston: Allyn &<br />
Bacon.<br />
Weyand, P., Sternlight, D., Bellizzi, M.J., & Wright, S. (2000). Faster top running speeds<br />
are achieved with greater ground forces not more rapid leg movements. Journal of<br />
Applied Physiology, 89, 1991-1999.<br />
Wiemann, K., & Tidow, G. (1995). Relative activity of hip and knee extensors in sprinting—Implications<br />
for training. New Studies in Athletics, 10(1), 29-49.<br />
Winter, D.A. (1990). Biomechanics and motor control of human movement. New York:<br />
Wiley & Sons.<br />
Wood, G. (1987). Biomechanical limitations to sprint running. In B. van Gheluwe & J. Atha<br />
(Eds.), Medicine and sport science (Vol. 25: Current Research in Sports Biomechanics,<br />
pp. 58-71). Basel: Karger.<br />
Acknowledgments<br />
Thanks to the late James G. Hay for his expert advice and encouragement. His presence<br />
is sorely missed. Thanks also to Rene Ferdinands for assisting with data collection.