Depreciation of Infrastructure Assets & Resource Allocation Decision ...
Depreciation of Infrastructure Assets & Resource Allocation Decision ...
Depreciation of Infrastructure Assets & Resource Allocation Decision ...

You also want an ePaper? Increase the reach of your titles
YUMPU automatically turns print PDFs into web optimized ePapers that Google loves.
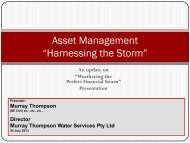
“DEPRECIATION OF<br />
INFRASTRUCTURE ASSETS”<br />
& <strong>Resource</strong> <strong>Allocation</strong> <strong>Decision</strong><br />
Making<br />
Dr John Sing<br />
Director – Corporate Services<br />
Noosa Council
OBJECTIVES<br />
General:<br />
To determine the purpose <strong>of</strong> accounting for<br />
the depreciation <strong>of</strong> IA’s
OBJECTIVES Cont<br />
Specific:<br />
1) Review fin. accounting requirements<br />
2) Consider the need to depreciate<br />
3) Develop a framework for IA depreciation<br />
4) Examine the ‘conflict/problem’ faced by<br />
accountants, engineers & asset managers<br />
5) Offer a solution to the conflict/problem
1) FIN. ACCOUNTING REQUIREMENTS<br />
External requirements<br />
IA Accounting<br />
Pol. & Proc.<br />
IA Accounting<br />
Information<br />
<strong>Resource</strong> providers<br />
Recipients <strong>of</strong> G&S<br />
O’sight/review gps<br />
Management<br />
Internal requirements
2) DEPRECIATION<br />
REQUIREMENT(S)<br />
Mandatory<br />
Aust Accounting standards<br />
Prescribe traditional methods<br />
– Systematic allocation <strong>of</strong> cost concept<br />
– Relies on:<br />
» estimating useful life & residual<br />
value <strong>of</strong> the IA<br />
Prescribe ‘backward looking focus’
MANDATORY REQUIREMENTS<br />
Issue<br />
Financial Accounting<br />
Requirement<br />
AAS4<br />
Method<br />
S/L, R/B, U/U, S/D<br />
Concept<br />
“<strong>Allocation</strong> <strong>of</strong> Cost”
IA’S S DEFINED<br />
According to supply & demand<br />
characteristics ie:<br />
– a) ‘composite asset’ where life extended by<br />
replacement <strong>of</strong> components and;<br />
– b) demand for the service makes it desirable<br />
Implies ‘maintenance’ <strong>of</strong> infrastructure to<br />
ensure service provision
ALTERNATIVE PURPOSE(S) FOR<br />
CHARGING DEPRECIATION<br />
Asset management<br />
Full cost pricing & recovery<br />
Therefore essential to determine:<br />
– The funding required to support<br />
renewal/reinstatement <strong>of</strong> any loss in service<br />
potential?
MANAGEMENT REQUIREMENTS<br />
Adopting a method that:<br />
Tracks more closely the pattern <strong>of</strong><br />
consumption<br />
Views depreciation as a ‘measure <strong>of</strong><br />
consumption’<br />
Is arguably more relevant and reliable for<br />
‘allocation decisions’<br />
Is ‘forward looking’
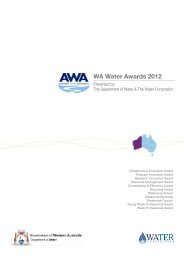
2001<br />
2012<br />
2013<br />
4,500<br />
4,000<br />
3,500<br />
3,000<br />
2,500<br />
2,000<br />
1,500<br />
1,000<br />
500<br />
0<br />
Estimated Renewals Expenditure<br />
2002<br />
2003<br />
2004<br />
2005<br />
2006<br />
2007<br />
2008<br />
2009<br />
2010<br />
2011<br />
$000’s<br />
Ren.<br />
Exp<br />
Annu<br />
1999<br />
2000
ALTERNATIVE APPROACH<br />
Function <strong>of</strong> advanced asset management program<br />
Based on life-cycle cost analysis<br />
Not just a ‘wish list’ for maintenance<br />
ie Produce an optimised list <strong>of</strong> renewal activities<br />
Subject to ‘engineering’ audit
3) IA DEPRECIATION<br />
FRAMEWORK<br />
PURPOSE<br />
Requirement Objective<br />
Full Cost Pricing<br />
Internal<br />
Asset Man.<br />
Consumption<br />
or loss in<br />
service pot.<br />
Cell 1<br />
#<br />
CONCEPT<br />
<strong>Allocation</strong> <strong>of</strong><br />
cost<br />
Cell 2<br />
External<br />
AAS4<br />
Cell 3 Cell 4<br />
#
4) CONFLICT/PROBLEM<br />
Fin. Accounting requires accounting for<br />
what has happened in the past<br />
Man. Accounting requires forecasting what<br />
is to happen in the future<br />
Therefore:<br />
Determining 2 ‘depreciation’ measures on<br />
the one IA
5) WHAT WE NEED<br />
A ‘tool’ that enables the 2 measures to be<br />
determined (easily)<br />
Use this tool as the basis for comparing<br />
backward measure with forward measure<br />
(ie.. S/L V Renewals annuity)<br />
The ability to objectively determine the<br />
amount <strong>of</strong> ‘depreciation’ to be<br />
funded/unfunded.
NSC Example<br />
“AIM 21” is a micros<strong>of</strong>t based application<br />
that provides Noosa Council with a unique<br />
solution for dealing with this conflict.
Overview<br />
“AIM 21” solution:<br />
Based on asset class and catchment basis<br />
Draws ‘engineering’ and ‘accounting’<br />
information together<br />
Produces a comparison <strong>of</strong> book deprn. with<br />
renewal annuity based concept<br />
Enables level <strong>of</strong> funding/unfunding <strong>of</strong> depn.<br />
to be objectively determined
Asset Enquiry – Graphical
Conclusion<br />
Given that:<br />
– depn. . means different things to different ‘economic<br />
decision makers’<br />
As accountants we need to be mindful <strong>of</strong> these<br />
differences<br />
Expected to produce relevant and reliable<br />
information<br />
Ultimate aim is to ensure IA’s are appropriately:-<br />
– Managed in an operational sense and;<br />
– Monitored in a financial sense.
Questions and further discussion
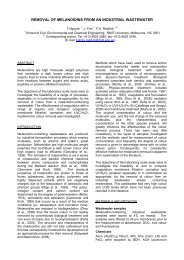
TTWSB Draft Financial Plan<br />
Inputs Sheet<br />
Na viga tion Pa ne l<br />
Go to Financial Plan<br />
Go to Graphs<br />
Go to CapX Program<br />
Go to Loans Schedule<br />
"Solve" Button<br />
Go to "Tax"<br />
Ca se Be ing Mode lle d<br />
Population Growth Medium 2 High = 1; Medium = 2; Low =3<br />
Consumption Growth Rate Medium 2 High = 1; Medium = 2; Low =3<br />
Globa l Inputs<br />
W a te r D e ma nd Inputs<br />
CPI (Indexation) CPI 2% Current Equivalent Population (EP) - Townsville T OW NSPOP 90,413<br />
Starting Year for Analysis YEAR 2000/01 Current Equivalent Population (EP) - Townsville 2000-05 2005-10 2010-15<br />
Weighted Average Cost <strong>of</strong> Capital WACC 9.0% T _LOW POP 1-4 0% 0% 0%<br />
Forecast Debt/Equity Ratio D ER AT IO 100% T _MED POP 1-4 1.5% 1.5% 1.5%<br />
Dividend Payout Ratio (Years 5 onward) DPR 65% T _HIGHPOP 1-4 3% 3% 3%<br />
Current Loan Balance LOANBAL $ 8,782,284<br />
Interest on Current Loans LOAN INT 6.40% Current Equivalent Population (EP) - Townsville T hPOP 50,000<br />
Current Loan Term (Years) T ERM 11 Current Equivalent Population (EP) - Townsville 2000-05 2005-10 2010-15<br />
Interest on NEW Loans N EWINT EREST 8.00% T h_LOWPOP 1-4 1% 1% 1%<br />
Loan Term (New Loans) N EW T ER M 20 T h_MEDPOP 1-4 2.5% 2.5% 2.5%<br />
Subsidy on New Works (DAM) SUBSID Y 1 50% T h_HIGH POP 1-4 3% 3% 3%<br />
Subsidy on New Works (OTHER) SUBSIDY 40%<br />
Subsidy on Replacement Works SUBSID YOLD 0%<br />
Interest on Cash and Investmants (Revenue) IN T ER EST REV 3% Assumed Consumptionm (L/EP/day) - Townsville 2000-05 2005-10 2010-15<br />
% <strong>Depreciation</strong> Funded DEPRECIAT ION 100% LOWGRO1-4 600 600 600<br />
Total Length <strong>of</strong> Mains (km) MAIN S - MED GR O 1-4 912 870 870<br />
Interest on surplus cash SURPLUS 3% H IGHGRO 1-4 1000 1000 1000<br />
Effective Tax Rate (1999-2000) T AX1 36%<br />
Effective Tax Rate (2000-01) T AX2 34% Assumed Consumptionm (L/EP/day) - Thuringowa 2000-05 2005-10 2010-15<br />
Effective Tax Rate (2001- ) T AX3 30% T hLOWGRO1-4 500 500 500<br />
T hMED GR O 1-4 588 625 625<br />
T hH IGHGRO 1-4 750 750 750<br />
Va ria ble Inputs 0 0 1<br />
Year Yr 2000 2001-05 2005-10<br />
Results<br />
Internal rate <strong>of</strong> return (20 years) 12.7%<br />
Forecast Growth in Charges NA 5.0% 0.0%<br />
Growth in Other Revenue (rentals etc) 0.0% 0.0% 2.0%<br />
Growth in Community Service Obligations NA 2.0% 2.0%<br />
10.39392 Growth in Expenses 5.6% 3.0% 3.0%