National Water Skills Audit - Australian Water Association
National Water Skills Audit - Australian Water Association
National Water Skills Audit - Australian Water Association
- No tags were found...

You also want an ePaper? Increase the reach of your titles
YUMPU automatically turns print PDFs into web optimized ePapers that Google loves.
Department of Environment, <strong>Water</strong>, Heritage and the Artsfor the Council of <strong>Australian</strong> Governments<strong>National</strong> <strong>Water</strong> <strong>Skills</strong> <strong>Audit</strong>June 2008
AcknowledgementsAs the principal facilitator of this collaborative effort, the International Centre of Excellence in <strong>Water</strong> ResourcesManagement (ICE WaRM) gratefully acknowledges the significant contributions of the two other Centres whocontributed much of the analysis and content of this report: the South <strong>Australian</strong> Centre for Economic Studies(SACES) who were responsible for the survey component, and the Centre for the Economics of Education andTraining (CEET) who undertook the secondary data analysis. The consent of the <strong>Water</strong> Services <strong>Association</strong> ofAustralia (WSAA) to use their 2007 survey data and analysis, and quote extensively from their findings, and thatof the <strong>Australian</strong> <strong>Water</strong> <strong>Association</strong> (AWA) to approaching their corporate members to participate in the surveyare also gratefully acknowledged.Although there was little time for consultation with them in this first phase activity, the response of the studyAdvisory and Reference Groups was much appreciated. Thanks are extended to the <strong>Australian</strong> Academy ofTechnological Sciences and Engineering (ATSE) and AWA for agreeing to host and chair those groups, and to theindividual members of them. A more consultative role is planned for Phase 2.Special thanks are extended to those organisations who responded to the survey, within very tight deadlines– only a few working days in many cases.Lastly, the support and encouragement of the Department of Environment, <strong>Water</strong>, Heritage and the Arts(DEWHA) and their committee colleagues, including specific acknowledgement of the constraints of the assignment,are gratefully acknowledged.iiICE WaRM • <strong>National</strong> <strong>Skills</strong> <strong>Audit</strong> (Phase One) Report
Table of ContentsAcknowledgementsiiTable of ContentsiiiGlossary of Terms and AbbreviationsivExecutive Summaryv1. Introduction 11.1 Background 11.2 Terms of Reference 21.3 Setting of This Study 21.4 Scope of the <strong>Water</strong> Sector 31.5 Structure of Report 32. Methodology 42.1 Definition of <strong>Water</strong> Sector 42.2 Desk Review 52.3 Survey Method 62.4 Analysis of ABS Data 83. Preliminary Findings 93.1 Desk Review 93.2 The ‘Urban’ <strong>Water</strong> Industry 173.3 Survey of the ‘Non-Urban’ <strong>Water</strong> Sector 243.4 Analysis of Secondary Sector Data 414. Analysis of Results 484.1 Combining the WSAA and Current Surveys 484.2 Aggregation of <strong>Audit</strong> Findings 514.3 Discussion 565. Outcomes/Issues 585.1 Current Needs and Gaps 585.2 Projected Needs and Gaps 595.3 Priority Gaps 615.4 <strong>Water</strong> Sector Issues for <strong>Skills</strong> Development 635.5 Using Commitments for <strong>Water</strong> Specific Places 645.6 Opportunities for Indigenous People 655.7 Engagement of the <strong>Water</strong> Industry and University Sector 655.8 Skilled Migrants 666. Next Steps 68ReferencesR1Appendix AA1Appendix BB1Appendix CC1ICE WaRM • <strong>National</strong> <strong>Skills</strong> <strong>Audit</strong> (Phase One) Reportiii
Glossary of Terms and AbbreviationsABSACERAIGANZSICANZSCOAQFATSEAWAB-HERTCEETCEOCMACOAGDEEWRDESTDEWHAFTEGSAIAIAAICE WaRMIWALGANCVERNILSNWCNWINRMRTOSACESSERAToRVETWENWICDWSAAWSG<strong>Australian</strong> Bureau of Statistics<strong>Australian</strong> Council for Educational Research<strong>Australian</strong> Industry Group<strong>Australian</strong> and New Zealand Standard Industrial Classification<strong>Australian</strong> and New Zealand Standard Classification of Occupations<strong>Australian</strong> Qualifications Framework<strong>Australian</strong> Academy of Technological Sciences and Engineering<strong>Australian</strong> <strong>Water</strong> <strong>Association</strong>Business and Higher Education Round TableCentre for the Economics of Education and TrainingChief Executive OfficerCatchment Management AuthorityCouncil of <strong>Australian</strong> GovernmentsDepartment of Education, Employment and Workplace RelationsDepartment of Education, Science and Training (now DEEWR)Department of the Environment, <strong>Water</strong>, Heritage and the ArtsFull-Time EquivalentGovernment <strong>Skills</strong> AustraliaIrrigation Australia (Previously IAA and ANCID)Irrigation <strong>Association</strong> of Australia (now IA)International Centre of Excellence in <strong>Water</strong> Resources ManagementInternational <strong>Water</strong> <strong>Association</strong>Local Government <strong>Association</strong><strong>National</strong> Centre for Vocational Education Research<strong>National</strong> Institute of Labour Studies, Flinders University<strong>National</strong> <strong>Water</strong> Commission<strong>National</strong> <strong>Water</strong> InitiativeNatural Resources ManagementRegistered Training OrganisationSouth <strong>Australian</strong> Centre for Economic StudiesSurveys of Employers who have Recently AdvertisedTerms of ReferenceVocational Education and Training<strong>Water</strong> Education Network (AWA)<strong>Water</strong> Industry Capacity Development<strong>Water</strong> Services <strong>Association</strong> of Australia<strong>Water</strong> Sub-Group (COAG)ivICE WaRM • <strong>National</strong> <strong>Skills</strong> <strong>Audit</strong> (Phase One) Report
Executive SummaryBackgroundThe Council of <strong>Australian</strong> Governments (COAG) has initiated a large programme of work todrive the water reform agenda. These 13 projects covering four priority areas are scheduledto report to COAG meetings on 3 July and 3 October 2008. One of these is the <strong>National</strong><strong>Water</strong> <strong>Skills</strong> <strong>Audit</strong> and Strategy, this project.The Commonwealth Department of Environment, <strong>Water</strong>, Heritage and the Arts (DEWHA)is responsible to COAG for oversight of the project. Implementation was assigned to ateam assembled and led by the International Centre of Excellence in <strong>Water</strong> ResourcesManagement (ICE WaRM), with external advisory and reference groups led by the<strong>Australian</strong> Academy of Technological Sciences and Engineering (ATSE) and the <strong>Australian</strong><strong>Water</strong> <strong>Association</strong> (AWA) respectively.ICE WaRM is an <strong>Australian</strong> Government initiative, established in 2004 to provide a nationalfocus and international gateway for <strong>Australian</strong> education, training and research in water.The ultimate aim of the two-phase project is to develop a national strategy to address skillsneeds and gaps in the water sector, for the COAG October 2008 meeting.The first phase of this assignment, the subject of this report, is the national water skillsaudit, undertaken over an active period of five weeks, for the COAG July meeting.MethodGiven the extremely short timeframe, the assignment was conducted in three parallelstreams of activity:• A desk review and collation of existing data and knowledge, including the March 2008<strong>Water</strong> Services <strong>Association</strong> of Australia (WSAA) An assessment of skills shortages in theurban water industry;• A targeted survey of a limited sample of water sector organisations, by South <strong>Australian</strong>Centre for Economic Studies (SACES);• Analysis of secondary data, notably 2006 Census data, by the Centre for the Economicsof Education and Training (CEET).The <strong>Water</strong>SectorThe results of these streams were then drawn together to provide a perspective of thenational water sector, to inform the strategy development.The water sector of 1990 would have been largely defined as dedicated organisationswholly within the public sector. Today, only the framework of those organisations remains;many have been corporatised, and a large part of their functions is now undertaken byorganisations wholly in the private sector, many of which are international. Those functionsare also changing, with new technologies and approaches for traditional services, andexpanding water-related skills areas such as natural resources management. Thus definingthe <strong>Australian</strong> water sector, even as a snapshot, is more difficult.The recent WSAA report provided an analysis of their membership – the major urbanutilities. This audit was designed to extend the limits of that work to a much wider sectorperspective, including non-WSAA water-related institutions and those private sectororganisations providing significant goods and services to the water sector.For the survey, the sector was principally defined by employer category, with crossreferencingof essential roles and responsibilities. The sample of organisations approachedwas firstly drawn from corporate members of the peak industry association (AWA),excluding WSAA members and supplemented by groups or segments of the sector notwell represented among AWA membership. The structure of employment categoriesfor this survey closely followed that used in the WSAA report, so that results could beaggregated.The representative population covered by both surveys was approximately 44,400.Extending this to an estimate of the total current size of the <strong>Australian</strong> water sector issomewhat speculative, given the ‘fuzzy’ and dynamic nature of its boundaries. However,ICE WaRM • <strong>National</strong> <strong>Skills</strong> <strong>Audit</strong> (Phase One) Report
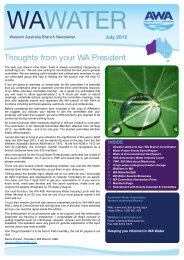
Executive Summary<strong>Skills</strong> Needsand GapsCurrentGapsFuture Gapstaking into account those segments unable to be sampled, anecdotal reports andsecondary data suggest total numbers around double this figure, or more than 80,000.The following results are presented with reference to the total population surveyed, boththe major urban utilities segment surveyed and reported by WSAA in March 2008, and thenon-WSAA segment covered by this May 2008 survey. Where possible, the results havebeen combined.Both surveys have used positions and typical qualifications related to those positionsas surrogate measures of skills. While there are acknowledged imperfections in thisapproach, this was considered the only practical means of achieving an acceptable resultin the time available. The full table of categories and their interpretation are in Appendix C.The total surveyed water sector of 44,400 includes currently unfilled vacancies of upto 5,000. Due to data inconsistencies, it is not possible to state with certainty in whichcategories of employees these vacancies occur. However, it may be inferred fromcompanion data sets that they are predominantly professional and paraprofessionalengineers (more than half), operators, trades and related workers.Half the current WSAA workforce and a quarter of the non-WSAA surveyed workforceare aged over 45, reflecting the different characteristics of the segments, and the relativeimpacts of sector reforms since the 1990s. Other notable differences include the higherproportion of business support functions in the WSAA sample, though this could beattributed to the apportionment of these functions in mixed sector businesses in the non-WSAA sample. Reported female participation figures and part-time worker figures acrossthe whole sector are extremely low.Each survey considered projections of workforce requirements over the next 10 years, to2017 and 2018 respectively, which are considered coincident within the accuracy of theestimates. They are the most realistic projections of current sector managers from theperspective of today. The situation now and 2018 projections are illustrated in Figure S.1Figure S1: Current and projected surveyed workforce requirements 2008 and 201860,00050,000Growth40,000VacanciesPositions tobe filledResignationsEmployees30,000Retirements20,00010,000WorkforceDepletedWorkkforce02008 2018viICE WaRM • <strong>National</strong> <strong>Skills</strong> <strong>Audit</strong> (Phase One) Report
Executive SummaryFor the WSAA segment, estimates of workforce growth were very modest, possiblyreflecting the long period of down-sizing and expectation of continued constraints. Themost significant issue in this group was the depletion in the current workforce due toretirements and resignations from staff leaving the sector altogether. The total 8,700 newstaff required by 2017 are identified across all categories, including 2,300 professionals andmanagers, 1,700 operators, 800 paraprofessionals and 800 trades and related workers.Growth in total workforce was the most significant factor in projected gaps in 2018 forthe non-WSAA segment surveyed, possibly anticipating that much of the works arisingfrom the announced $40 billion sector investments over the next eight to ten years will beundertaken by this group. Retirements and resignations out of the sector, though seriousin terms of impacts, were numerically less significant in the total 17,900 gap, which againcovered all categories. The highest demand in this sector segment will be for professionalengineers and scientists, totalling 7,100.Adding the results of both surveys gives an estimated total 2018 workforce of 54,900, only28,400 of whom will be people currently employed in the sector in 2008. The projected gapof 26,600 is attributable almost half (47 per cent) to growth, and about a quarter each toretirements and resignations out of the sector.It was considered useful to map these new workers to the matrix of employment categoryagainst the minimum requirement for that position within the <strong>Australian</strong> QualificationFramework. This data is presented in Table S.1, which shows that almost half the totalrequire a bachelor level or higher degree, predominantly for the categories of managers,professional engineers and scientists. Vocational level qualifications are required for theother half of the total, spread across three levels of certification.All these projections refer to the population represented by the surveys; the totals forthe whole <strong>Australian</strong> water sector are much higher. As above, extensions to this widerboundary must be speculative, and more so for future projections. Estimates indicate thenational sector workforce in 2018 may be up to 100,000, with a gap of more than 40,000 tobe filled by skilled new entrants. The skills requirements of this cohort are likely to be evenmore diverse than those detailed for the surveyed segment.Table S1: Projected Total Additional ‘<strong>Water</strong> Sector’ Employees Required by 2018<strong>Australian</strong>QualificationsFrameworkCert II Cert III Cert IV DiplomaAdvDiplomaAssociateDegreeVoc GradCertVoc GradDipBachelor Grad Cert Grad Dip Masters DoctorateManagers 1,605EngineerProfessionalsScience/TechnicalProfessionals6,1111,038EngineerParaprofessionalsScience/technologyParaprofessionals2,058314Trades and RelatedWorkers2,449Operators 3,379Business support 2,146 1,953Total 3,379 2,449 4,518 10,707ICE WaRM • <strong>National</strong> <strong>Skills</strong> <strong>Audit</strong> (Phase One) Reportvii
Executive SummaryIssues in Meeting<strong>Skills</strong> NeedsIssues affecting the whole economy, or many sectors of the economy, chronically or fromtime to time, serve as a backdrop to this discussion, and often apply more acutely to thewater sector than to other sectors. For example, the construction and mining sectors areaccustomed to wide fluctuations in demand, highly competitive market conditions, withfrequent boom-and-bust cycles. The water sector is comparatively stable, with wellsignalledvariation in demand for skills, and more vulnerable to shocks.The current shortage of skills in Australia generally has been described as market failure.This is partly because it takes a finite time to rebuild capacity, not only in the widereconomy or selected sectors, but firstly within the organisations that will provide therequired education and training. These institutions are presently under strain, and poorlyequipped to respond to any increases in demand.Major issues particularly affecting the water industry today, most previously reported andconfirmed by this analysis, include:• A sector workforce with historically high long-term stability, and corresponding lowlevels of mobility, and in overall decline over the last 10 – 15 years.• Very low levels of recruitment and training, both external and in-house, in key skillareas, notably in technical and managerial categories, over that period.• The impending retirement of a large cohort of skilled workers, leaving significant gapsin skills and experience, within their organisations and the whole sector.• Changing capability requirements to meet the emerging demands of climate change,environmental management, new technologies, and the multi-disciplinary nature ofsustainable water management.• Limited experience and capability to attract and retain new entrants.These are compounded by concurrent issues faced by the education and training sector.Those that are especially relevant to capabilities to service the needs of the water sectorinclude:• With institutional restructuring and the decline in demand from the water industry,closure of water-specific education and training programmes.• Resource constrained, and current low capacity to engage with the water sector,update existing materials, generate new courses relevant to emerging needs and deliverindustry-relevant education and training.Closing theGaps• Low levels of entrants and completions in general programmes relevant to the watersector, including sciences and engineering.It is tempting to view present needs as urgent, and solutions in a corresponding shorttermframework. Both the water sector and the education sector operate in long timeframes,with gestation periods of years and decades. Addressing skills needs acrossthese sectors requires a long-term perspective, balanced with the need for urgent action.There are significant current commitments to education and training places, and recentfurther commitments announced and clarified. These have been identified in the maintext of the report. Most are vocational, including the headline commitment by theCommonwealth Government to providing 450,000 new training places. The challenges,to be explored further in the second phase strategy development, will be to ensure thatappropriate places are allocated to the water sector, and that providers are well equippedto deliver.Entrant places are a less significant issue for the university sector, though numbers ofgraduates in key disciplines are well below demand. There are structural issues to beresolved, and collaborative teaching approaches to be rolled out to ensure broad availabilityand high teaching standards are sustained nationally for specialist sector-specificviiiICE WaRM • <strong>National</strong> <strong>Skills</strong> <strong>Audit</strong> (Phase One) Report
Executive Summarydemands. These and other concepts, including closer engagement between universitiesand industry, will be evaluated further.Particular opportunities for Indigenous people did not feature in the survey and analysis, butare commented upon in the main text. It is noted than there is a companion project beingprepared for COAG in parallel with this project, to address water supply and sanitation forIndigenous and remote communities.Similarly, the matter of skilled migration was not comprehensively addressed withinthe survey and analysis, though general data and comments are reported. While skillsshortages are also reported in the water sector internationally, it is clear that skilledmigration will require more detailed consideration in the development of strategies.This report, prepared for the July 2008 COAG meeting, is only for the first phase of atwo-phase assignment. It confirms the seriousness of skills shortages and gaps in the<strong>Australian</strong> water sector, with estimates of magnitude and composition. The second phasewill continue to develop issues raised in this analysis, and those not able to be well definedin the time available, to identify and evaluate strategies for addressing national water sectorskills. Wide consultation is planned, to ensure capture of current industry-based initiativesand leadership of outcomes. The strategy report will be presented to the October 2008COAG meeting.ICE WaRM • <strong>National</strong> <strong>Skills</strong> <strong>Audit</strong> (Phase One) Reportix
1. Introduction1.1 BackgroundAt its 21st meeting on 26 March 2008, the Council of<strong>Australian</strong> Governments (COAG) made a number ofimportant decisions regarding the management of waterresources in Australia. Amongst those was recognitionof the current and likely future constraints imposed byskills shortages and gaps in the <strong>Australian</strong> water sector.Accordingly, it was agreed to commission an audit ofexisting and projected national water sector skills, to bereported to the 22nd COAG meeting on 3 July 2008, anddevelop a strategy to address identified skills shortagesand gaps, to be reported to the 23rd COAG meeting on3 October 2008. This work is to be commissioned andreported through the COAG <strong>Water</strong> Sub Group (WSG)and subsidiary governance structures, in this casemanaged by the Department of the Environment, <strong>Water</strong>,Heritage and the Arts (DEWHA).Following an accelerated procurement process,including assessment of invited proposals by arepresentative steering committee, on 29 April DEWHAverbally advised <strong>Water</strong>Ed Australia Pty Ltd, tradingas the International Centre of Excellence in <strong>Water</strong>Resources Management (ICE WaRM) that they wouldbe commissioned to undertake the <strong>National</strong> <strong>Water</strong><strong>Skills</strong> <strong>Audit</strong> and Strategy. The Terms of Reference (ToR)in Appendix A formed the basis of the procurementprocess, and were subsequently amended by mutualagreement to reflect changes arising in this fast-trackedprocess. Notably, the time available for submission ofthe <strong>Audit</strong> Report was further shortened to allow broaderconsultation and review prior to its presentation to the22nd COAG meeting.The <strong>National</strong> <strong>Water</strong> <strong>Skills</strong> <strong>Audit</strong> and Strategy assignmentis being undertaken in two phases:• Phase 1 – An audit of skills needs and gaps focusingon both current needs and projected future needs. Theeffective time available to conduct the audit and compilea draft final report was approximately five weeks.• Phase 2 – Building on the audit, the development of anational strategy for addressing the skills shortages andgaps identified in the audit, including options to provideadditional water-related education and training. Thedraft final report for Phase 2 is scheduled for completionthree months later, by the end of August 2008.This <strong>Audit</strong> Report is the outcome of Phase 1.This initiative under the COAG agenda follows a numberof relevant activities highlighting the issue of skillsshortages in the <strong>Australian</strong> water sector, some of whichhave been underway for several years. Peak waterindustry organisations and others grouped under the<strong>Water</strong> Industry Capacity Development (WICD) initiativedetermined several priority activities, and commencedimplementation of them under self-funding andsubscription arrangements. One of these was a studyof skills shortages and gaps, which was subsequentlyundertaken by WSAA, covering the major urban waterutility segment only.The results of the WSAA study were presented to a<strong>National</strong> <strong>Water</strong> Industry <strong>Skills</strong> Forum convened jointlyby the <strong>National</strong> <strong>Water</strong> Commission (NWC), WSAAand the <strong>Australian</strong> <strong>Water</strong> <strong>Association</strong> (AWA), held inCanberra on 17 March 2008 and attended by ChiefExecutive Officers (CEOs) and senior representativesof the industry. Agreements reached at this forumincluded the formation of a <strong>Water</strong> Industry <strong>Skills</strong> TaskForce, and action on a number of priority matters whichwere considered essential ingredients of any strategy.The activities of the Task Force are consistent with thisCOAG initiative, and while proceeding to some extentin parallel, are expected to provide valuable inputs intothe second phase of strategy development under thisassignment.ICE WaRM is an <strong>Australian</strong> Government initiative by thethen Department of Education, Science and Training(DEST, now the Department of Education, Employmentand Workplace Relations, DEEWR) aimed to provide anational focus and international gateway to the best ofAustralia’s expertise in water resources managementeducation, training and research. ICE WaRM’smain founding shareholders are five universities,supplemented by a broad range of partners andsupporters across the education and training and watersectors. Since becoming fully operational in 2005, ICEWaRM has provided the focus for many collaborativeachievements in water management training, educationand research, and has been particularly active in nationalwater-related skills development.For this assignment ICE WaRM has assembled animplementation team of research and water industryspecialists to address the specific elements of theworks to be undertaken, including:• South <strong>Australian</strong> Centre of Economic Studies(SACES), a joint venture of the University of Adelaideand Flinders University, based at the University ofAdelaide.• Centre for the Economics of Education and Training(CEET), a joint venture of Monash University and the<strong>Australian</strong> Council for Educational Research (ACER),based at Monash University.In addition, two external groups were convened toprovide structured support to the implementation team:an Advisory Group, comprising senior representativesfrom interested parties across the sector and led by theAcademy of Technological Sciences and Engineering(ATSE), and a Reference Group of people directlyengaged in water sector skills issues and capacitydevelopment, led by the <strong>Australian</strong> <strong>Water</strong> <strong>Association</strong>(AWA). Composition of these groups is described inICE WaRM • <strong>National</strong> <strong>Skills</strong> <strong>Audit</strong> (Phase One) Report
1.2 Terms of ReferenceAppendix B. This attempt at an optimum combinationof a relatively small expert implementation team withexternal advisory and reference groups was basedon considerations of the extremely short timeframe,especially for the first phase activities, and ICE WaRM’ssignificant previous experience in collaborative activities.The Terms of Reference (ToR) are provided as AppendixA. An earlier version of these ToR formed the basis ofthe request for proposals, were somewhat qualifiedin the proposal and review process, and subsequentlyamended to accommodate timetable changes andrelated details. This section is a paraphrased summary ofthe final version, including agreed items of clarificationand amendments arising from the need to complete theassignment in a shortened timeframe.Phase 1:• The focus is on immediate skills needs and gaps inthe immediate (now and up to three years) and in themedium term (up to 10 years). Longer-term projections(beyond 10 years) were not addressed directly in thesurvey, initial consultation and analysis, though they maybe inferred or commented upon.• The needs of the wider water industry are considered,including urban and rural issues, the needs of theindustry and on-ground water managers, includingenvironmental water managers.• The water industry is defined to include government,majority-government-owned and private organisations.The needs for skills and competencies are addressedthrough primary data based on surrogate measures suchas position descriptions and related typical qualifications.• Opportunities to use current commitments toincrease water-specific places in tertiary and vocationaleducation are considered, as are opportunities forIndigenous people and use of skilled migrants.• Other issues of relevance to improving the skills basespecific to the water sector are considered.• The report should inform DEEWR identification ofpriority gaps in vocational training, potentially to informallocation of some 450,000 new apprenticeships to beallocated over the next four years.• Priority gaps in courses in the university sector, andways to promote closer engagement between theuniversities and the water sector are addressed.Phase 2:• Building on the audit, develop a national strategy foraddressing the needs and gaps identified in the auditincluding options to provide additional water-relatededucation and training.• Phase 2 ToR may be further refined in discussionsfollowing the audit phase, and will include extendedconsultation not feasible in the Phase 1 timeframe.1.3 Setting of This StudyThis <strong>Audit</strong> builds on previous research and reportsincluding those referred to in the TOR, particularly:• ICE WaRM 2005, Gaps in skills, training and educationin water management, a preliminary report.• WSAA 2008, An assessment of the skills shortages inthe urban water industry.ICE WaRM has been active in the area of waterindustry skills development since 2005. The ICE WaRMReport Gaps in <strong>Skills</strong> Training and Education in <strong>Water</strong>Management, for the NWC, was a catalyst for raisingthe attention of government and industry on this issue.Following this report, in January 2006, ICE WaRMbecame a founding member of the WICD initiativeSteering Committee and undertook the first investmentsto establish an industry ‘skills supermarket’ for educationand training providers and those seeking such services.ICE WaRM was an early supporter for the establishmentand continuing operations of the <strong>Water</strong> EducationNetwork (WEN) of the AWA, and has contributed activelyin most national events in the area of water industryskills.The WSAA work is very recent and covers the urbanwater segment of the water industry as part of this audit.This work included a survey of the WSAA members andthese members were not surveyed again. However,the May 2008 survey of other segments of the waterindustry did include alignment of questions to the WSAAsurvey such that meaningful results could be determinedfor the industry as a whole.Additional research providing input to this <strong>Audit</strong> includes:• <strong>Australian</strong> Council of Deans of Science (ACDS)2007, Sustaining science: university science in the 21stcentury.• <strong>Australian</strong> Council of Engineering Deans (ACED)2008a, Engineers for the future – addressing the supplyand quality of <strong>Australian</strong> engineering graduates for the21st century.• Government <strong>Skills</strong> Australia (GSA) 2008,Environmental scan.• Government <strong>Skills</strong> Australia (GSA) 2007a and 2007b,NWP07 <strong>Water</strong> training package Vol I and Vol II.• Murray A 2008b, Selling industry’s need to higherICE WaRM • <strong>National</strong> <strong>Skills</strong> <strong>Audit</strong> (Phase One) Report
education.• <strong>National</strong> <strong>Water</strong> Commission 2005,Institutionalarrangements in the <strong>Australian</strong> water sector –information paper.• <strong>National</strong> Centre for Vocational Education Research(NCVER) 2007a, A well-skilled future.• <strong>National</strong> Centre for Vocational Education Research(NCVER) 2007b, Matching supply of and demand forskills: international perspective.• <strong>National</strong> Centre for Vocational Education Research(NCVER) 2006, Future skill needs: projections &employers’ views.• <strong>Water</strong> Industry Capacity Development (WICD) 2007,Project 2: university courses, preliminary water industryinteraction with universities survey.For full details of all sources consulted in this audit, seereferences section.1.4 Scope of the <strong>Water</strong> SectorAny self-identifying industry sector has difficulties inclearly defining the boundaries of the sector. This isparticularly true for the water sector, which is very muchtrans-boundary and multi-disciplinary in nature. Theurban water supply and wastewater services segmentsrepresent the largest grouping of employees and areeasiest to define. Coincidentally this is the segmentmost clearly identified from ABS data, and was thesegment targeted by the March 2008 WSAA report.However, urban water-related services represents only asegment, variously estimated at between one-third andone-fifth of the total water sector population.It is necessary to define an approximate boundary ofthe sector for the purposes of this analysis, at least foridentifying a representative sample of the whole sectorto be covered by a new survey. This is discussed morefully in the following chapter. Suffice to note that thesector definition covers the range of responsibilities,from policy and regulation, through planning andmanagement functions, as well as capital works design,construction, operation and maintenance, across urbanand rural environments, for all types of consumptiveuses, including environmental aspects.1.5 Structure of ReportAn Executive Summary at the beginning of this reportprovides the key outcomes of the Phase 1 <strong>Audit</strong>.The methodology employed in the Phase 1 <strong>Audit</strong> isdiscussed in Chapter 2, which begins with a definitionof the water industry. The methodology was developedto ensure that, in the short timeframes available, areasonable understanding of skills across the varioussegments of the water industry would be gainedthrough a number of discrete approaches, includingcomposition of existing data, a new survey and analysisof secondary data.Chapter 3 presents the preliminary findings from theimplementation team work streams:• Desk research and analysis.• Reproduction of relevant WSAA survey and analysisresults.• Industry survey (excluding WSAA members).• Secondary analysis of data from Census 2006 by joband occupation profiles.Chapter 4 commences with an analysis of the findingsof all elements of Chapter 3, providing an aggregatedindustry view and then determines results for the sectorand key findings.In Chapter 5, the specific items of the ToR are addressedwith the presentation of outcomes, directions, issuesand learnings.Chapter 6 provides suggestions for the next stepsrequired to ensure that positive actions proceed towardsclosing the identified gaps in required skills.The sector definition also covers the range oforganisations which have water-related employees,in the public sector, wholly or majority governmentownedcorporatised entities, private sector and relatedstructures such as cooperatives and non-governmentorganisations.These organisations may provide goodsand services to the water industry, either primarily orsignificantly from time to time, and may cover a rangeof sizes of entities and a range of geographic spread ofactivities.ICE WaRM • <strong>National</strong> <strong>Skills</strong> <strong>Audit</strong> (Phase One) Report
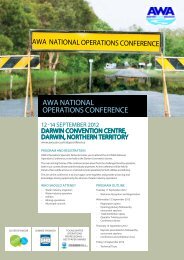
2 MethodologyThe methodology for this Stage 1 <strong>Skills</strong> <strong>Audit</strong> wasdesigned and implemented to achieve an industrywide view, within a limited timeframe and build onrecent work addressing skills requirements in the waterindustry. To provide an industry wide view required thatthe industry be first defined and the definition appliedis one which covers the private and public industrysegments and identifies the functions which are carriedout in the industry.Four parallel streams of work were initially undertakento provide a preliminary view of skills requirements andissues:• Research and analysis by ICE WaRM specialists.• Reflection of the WSAA survey and results.• Industry survey (excluding WSAA members) bySACES.• Secondary analysis from Census 2006 data by CEET.The results of these streams of work were thenanalysed, providing an aggregated industry view andkey findings. This aggregated industry view enabledthe determination of outcomes, directions, issuesand learnings, which led to the suggested next stepsfor closing the gaps in skills required for the waterindustry. The methodology of each of the four streams isdiscussed in the sections following the definition of thewater industry.2.1 Definition of the <strong>Water</strong> SectorFor many decades up to the 1990s, it would have beenrelatively easy to define the <strong>Australian</strong> water sector. Itwas characterised by large utilities, departments andcommissions wholly within the public sector, fulfilling allthe key roles and responsibilities of water management,from policy, planning and regulation through to design,construction, operation and management of allwater-related infrastructure. In some cases in-housecapabilities even extended to custom manufacturing,though most made use of external consultants,construction contractors and equipment suppliers,especially for major capital works programmes.Following tentative steps towards alternativebusiness models, the 1994 COAG reforms signalledmajor restructuring of all water sector institutions.Responsibilities for policy and regulation were separatedfrom operations, and operating entities were significantlyrestructured, downsized, corporatised (followingcorporate enterprise structures and operations, thoughretaining ownership by government) and some privatised(including cooperative and related structures). Manyfunctions were outsourced to the private sector,including operations and management of waterinfrastructure, though in most cases the ownershipof major assets was retained by the public sector andcorporatised entities. Adding to the complexity wasthat the COAG reforms were interpreted differently ineach jurisdiction, resulting in the application of differentinstitutional models across the nation. The private sectorparticipants have also continued to evolve, and manyhave significant international interests.Figure 2.1: The water sector in Australia<strong>National</strong>/International ‘Boundary’ConsultantsIrrigatorsFarmersPrivate WS & WWOperatorsConstructionContractorsPublic Sector/Private Sector ‘Boundary’Bulk<strong>Water</strong>Suppliers<strong>Water</strong>Re-UsePublicHealthUrban WS &WW ServicesPlanningPolicyRegulationNRMEnviron.Cl. ChangePrimaryIndustryManufacturersSuppliers and AgentsEnvironmentalServicesICE WaRM • <strong>National</strong> <strong>Skills</strong> <strong>Audit</strong> (Phase One) Report
The <strong>Australian</strong> water sector of 2008 is therefore moredifficult to define. An approximate mapping of the majorsegments is illustrated in Figure 2.1. It shows the centralfunctions retained in the public sector (here definedto include majority government-owned corporatisedentities, and including all three levels of government)though the boundary between the public and privatesectors is less distinct. The surrounding private sectorentities comprise a range of functions, here simplifiedinto categories such as consultants, contractors,manufacturers and suppliers. The external nationalboundary of the water sector is also porous, withmany international connections and developments (theexport of <strong>Australian</strong> water-related goods and servicesis an important segment of the industry). In additionto fuzzy boundaries, there is significant overlap offunctions between participants, and the scope of theirinvolvement in the water sector may vary significantlyover time.It is acknowledged that this is a hybrid illustration offunctions and institution types. For the purposes of thisassignment, and the definition of skills requirements,it was considered valuable to attempt to define thenational water sector as a matrix of both institutiontypes and principal sector functions. This matrixapproach proved too complex to be useful to theanalysis, but separate lists of both characteristics wereemployed.The types of organisations involved in the water industryinclude:• <strong>Water</strong> Utilities (water supply, wastewater and re-use)• Public (including majority Government-ownedorganisations) – Commonwealth, State and Local/Regional• Private Sector – Consultant• Private Sector - Contractor/Constructor• Private Sector - Manufacturer/Distributor• Education and Research.The functions carried out by organisations involved inthe water industry include:• Develop and administer Policies and Regulations• Planning• Supply• Treatment• Distribution• Sewerage• Management• Engineering and Design• Construction• Manufacturing• Operation, including water supply, treatment,distribution and wastewater• Asset Management and Maintenance• Environmental Management• Monitoring• Education• Research.The definition of organisation by type was the mostuseful for survey sampling; it was consistent with themethodology used in previous similar surveys, and ableto be cross-referenced with secondary data such asavailable from the <strong>Australian</strong> Bureau of Statistics (ABS).The range of skills and competencies required for thefunctions vary greatly and span trades, certificates,diploma and degree qualifications. The translation offunctions into required skills and competencies is avery detailed task, one which is covered well for theVocational Education and Training (VET) sector in GSA’s2008 NWP07 <strong>Water</strong> Training Package. The universitysector clearly provides degree courses aligned tospecific functions, such as engineering and sciences.However, there is a need to determine what types oftraining and accredited qualifications (certificate, diplomaor degree) are applicable to the required functionsand the survey addresses this via surrogate measuresof job roles and descriptions, covering professional,paraprofessional, trade and business roles, and thequalifications typically associated with those roles, asdescribed in Appendix C.2.2 Desk ReviewWith the current climate of reform of both thewater and education industries, a rare opportunity isprovided to ensure that budgetary, policy and strategiccommitments made towards up-skilling the workforceare well-placed, cost-effective and appropriate. In suchan undertaking, it is vital to consider the full range ofavailable evidence on the skills shortages experiencedby the water industry. As there has been relativelylittle rigorous research conducted, anecdotal evidenceis reviewed in this report as well as previous researchfindings and data collected from this audit. In this way,survey data from small, but representative, studiescan be supported and supplemented by the views ofindustry experts, ensuring that a reliable picture canbe presented of the current situation and potentialsolutions.ICE WaRM • <strong>National</strong> <strong>Skills</strong> <strong>Audit</strong> (Phase One) Report
This section consists of desktop research/literaturereview of the following areas:• <strong>Water</strong> industry-specific (including ACDS (2007), ACED(2008a and 2008b), ANTA (2005), Commonwealth ofAustralia (2008a), GSA (2008, 2007a, 2007b), Hopkins(2008), ICE WaRM (2005), Murray (2008a, 2008b), NSWDept of Education and Training (2007), NWC (2005),OPCET (n.d.), <strong>Water</strong> Industry <strong>Skills</strong> Taskforce (2008) andWSAA (2008))• Education (including ACDS (2007), ANTA (2004a,2004b, 2004c, 2003), Commonwealth of Australia(2007), DEEWR (2008a, 2008b, 2008c, 2008d, 2008e,2008f), DEST (2006, 2005), ISC (2008) and NCVER(2007a, 2007b, 2006)).Results from this literature review are presented inSection 3.1.2.3 Survey MethodA survey of water-related skills availability andrequirements, and projections, was carried out by WSAAearly in 2008 and the results published as OccasionalPaper No. 21 in March 2008, entitled An assessment ofskills shortages in the urban water industry. The surveyand analysis was undertaken by Infohrm Pty Ltd. Aspart of the skills audit of the water sector, SACES wascommissioned to carry out a survey of water-relatedorganisations that were not members of WSAA tosupplement the existing analysis.The survey was undertaken under extremely limitedtimeframes, with only 19 working days available fromSACES being commissioned to undertake the work andthe delivery date for the final results of the analysis. Thetimeframes under which the survey was undertakenprecluded a number of preparatory steps which wouldbe regarded as good practice including piloting thesurvey instrument with a small number of respondentsto ensure that it was worded in a manner which elicitedconsistent responses. This may reduce the reliabilityof the survey to the extent that groups of respondentsinterpreted questions differently. Due to the timeframes,respondents only had one week in which to respondwhich had a significant, negative impact on theresponse rate.Steps taken to ameliorate some of these timeframerelated risks included:• Drawing on the WSAA research for descriptions ofoccupation roles which had been tested with the watersector.• Ensuring that a preliminary email was sent out by theAWA to their corporate membership alerting them tothe forthcoming survey.• Undertaking up to three follow-up calls to each listedindividual contact in the sample frame to ensure that thesurvey had been received, that the listed contact wasthe most appropriate recipient, and to encourage themto participate in the survey.• Having the survey sent to AWA corporate membersby the AWA itself accompanied by a note encouragingtheir participation.The <strong>Australian</strong> <strong>Water</strong> <strong>Association</strong> is gratefullyacknowledged for providing access to their corporatemembership list and for the significant assistance theyprovided in undertaking the survey.Also, the assistance of WSAA is gratefullyacknowledged for granting permission to draw on theirexisting work in developing the survey instrument, andto quote extensively from their analysis. Section 3.2provides a detailed summary of these results, withemphasis on parts of the survey used in developing abroader industry view in this audit.Sample FrameThe aim of the survey was to capture features of thewater sector outside of the major urban water utilities(which are members of WSAA) as was reasonablypracticable, hence the survey was not sent to membersof WSAA in order to avoid duplication of results. Existingsample frames were used, due to the time constraintsunder which the survey was undertaken. In order togather information which would encompass as much ofthe water sector as possible the survey was sent to thefollowing organisations:• All members of the AWA in the membershipcategories platinum, gold and silver (corporate ratherthan individual members), having first excluded thoseAWA members which were also members of the WSAA,or which were local governments (surveyed separately).The final sample included 303 AWA corporate members.• A list of 62 Catchment Management Authorities(CMAs) and Natural Resource Management (NRM)organisations.• A randomly selected sample of local governmentauthorities (LGAs) in each state, with 15 being selectedin each of Victoria, South Australia, Western Australia,Tasmania, and the Northern Territory, and 30 eachselected in New South Wales and Queensland (roughlyreflecting the relative number of LGAs in each state).Survey InstrumentThere were nine questions in the survey. In the firstsection, the respondent was asked to provide thecompany’s name, type of organisation, number ofICE WaRM • <strong>National</strong> <strong>Skills</strong> <strong>Audit</strong> (Phase One) Report
employees, and the percentage of these employeesworking specifically in water. An accompanyingspreadsheet listed occupations for the respondent toprovide numbers of each type of employee and tell uswhether the employees are part-time or full-time. Theoccupation lists and job families were based on boththe ABS’ six-digit <strong>Australian</strong> and New Zealand StandardClassification of Occupations (ANZSCO) classification,and with some minor modifications of some job titleswhere appropriate or necessary, in order to provide abetter fit to the job titles used in the water industry.These results are presented in Section 3.3.Respondents were then asked questions aboutthe sources of recently acquired staff, and whatqualifications and/or experience they require whenrecruiting the various kinds of employees. They werealso asked which types of employees they had the mostdifficulty in recruiting and retaining.The second section of the survey asked respondentsto record their current employment, their current levelsof vacancies, the number of current staff aged over45 and their projected employment in 2018 for theirwater sector-related operations. These employmentdata were recorded against occupations identified asbeing important for the water sector. These occupationswere based on the ABS’ six-digit ANSZCO occupationalclassification structure, but modified based on thesurvey instrument developed by Infohrm for the WSAAsurvey and through consultations with the project’ssteering group. For each occupation a list of samplejob titles was also provided to assist respondents inclassifying their staff to an occupation; again these weredeveloped through a combination of the ABS’ ANZSCOstructure, the instrument developed by Infohrm forthe WSAA survey and through consultations with theproject’s steering group.It is acknowledged that there are some inconsistenciesand inaccuracies in this classification structure. Forexample, the categories of engineering professionalsand paraprofessionals do not correspond well withthe three-level “team” recognised by EngineersAustralia, and used extensively overseas. EngineersAustralia distinguishes between Professional Engineerswith minimum entrance qualifications of a four-yeardegree, and Engineering Technologists with entrancequalifications of a three-year bachelor degree. Both fitwithin the ‘Engineer - Professionals’ category in thisclassification. The entrance qualification for their thirdtier of Engineering Officers is a two-year AssociateDegree or VET Advanced Diploma, correspondingto the ‘Engineer – Paraprofessionals’ category here.Notwithstanding these imperfections it was necessaryto have consistency between survey data sets to enabletheir aggregation, so for this survey it was decided tomaintain basically the same structure as was used forthe WSAA survey.Calculating Population EstimatesIn order to provide an analysis of the overall sector,the survey responses were ‘grossed-up’ to provide anapproximate population estimate for the total sampleframe. This was undertaken only for the occupationestimates, with analysis of responses to the qualitativequestions being undertaken based on the responsesactually received. It is important to note that anysuch population estimate can only relate to thoseorganisations from which the sample was selected(the sample frame). As such no comment is madeabout those sections of the water sector (however itis defined) which fall outside of the contact databasesused.As it was believed that the sample frame covereda heterodox set of organisations, and as both thesample frame and the expected number of responseswere both expected to be low, it was decided that astratified sample was the most appropriate approachto calculating a population estimate. In calculating apopulation estimate from a stratified sample it wasassumed that the responses received within a stratumare representative of the strata as a whole. Thepopulation estimate was then calculated by dividing thetotal employment for the respondents in a strata by theresponse rate. For example, if the total employment ofcivil engineers by the respondents within a stratum was100, and the responses represented 50 per cent of theorganisations in the strata, then the population estimatefor the strata is calculated by dividing 100 by 0.5, giving apopulation estimate of 200.For AWA corporate members, membership categorywas used as a proxy for relative size, with the samplebeing split between one group of members in ‘platinum’or ‘gold’ membership categories and the secondgroup, those in ‘silver’ membership category. Due tothe very different nature of firms’ operations, the AWAmembership list was also stratified on the basis ofindustry, with the categories available being:• Consultant• Contractor/Constructor• Manufacturer/Distributor• Education and Research• Public – State• Public – Local and Regional• Public – Commonwealth.The AWA database included industry information forslightly under half of the sample. Other organisationswere assigned to an industry manually, based on thedescription of their organisation in AWA (2008), TheICE WaRM • <strong>National</strong> <strong>Skills</strong> <strong>Audit</strong> (Phase One) Report
<strong>Australian</strong> <strong>Water</strong> Directory. This manual coding obviouslycreates the possibility of incorrect classification eitherthrough entry error, or incorrect choice of industry by theresearcher.This stratification meant that the AWA membershipwere grouped into 14 strata. In practice, because of thelow response rates, only the industries: ‘Consultant’;‘Contractor/Constructor’ and ‘Manufacturer/Distributor’included sufficient responses to allow grossing-up givingsix strata in the final analysis. The few responses whichdid not fit into these strata were included in the finalcounts as raw numbers.CMAs and NRMs were treated as one stratum for thepurposes of analysis.Local governments were stratified based on state andwithin state, based on whether they were located in thecapital city or not (except in the case of Queensland,where Brisbane City Council was out of scope as amember of WSAA, so Queensland was treated as onestratum). As it was anticipated that the response ratefrom councils would be low (as most of the contactswere generic rather than being specific individuals)the grossing-up process within each local governmentstratum was based on the population of the councilswhich responded as a share of the total residentpopulation of councils in that stratum. For example,if there were 500,000 rural and regional residents ofa state, and responses were received from councilscovering a population of 200,000 persons, then thepopulation estimate for that stratum would be calculatedby dividing the total occupation estimates for theresponding councils by 0.4.industry. The second task was to provide a demographicand skills profile for each key occupation.In the <strong>Australian</strong> and New Zealand Standard IndustryClassification (ANZSIC) the economic activities of thewater industry are generally included in the followingtwo industry classes:• <strong>Water</strong> Supply (ANZSIC code 2811)• Sewerage and Drainage Services (ANZSIC code2812).However, there is a range of business activity in industryclasses that may not be predominantly related to waterbut nevertheless may be a critical input to the waterindustry. Industry classes are assessed to determinewhich one(s) would be most relevant and should beincluded. For example, a likely candidate is:• Other Heavy and Civil Engineering Construction(ANZSIC Code 3109).For the industry classes identified above, an analysisusing data from 2006 Census of Population and Housingis used to:• Determine occupational distribution of the workforce.• Identify key occupations.• Provide a demographic profile of the key occupations.As no survey returns were received from localgovernments in Tasmania, South Australia, WesternAustralia and the Northern Territory, and only oneresponse was received from Victoria the populationestimates do not include any employment in localgovernment for these states. The Victorian data wasentered into the final calculation in raw (non-grossed-up)form.No responses were received from private sectoranalytical laboratories, or from irrigation operators, soemployment in those organisations is also not includedin these estimates.2.4 Analysis of ABS DataA secondary data analysis was undertaken to providea profile of the workforce employed in the nationalwater industry in Australia in terms of its occupationalstructure.The first task in the methodology was to identify keyoccupations in the segments that make up the waterICE WaRM • <strong>National</strong> <strong>Skills</strong> <strong>Audit</strong> (Phase One) Report
3 Preliminary Findings3.1 Desk ReviewThe water industry has experienced major industrial,regulatory and business reform since the early 1990swhich, coupled with reduced spending, have hadsignificant impact on the operations, managementand employee structure of water organisations andusers, and on the capabilities and expertise required.In particular, the in-house training and sponsorship ofexternal training traditionally provided by the publicsector have been significantly reduced. This has reducedavailable education and training opportunities to only twotiers – vocational and universities.As in many sectors, the workforce is ageing in the waterindustry, particularly in those organisations that emergedfrom the former water authorities, commissions anddepartments. There is competition for skilled workersacross the economy and, until recently, fewer newentrants in technical vocations and professions.The combination of all of these factors has led to a risein demand for capabilities in the water sector at thesame time as a large cohort of workers prepare to retire,with few trained and experienced people from the nextgeneration to replace them. This has resulted in thedevelopment of current and projected future shortagesand gaps in skills and capabilities available to the watersector, in a period of increasing scrutiny at all levels ofgovernment and the community. <strong>Skills</strong> shortages in anyindustry are an important issue that is considered by theReserve Bank to be a factor that can contribute to higherinflation and interest rates.Two key issues found in a preliminary investigationconducted by ICE WaRM in 2005 were that there aresome key skills gaps due to the retirement of a cohortof workers with skills that have not been replacedthrough the education and training programmesof Universities and TAFE; and that there is a widerange of new capabilities required due to a changedenvironment which often require training across abroad mix of disciplines. Broader issues that impactedthe water sector were also highlighted – the overallshortages of technical skills in the <strong>Australian</strong> economy,the strong competition for human resources withinthe infrastructure/ utilities segments in particular andan extended period of low investment in curriculumdevelopment.The recent study on the urban water industry conductedby WSAA in 2008 reinforced these matters and isdiscussed in more detail in Section 3.2.The recent CEO Forum identified some key issuesincluding:1. Schools and vocational training (For example,strengthening maths and science teaching, raising theprofile of the water industry, and increasing the numberof training places).2. Universities (articulating industry needs moreeffectively through greater engagement withuniversities, increasing the demand for and number ofengineering places).3. Attracting people to the industry (through measuressuch as more effective employment branding of thewater sector, increasing the numbers of studentschoosing maths and science).4. Retaining people in the industry (through moreflexible management, human resource practices, lifelongtraining and greater ease of movement within theindustry).International PerspectivesFrom the international perspective of other OECDcountries, Australia’s performance has not maintainedits position in the rankings for a country with arelatively high GDP, despite ongoing reforms to theeducation sector over the past decade. According tothe 2007 OECD report Education at a glance the mainshortcomings are:• Australia has a per capita GDP of 8.2 per cent abovethe average of other OECD countries – all educationfunding indicators should be of similar proportions, allthings being equal.• Average OECD expenditure in education overall (alleducation, public and private expenditure) in terms ofa proportion or a percentage of GDP is 5.7 per cent– Australia spends 5.9 per cent.• Average OECD public expenditure in education isabout five per cent, while Australia’s public contributionis only 4.3 per cent of GDP, putting it in 22nd place of allOECD respondents.• In the year covered by the report, the OECD averageexpenditure on tertiary education increased by 49 percent. In contrast, Australia’s public investment declinedby four per cent and was the only country with anydecline.• Australia’s public investment in early childhoodeducation is one-fifth of the OECD average; in primaryand secondary schools, Australia is the third lowest.• Qualifications – Australia has a higher rate of 25–64year olds with degree or diploma qualifications at 31per cent, compared with 23 per cent average in OECDcountries. However, there is also a higher rate (35 percent, compared with 29 per cent in the OECD) of 25–64year olds with no education above lower secondaryschooling.• Distribution of education – Australia is very well-ICE WaRM • <strong>National</strong> <strong>Skills</strong> <strong>Audit</strong> (Phase One) Report
educated at the top levels, but less so in lower levelscompared with most OECD countries.• The average for OECD countries in numbers of yearsenrolled in education is 13 years, while Australia is 12years.• Comparative participation in education of 15-19year olds is not increasing as rapidly as in other OECDcountries.• Average duration of tertiary education at diploma anddegree levels is shorter at 2.87 years compared with 4.5for other OECD countries.• Higher rate of drop-out of tertiary studies at 33 percent compared with 29 per cent for all OECD countries.• 69.1 per cent of girls expect to complete a tertiaryeducation at degree or diploma level, compared with56.6 per cent of boys.• Proportion of graduates who qualify in mathematicsor IT is above average for OECD countries, whileengineering qualifications are below.• Average tertiary educated female earns about 61 percent of the average tertiary educated male.Vocational EducationEducation and training providers have experiencedtheir own waves of reform since the 1980s which hasreduced their resource base per student, and madethem reluctant to retain and develop courses forsmall, specialised markets of uncertain demand. Inthe early 1990s, a reform of the VET sector was begunby the Commonwealth Government which aimed forthe VET sector to become industry-led, competencybased,cost-effective and have nationally recognisedqualifications and occupational standards as well asnational transferability of licences. This reform agendawas launched in recognition of the fact that industries’needs were not being met.In 2005, a range of national industry skills councilswere created, to replace the <strong>Australian</strong> <strong>National</strong> TrainingAuthority (ANTA), including GSA which covers thewater industry. One major role of GSA was to developnational standards for water industry skills as well as toencourage a competitive, cost-effective training marketfor delivery of those skills. GSA managed the review ofthe training package which contains a comprehensiveaccount of competencies required for inclusion intraining programmes for the water industry, with theNWP07 <strong>Water</strong> Training Package finally approved in 2007.GSA is currently developing training resource materialsto support the training package, funded by NWC.GSA hosts <strong>National</strong> Industry Career Service – a DEEWRinitiative – which recognises there have been greatinadequacies in the quality and attractiveness of careersadvice in vocational occupations such as water. This is anational network of regional industry careers advisers,which promotes employment in the water industryespecially at regional level. The <strong>Water</strong> Training Packagenow has a Certificate I in <strong>Water</strong> Sustainability designedto make the water industry more attractive to studentsfrom primary school through to senior school.GSA is developing a Certificate II in CommunityEssential Services which targets water (and power)operators in Indigenous communities. These aregenerally local community members, employed by theCommunity Council but trained by the relevant state/territory department for water.During 2006–07 a series of reports, commissionedby NCVER, was produced by the <strong>National</strong> Instituteof Labour Studies (NILS) and the Centre for PostcompulsoryEducation and Lifelong Learning. Titled Awell skilled future, the studies aimed to explore therelationship between the VET sector and Australia’sfuture skills needs.Key findings included:• Insufficient employment incentives to training,incomplete schooling and training provider weaknessesare some barriers to VET participation that need to beovercome to achieve A well-skilled future.• In addition to VET sector reform, A well-skilledfuture also requires improved schooling and strongercommitments to training by the employer to provideskills development in the workplace.• Job qualifications or earnings do not make goodproxies for skills requirements for particular jobsbecause people without ‘relevant’ qualifications mayhave learned the skill set required for a particular job“While greater local interaction betweenindustry and VET will improve understanding ofthe market, at the national and state levels policymakers must learn to live with uncertainty.”NCVER 2007a, p.6and, conversely, people with a qualification do notalways use the qualification in their jobs. It is thereforevery difficult to adequately quantify skills requirementsand, although market understanding is likely to improvewith increased interactions of VET with industry, stateand national policy makers need to become accustomedto this uncertainty.• Focus should therefore be on areas where marketsdo not work well, skills that take a long time to train, orskills shortages that are likely to cause ‘bottlenecks’.10 ICE WaRM • <strong>National</strong> <strong>Skills</strong> <strong>Audit</strong> (Phase One) Report
• Demand for motor skills is projected to fall, whiledemand for cognitive and interactive skills is projected togrow.• As the workforce ages and becomes moreexperienced and qualified, the supply of vocational skillswill increase in availability, particularly in white-collarskills.• Where jobs are becoming more casual withless training, formal VET training is likely to grow inimportance.• As jobs become increasingly complex, workers arerequired to move up the hierarchy of cognitive andinteractive skills – a ‘skill deepening’ process.• VET should therefore re-focus on middle and higherlevel skills training but continue to supply lower-leveltraining to those who are disadvantaged and/or havefollowed unconventional life paths.• Training packages and curriculum design need tofocus on worker functions within the cognitive andinteractive skill sets to accommodate this projectedincrease in demand.• By employing market-based training models andcommunity partnerships, VET can respond to evolvingtraining requirements, thereby multiplying industry links,creating more employment incentives to training andretaining a focus on individual needs.Tertiary EducationFirstly, since the 1980s, a number of studies haveidentified that there have been declining universityenrolments in both science and engineering. Althoughchanges in the way courses are defined and enrolmentscounted make it difficult to quantify with precision, astudy by ACDS in 2007 identified that there had beena decline of between 5-30 per cent in some enablingsciences, and most notably in mathematics.Similarly, a study conducted by ACED in 2008a foundthat the number of domestic engineering enrolmentshad declined by about one per cent over the pastdecade, despite an increase in availability of engineeringplaces. Over the same period, enrolments over alldisciplines increased by about 17 per cent. Of thosestudents who do enrol in engineering, only about 50per cent continue to graduation. There are no specificdata on what happens to the 50 per cent who do notcomplete, but two possibilities are that students learnenough of the basics to commence productive work andthat students transfer to other degrees.With regard to priority gaps in the professionalengineering courses, there exists an excellent coverageof courses in Australia, with approximately 130 differentdegree titles amongst the accredited Bachelor ofEngineering awards. However, due to low studentmobility, most universities attempt to offer mostoptions, but this can result in a trade-off in the quality ofeducation as every university cannot cover all courseswell in all places. The science and engineering disciplinesare of central importance to addressing the skillsshortages identified in the water sector but supplyingadditional places in universities for these subjects canonly be successful with sustained interest from potentialgraduates and well-resourced faculties.Broadly, the overall aim of increasing the supply ofqualified and motivated school leavers that will, intime, culminate in an increased supply of engineeringgraduates is the major challenge for this industry.This could involve increasing the overall successrates through programme improvements, improvingopportunities for women, Indigenous people, matureentrants,overseas graduates, skilled migrants and othergroups that are currently under-represented, and offeringalternative study pathways and programmes usingnew technologies and approaches. More pathways arerequired for career advancement and to better serve theneeds of industry, such as providing education supportsystems to assist migrant entry into the <strong>Australian</strong> waterindustry.The engineering profession has adopted a threelevel “team” approach that includes ProfessionalEngineers and Engineering Technologists (equivalent to“professional”) and Engineering Officers (equivalentto ‘paraprofessional’ and about four steps up from“trades”). To become an Engineering Technologistrequires the completion of a three-year BachelorsDegree, while the qualification level for EngineeringOfficers is a two-year Associate Degree or VETAdvanced Diploma. There are few enrolments inengineering technology degrees, and most studentsenrolling in them seek to transfer to four-year Bachelorof Engineering awards programs. Most <strong>Australian</strong>employers do not formally recognise the engineeringtechnologist occupation and qualification, although it iswell established in many countries overseas.Universities are collaborating more, particularly in NewSouth Wales (NSW) and Queensland (Qld), to addressthe staff expertise issue. This is partly due to an increasein the confidence in the use of technology for distanceeducation and considerable use of case studies.The ACED 2008a study made six recommendationsthat aim to ensure that the system can produce enoughengineering graduates to meet society’s future needs,including:1. Improve the public perception of engineering,including within primary and secondary schools, byincreasing the visibility of the industry.2. Develop, support and promote the importance of allICE WaRM • <strong>National</strong> <strong>Skills</strong> <strong>Audit</strong> (Phase One) Report 11
members (at all educational levels) of the engineeringteam in achieving successful outcomes.3. Implementation of best-practice engineeringeducation by all engineering schools.4. Enhance resources to enable delivery of engineeringeducation aligned with Australia’s needs andinternational standards.5. Enhanced engagement with industry to strengthenauthenticity of education.6. Address shortages by increasing diversity inworkplaces and education programmes.Although the VET sector has clear guiding strategies forcollaboration with industry, universities do not, insteadhaving ad hoc, fragmented relationships. This situationmust be improved to ensure that university courses alsoreflect the needs of industry, particularly in industriesexperiencing skills shortages. However, as universitiesand industry have different drivers, it is not necessarilyan easy task to devise a mutually beneficial process.“Companies and universities are not natural partners:their cultures and missions are different” (Lambert,2003).Tables 3.1 and 3.2 provide a comparison of differentknowledge acquisition and product developmentcharacteristics of industry and universities. Thesecharacteristics are of course generalisations, and thereare notable exceptions, but they serve to illustrate thedifferent drivers in each sector.In a recent survey by WICD on the nature ofrelationships between the water industry anduniversities responses were collected from 42organisations. Table 3.3 shows that the majorityof activities occurring between respondents anduniversities centre around employing graduates (90per cent) and offering internships/cadetships/vacationemployment (81 per cent). Very little activity occurredin regard to providing advice on course content (22 percent), providing lectures on water topics (33 per cent)or offering prizes and awards (18 per cent). Similarly,Table 3.1: Knowledge acquisition characteristics of industry and universitiesIndustryMarket drivenApplied to specific area/productUniversitiesCuriosity drivenContribution to knowledgeProtected Given freely (?)SpecificLimited resourcesSingle disciplineExploratoryMany resourcesMulti-disciplinarySource: Murray 2008b, adapted from Attikiouzel 2008.Table 3.2: Product development characteristics of industry and universitiesIndustryMarket needInventorPreproduction prototypeBusiness planFundingProduction prototypeManufacturingMarketing StrategySales:$$$$UniversitiesKnowledge needAcademic innovatorCourse description and contentAcademic planAdministrationCourse notesPrintingMarketing StrategyStudents:$$$$$Source: Murray 2008b, adapted from Attikiouzel 2008.12 ICE WaRM • <strong>National</strong> <strong>Skills</strong> <strong>Audit</strong> (Phase One) Report
Table 3.3: Frequency respondents interacted with universities for range of activitiesActivityDiscuss employment opportunitiesAdvise on course contentProvide lectures on water topicsEmploy graduatesOffer internships/cadetships/vacationemploymentOffer scholarshipsOffer prizes or awardsDisplay or speak at careers fairs/otherSupervise or collaborate with postgraduatestudentsFrequencyNever Rarely Occasionally Frequently4 9 23 410% 22% 58% 10%15 16 8 138% 40% 20% 2%19 8 11 248% 20% 28% 5%3 1 17 198% 2% 42% 48%2 5 14 195% 12% 35% 48%17 6 10 742% 15% 25% 18%16 16 3 441% 41% 8% 10%9 8 13 1022% 20% 32% 25%10 10 17 424% 24% 41% 10%Provide research support/other11 8 15 727% 20% 37% 17%Source: Adapted from <strong>Water</strong> Industry Capacity Development 2007.Note: Top number is the count of respondents selecting the option; bottom % is percent of the totalrespondents selecting the option.Table 3.4: Engagement activities between industry and universityStageAwarenessActivitiesInformation SessionsCareer ExposHiringLevel of Engagement(Financial and In-Kind)LowParticipationAdvisory BoardsResearch GrantsDesign ProjectsMediumSupportBusiness/site visitsCurriculum Development and EvaluationIndustry ProjectsInternships/CadetshipsApplied ResearchGuest Speaking/LecturersIndustry Workshops/SeminarsSupport for Research Grants (such as CRCs)Scholarships/Awards/PrizesProposals for education, such as ICE WaRMWork Integrated LearningMediumSponsorshipProfessorial ChairsCentres of Excellence/ExpertiseFellowshipsCollaborative Research ProgrammesEquipment DonationsHighStrategic PartnershipEconomic Development Activities such as Defence/MiningHighSource: Murray 2008b.ICE WaRM • <strong>National</strong> <strong>Skills</strong> <strong>Audit</strong> (Phase One) Report 13
Table 3.5: <strong>Australian</strong> Government strategies, policies and programs, including details of committed funding and trainingplaces, where providedProgram/policy nameRealising Our Potential-Universities-Bachelor of Science*-Bachelor of Engineering*-Tertiary education access-Vocational education-Schools-Higher Education Endowment FundCommitment$3.5 billion overall$1.7 billion, 2,300 new places, including175 undergraduate places, five Honours, 10 Masters520 undergraduate places, 10 Masters$222 million$638 million$843 million$5 billionSkilling Australia for the FutureEducational reform and skilling workforce. Aims to halve proportion of people withoutqualifications of Cert III or above and double proportion with qualifications of Diploma and above.Productivity Places Program 450,000 new training places overall. 20,000 available for job seekers from 1st April 2008.-Existing workers275,000 training places, including 450,000 Apprenticeships.-Job seekers175,000 training places, including 20,000 Apprenticeships.Mentors for our students$5 million over four years to train 750 mentors in 25 communities.<strong>National</strong> Training Infrastructure ProgramProvides <strong>Australian</strong> Government sourced capital funding to the states and territories forinfrastructure projects in the vocational education and training sector. Funding for Skill Centresfor School Students, Industry Skill Centres, and VET Infrastructure for Indigenous People isprovided through sub-components of this program.Group Training <strong>Australian</strong> ApprenticeshipsTargeted Initiatives ProgramObjective is to fund Group Training Organisations (GTOs) to undertake projects to generatequality <strong>Australian</strong> Apprenticeships opportunities, and employ <strong>Australian</strong> Apprentices in priorityareas.Industry Training Strategies ProgrammeFunds projects that help employers to more fully understand nationally endorsed trainingpackages, with a particular emphasis on increasing pathways for <strong>Australian</strong> Apprentices.<strong>Australian</strong> Apprenticeships IncentivesProgrammeOffers financial incentives to eligible employers who take on an <strong>Australian</strong> Apprentice.Support for Mid-Career ApprenticesAims to encourage <strong>Australian</strong>s 30 and over to commence an <strong>Australian</strong> Apprenticeship atCertificate III or IV level in a trade experiencing a skills shortage by providing additional financialincentives.Indigenous Tutorial Assistance SchemeAims to maximise educational opportunities available to eligible Indigenous students and toimprove their education outcomes. $7.7 million over 2006-08 for assistance with transition stageof schooling (first year only).<strong>National</strong> <strong>Water</strong> InitiativeThe <strong>National</strong> <strong>Water</strong> Initiative represents the <strong>Australian</strong> Government’s and state and territorygovernments’ shared commitment to water reform. Initial Commonwealth funding (2005-07)was $2 billion, the majority for infrastructure).$1.7 million Graduate Course in <strong>Water</strong> Planning$1.2 <strong>National</strong> <strong>Water</strong> <strong>Skills</strong> Resources Project$250,000 <strong>National</strong> <strong>Water</strong> Sector <strong>Skills</strong> Project$1,350,000 <strong>National</strong> Fellowship Programme$30 million <strong>National</strong> Centre for GW Research and Training.<strong>Water</strong> for the Future$12.9 billion*Excludes places that have no relevance to the water sector, such as Bachelor of Science (Marine Biology).14 ICE WaRM • <strong>National</strong> <strong>Skills</strong> <strong>Audit</strong> (Phase One) Report
activities such as offering scholarships, supervising/collaborating with postgraduate students and providingresearch support also occur infrequently.Table 3.4 illustrates the types and level of engagementbetween industry and university. Engagement canoccur at various levels with a parallel investment, thatis, the greater the benefits the higher the investment.Traditionally engagement has focused on awarenessraisingactivities including information sessions, careersevents and hiring.Relevant <strong>Australian</strong> GovernmentInitiativesTable 3.5 presents an overview of the policies, strategiesand programmes that are most relevant to this audit.These are current as at May 2008, though it is notedthat this is a rapidly changing environment in the earlymonths of a new Commonwealth Government.The Commonwealth of Australia’s 2007 initiativeRealising our potential, is a comprehensive programmeof reforms to the entire education sector. It involves aninvestment of $3.5 billion over four years – $1.7 billion foruniversities, $222 million to improve access to tertiaryeducation, $638 million for vocational education, $843million for schools and the establishment of a HigherEducation Endowment Fund (HEEF) with initial capital of$5 billion.This programme of reform builds on other policies suchas Skilling Australia for the Future which is a tripartiteapproach for up-skilling existing workers and jobseekersthat represents a change of focus from provider(Registered Training Organisations’s) to industry demanddriven places. Together with reform of the educationindustry, the overall aim is to halve the proportion of<strong>Australian</strong>s without qualifications at Certificate III andabove and to double the number of completions ofhigher qualification (Diploma and Advanced Diploma) forthose between 20–64 years of age.Central to this policy is the Productivity Places Programwhich targets training for priority occupations inindustries identified as experiencing skills shortages.These priority occupations are listed in the <strong>National</strong> <strong>Skills</strong>Need List (not specifically identifying the water sector)and are derived from one-off surveys of employers as‘difficult to fill occupations’ or are identified as being inshortage from the SERA survey series, undertaken byDEEWR and updated every six months. However, thisindicator is useful for job seekers but does not reflectthe up-skilling requirements of the existing workforce orthe existence of new or evolving job roles.A total of 450,000 new training places will be providedthrough the Productivity Places Program, 275,000of which will be for training existing staff, and thebalance of 175,000 targeted at jobseekers. Of the‘existing worker’ places, 45,000 will be for <strong>Australian</strong>apprenticeships and, of the ‘job seeker’ places, 20,000will be for <strong>Australian</strong> Apprenticeships. The majority ofthese places (about 90 per cent) will be at Certificate IIIlevel or higher to ensure that skills demands are met forindustry.These places will be filled over the next four years inthree phases, as follows. Phase 1 will provide 20,000 jobseeker places in RTO’s from 1 April 2008 (Certificate IIand III levels); Phase 2 will provide additional job seekerplaces as well as places for existing workers from1July 2008 – December 2008; and Phase 3 will provideexisting workers and job seeker places from 1 January2009 and beyond. The delivery models will be refinedbased on the lessons learnt in the initial two phases andapplied to the third phase and into the future.There have been a number of commitments aiming torectify issues identified in the education and trainingsector. Most recently, in 2008, <strong>Skills</strong> Australia wasestablished as an independent statutory body and isgoverned by the <strong>Skills</strong> Australia Act 2008. Its function isto provide advice to the <strong>Australian</strong> Government to assisttargeting of skills and workforce development throughanalysis of skills requirements of industry and will workwith existing Industry <strong>Skills</strong> Councils. This has providedthe VET sector with a clear set of guiding principles forbuilding on linkages with industry. However, universitiesdo not have a framework for consultation with industryand, hence, there remain many barriers that impactcollaboration between the two.As a response to these new policies and programmes,GSA’s role has been expanded to that of broker forcompetitive applications for the additional trainingplaces outlined in Table 3.5. However, it is not as simpleas defining priority occupations and filling training oreducation places to alleviate the skills shortage. Thereare a number of other factors in play that are impactingon the water industry and the skill levels of theworkforce that may make it difficult to achieve the skilllevel required.BarriersIn 2007, GSA conducted an environmental scan ofthe range of current issues within the scope of GSAoperations including the core water sector, which isvariably reported as having between about 20,000and 60,000 employees, plus contractors and productsupply chain employees, depending on how job rolesare defined. The report identified a number of additionalissues with attracting and retaining staff that areexperienced by the water sector, as discussed below.Potential reasons for the general lack of interest instudying engineering and some sciences and otherICE WaRM • <strong>National</strong> <strong>Skills</strong> <strong>Audit</strong> (Phase One) Report 15
priority issues within the education sector that result inbarriers for those considering eventual employment inthe water industry have been identified as including:• Competition for employment from well paidsectors with lower qualifications, such as mining andconstruction.• Changing expectations from younger members ofworkforce who expect greater flexibility in workinghours, the opportunity to achieve a work/life balance andoptimised career paths than is offered by industry.• Changing/evolving job roles, definitions andqualifications make it difficult to specifically choose acareer path in the water industry.• Difficulty in sourcing water-specific training oreducation programmes in preferred locations. Thisproblem is partly because of the reduction of educationoptions to only two tiers – TAFE and University.• Preferences for shorter training periods.• Increase in staff to student ratio from 1:14 to 1:21– heavier teaching loads means that teaching staff arespread across more disciplines with a concomitant lossin teaching quality.• Difficulties in making academic appointments dueto shortages in quality staff and higher incentives forresearch than teaching.• Inadequate educational training, professionaldevelopment or incentives to improve teachingthroughout the education system.• Time delays resulting from university approvalsprocesses often requiring multiple layers of decisionmaking.• Fragile relationships often based on personal/professional contacts rather than organisation levelrelationships.• Varying levels of commercial acumen at universitiesleading to difficulties that may jeopardise a project andpotentially impacting on financial returns for both theuniversity and the industry partner.Barriers identified by universities included:• Lack of understanding of the nature, scope andimportance of industry.• Lack of accessible, systematic data collection foreffective management reporting and decision-making.• Lack of control of income and expenditure.• Fragmented structures for industry engagementplanning, management and service delivery.• Fragile relationships often based on personal/professional contacts rather than organisation levelrelationships.• Lack of resources to invest in necessary infrastructurefor long-term relationship building.Some of these barriers may be being addressed byrecently announced or pending initiatives, for whichdetails are currently under development.• Inadequacy in university laboratories using outdatedequipment.• Variable connectivity with industry resulting in lessemployment-relevant curriculum.• The low-visibility of engineering, science and thewater industry in particular when choosing education andemployment options.In Murray’s 2008b paper on collaboration betweenuniversities and industry, the following issues wereidentified by each party that could be barriers toimproving relationships.Barriers identified by industry included:• Unclear responsibilities and authority.• A lack of timely responsiveness.• A lack of consistent and clear intellectual propertypolicies across universities.16 ICE WaRM • <strong>National</strong> <strong>Skills</strong> <strong>Audit</strong> (Phase One) Report
3.2 The ‘Urban’ <strong>Water</strong> IndustryIntroductionA survey of water-related skills availability andrequirements, and projections, was carried out by WSAAearly in 2008 and the results published as OccasionalPaper No. 21 in March 2008, titled An assessment ofskills shortages in the urban water industry. The surveyand analysis was undertaken by Infohrm Pty Ltd.WSAA’s support for this project, including grantingpermission to use key results from their report, isgratefully acknowledged.The WSAA surveyed 18 urban water utilities covering10,900 employees representing 56 per cent of the totalworkforce of its members. According to the WSAApaper, “The largest utility had about 3,200 employeesand the smallest had 23 employees. Seven of thewater utilities had fewer than 200 employees.” (p.13). The largest organisation was Sydney <strong>Water</strong> andWSAA presents many of the results from the surveyboth including and excluding Sydney <strong>Water</strong> so thatthe patterns of the results are not dominated by onecompany.Current Workforce (Supply)The WSAA report made the following conclusions aboutthe workforce in the major <strong>Australian</strong> water utilities:• It is relatively stable, in terms of full-time andpermanent employment status.• The workforce is relatively old, suggesting asignificant number of retirements in the next five to tenyears.• Employees are relatively long-tenured, bringingbenefits of stability, intellectual knowledge, experienceand loyalty. Potential disadvantages include reducedinnovation and enthusiasm for change.• There is a high proportion of males relative to femalesin the <strong>Australian</strong> labour force generally.The following summary of WSAA findings were selectedto provide an overview of findings that are directlycomparable to findings in the survey carried out bySACES for this audit.Of the employees covered in the survey, 93 per centwere full-time and the remaining 7 per cent were parttime.Figure 3.1: Age profile of the urban water sector workforce100%0.817.580%60%30.9%40%24.920%210%4.9Workforce Age Profile
Ages of the employees were recorded in bands rangingfrom less than 25 years to 65 years and over, as shownin Figure 3.1.The company carrying out the analysis, Infohrm,presents the age profile of the WSAA sample incomparison with its own median all industry ageprofile. It can be seen that the water utility workforcerepresented in this sample is notably older, on average,than Infohrm’s all-industry average. The WSAA samplehas 30.9 per cent of employees in the 45 to 55 agebracket, 17.5 per cent aged between 55 and 65, and0.8 per cent in the over 65 group. This gives a total of49.2 per cent of the water utility workforce aged 45 andabove, which is significantly higher than the Infohrm allindustryfigure of 40.2 per cent aged 45 and above.The WSAA report also presented the numbers ofretirements cited by survey respondents during thepast year, and the average age of those retiring. Thesefindings are shown in Figure 3.2. The average retirementage was found to be 60.5 years, which is similar to theall-industry median found by Infohrm of 60.1 years.However, as illustrated in Figure 3.1, the large proportionof employees in the water utilities aged 45 and abovesuggests that this segment will see a significant numberof retirements during the next five-to-ten year period.The labour supply forecast for all utilities and for thegroup of respondents, both including and excludingSydney <strong>Water</strong>, is shown in Figure 3.3.1 and Figure 3.3.2,respectively.These results assume that retirement is at an averageage of 62.5 years and that there is a 20 per centleakage. WSAA states in this report that the authorshave assumed a 20 per cent leakage – so that of thoseemployees that leave a job in the water utility for areason other than retirement, 80 per cent remain withinthe sector, while the other 20 per cent move to anothersector. However, this number is “based on hearsay”(page 23). Note that, although the survey resultsidentified an average retirement age of 60.5, Infohrmused a retirement age of 62.5 in their forecasting asthey assumed that Sydney <strong>Water</strong>’s superannuationarrangements would make retiring at 65 attractive,pushing up the expected retirement age (WSAA 2008,p.22).Figures 3.3.1 and 3.3.2 show that in the very short term,that is, by 2009, between five and six per cent of theexisting workforce will have retired. By 2017, this figurewill rise to between 25 and 27 per cent. With projectedturnover within the sector, by 2017, only 27 per cent ofthe current workforce is expected to still be employedin their current organisation, and with Sydney <strong>Water</strong>excluded this falls to 16 per cent.Demand for LabourWSAA obtained demand forecasts for labour from“senior stakeholders in ten water utilities, taking intoaccount utility context and pressing business issues”(page 24). The business issues identified by these seniorstakeholders as having the largest impacts on labourdemand forecasts are as follows:• Climate change.• Alternative approaches to water supply.Figure 3.2: Average number of retirements (per annum) and average retirement age.Headcount9876543210Org 13 Org 15 Org 5 Org 9 Org 2 Org 6 Org 12 Org 46664626058565452Age (yrs)No. retirementsAv retirement ageSource: <strong>Water</strong> Services <strong>Association</strong> of Australia 2008.18 ICE WaRM • <strong>National</strong> <strong>Skills</strong> <strong>Audit</strong> (Phase One) Report
Figure 3.3.1: Workforce supply forecast to 2017, including all organisations100%5%3%12%11%6%27%80%23%9%60%100%36.4%40%81%59%20%27%0%Current 2009 2012 2017Net Supply Resignations - churn Resignations - 20% leakage Retirements - 62.5 yrsSource: <strong>Water</strong> Services <strong>Association</strong> of Australia 2008.Figure 3.3.2: Workforce supply forecast to 2017, excluding Sydney <strong>Water</strong>100%6%4%12%80%15%8%25%12%31%60%100%40%75%47%49%20%16%0%Current 2009 2012 2017Net Supply Resignations - churn Resignations - 20% leakage Retirements - 62.5 yrsSource: <strong>Water</strong> Services <strong>Association</strong> of Australia 2008.ICE WaRM • <strong>National</strong> <strong>Skills</strong> <strong>Audit</strong> (Phase One) Report 19
Figure 3.4.1: Workforce demand forecast to 2017 including all organisations14%12%10%8%6%4%2%5.0% 5.8%3.2% 3.4%4.8%3.9%0%2009 2012 2017Scenario 1 demand (Predicted change)Scenario 2 demand (Unplanned change)Source: <strong>Water</strong> Services <strong>Association</strong> of Australia 2008.Figure 3.4.2: Workforce demand forecast to 2017 excluding Sydney <strong>Water</strong>14%12%10%8%6%4%6.0%9.4%10.7%6.3%13.3%7.3%Mostlikelyoutcome2%0%2009 2012 2017Scenario 1 demand (Predicted change)Scenario 2 demand (Unplanned change)Source: <strong>Water</strong> Services <strong>Association</strong> of Australia 2008.• Infrastructure renewal.• Possible institutional reform.• Potential fiscal constraints for increased capitalexpenditure.The WSAA report also suggests that “it is also possiblethat, in some cases, increased demand is influenced bysignificant downsizing during previous decades” (page24).Figure 3.4.1 and Figure 3.4.2 shows the demandforecasts for workforce in the water utilities under twoscenarios: Scenario 1 incorporates predicted change,and Scenario 2 takes into account unplanned changes.WSAA indicated that the most likely scenario is Scenario1 excluding Sydney <strong>Water</strong>, which is shown in Figure3.4.2. Under this scenario, the urban water industryworkforce would need to increase by six per cent fromcurrent numbers by the end of 2009. Thereafter therequired increase would stabilise to 6.3 per cent by 2012and 7.3 per cent by 2017. Scenario 2 represents a ‘worstcase’ outcome, where the required increase would be9.4 per cent by the end of 2009, and 13.3 per cent by2012. The demand forecasts provided by Sydney <strong>Water</strong>were not consistent with those provided by the majorityof the water utilities, and thus it was excluded from thesample in calculating the most likely scenario.Gap AnalysisWSAA presented predictions based on ‘worst case’,‘best case’ and ‘most likely’ scenarios for the gapsexpected between the supply and demand for labourin the urban water industry. The best case scenario,including the ‘skewing agency’ of Sydney <strong>Water</strong>, had thesmallest gap between supply and demand for labour (asshown in Figure 3.4.1 and 3.4.2).It can be seen from Figure 3.5.1 that the expected gapunder the best case outcome was 39.6 per cent of theexisting workforce (3.9 per cent increased demand plus36 per cent [rounded up] diminished supply).20 ICE WaRM • <strong>National</strong> <strong>Skills</strong> <strong>Audit</strong> (Phase One) Report
Best caseoutcomeFigure 3.5.1: Workforce gap forecast to 2017 including all organisations20%10%5.0%5.8% 4.8%0%3.2% 3.4%3.9%2009 2012 2017-10%-8%-20%-18%-30%-40%-36%Scenario 1 demand (Predicted change) Scenario 2 demand (Unplanned change)Supply (20% leakage + retirements)Source: <strong>Water</strong> Services <strong>Association</strong> of Australia 2008.MostlikelyoutcomeWorstcaseoutcomeFigure 3.5.2: Workforce gap forecast to 2017 excluding Sydney <strong>Water</strong>20%10%0%-10%-20%-30%-40%13.3%9.4%10.7%6.0% 6.3%7.3%2009 2012 2017-10%-19%-37%Scenario 1 demand (Predicted change)Scenario 2 demand (Unplanned change)Supply (20% leakage + retirements)Source: <strong>Water</strong> Services <strong>Association</strong> of Australia 2008.ICE WaRM • <strong>National</strong> <strong>Skills</strong> <strong>Audit</strong> (Phase One) Report 21
Table 3.6: Estimated headcount gaps for all job roles by 2017Job RoleExtrapolated job roleheadcountMost likely % gapDecember 2017Dec 2017Most likelyheadcount gapnumbers (based onWSAA headcount of19,500)Corporate Manager 506 -40.8% -207Operational Manager 1472 -35.9% -528Civil Engineer 1830 -44.9% -822Mechanical Engineer 98 -79.9% -78Electrical Engineer 152 -106.7% -162Process/Chemical Engineer 208 -52.3% -109Environmental Engineer 298 -35.5% -106Civil Paraprofessional 681 -62.7% -427Mechanical Paraprofessional 144 -47.0% -68Electrical Paraprofessional 62 -77.8% -48Process/Chemical Engineer 23 -22.0% -5Environmental Paraprofessional (Engineering) 64 -57.3% -37Environmental Professional (Scientific) 465 -28.4% -132Microbiology Professional 157 -47.1% -74Chemist Professional 105 -96.3% -101Environmental Paraprofessional (Scientific) 213 -64.3% -137Microbiology Paraprofessional 33 -43.6% -15Chemist Paraprofessional 62 -37.6% -23Electrical Tradesperson 394 -46.9% -185Mechanical Tradesperson 1497 -42.6% -638Construction and Maintenance – <strong>Water</strong> 2020 -42.7% -863Plant Operator – <strong>Water</strong> 572 -48.7% -278Plant Operator – Wastewater 887 -60.6% -537Business Support Professional 3493 -36.8% -1284Business Support Paraprofessional 4063 -44.1% -1792TOTAL 19,500 8,656Source: Adapted from <strong>Water</strong> Services <strong>Association</strong> of Australia 2008.22 ICE WaRM • <strong>National</strong> <strong>Skills</strong> <strong>Audit</strong> (Phase One) Report
The worst case scenario in Figure 3.5.1 showed thelargest gap between demand and supply. By 2017, thegap was predicted to be 50.3 per cent of the existingworkforce, which is calculated from 13.3 per centincreased demand plus 37 per cent diminished supply.The most likely outcome, as shown in Figure 3.5.2,was scenario 1 which excluded the skewing agencyof Sydney <strong>Water</strong>. WSAA (2008, p. 26) stated that thisscenario was considered most likely because:• The scenario – predicted change – is more likely thanunplanned change.• It is based on data consistent with trends of themajority of participating water utilities.The most likely outcome is for the gap to reach 44.3per cent by 2017, which was calculated by adding 7.3per cent increased demand and 37 per cent diminishedsupply.WSAA then presented this gap analysis by job rolecategories, which is shown in Table 3.6 for Scenario 1in 2017. For an expected required workforce of nearly19,500 there was a gap of 8,700 people, with gapsoccurring in all job classifications.Main ConclusionsThe WSAA report concluded that there are a numberof issues facing the major water utilities, of which the“most pressing” (page 31) are:• There is a sizeable workforce gap forecast for thefuture. This will be driven predominantly by retirementsand resignations and to a lesser extent by increasingdemand.• <strong>Water</strong> utilities have a relatively old workforce andtherefore a relatively large number of impendingretirements, and issues around knowledge transfer andsuccession management strategies.• There is a high turnover of civil engineers, whichaccounts for about 10 per cent of the water utilitiesworkforce.• The current workforce is highly experienced, butrelatively inflexible. There is a dominance of permanent,full-time, older and long-tenured employees.• Some water utilities are not competitive with regardto salaries for some job roles, affecting attraction andretention of staff.• In addition to current skills deficits, there will beother skills which will become increasingly important,specifically: asset management, project management,and commercial acumen/cost management.ICE WaRM • <strong>National</strong> <strong>Skills</strong> <strong>Audit</strong> (Phase One) Report 23
3.3 The ‘Non-Urban’ <strong>Water</strong> IndustryIntroductionSACES contacted as many water industry participants aspossible with such a tight timeframe to ensure that theindustry was represented as evenly as possible acrossindustry segments and skills. Contact lists were preparedfor members of the AWA, NRMs, CMAs and local andregional councils. As discussed in section 3.2, given thatWSAA had already conducted a similar survey for 18 of itsmembers, these companies were not approached for thissurvey, in order to avoid duplication of results.Occupation Classification andQualification LevelsTo effectively build on the WSAA survey and provideestimates on future job requirements it was necessaryto adapt and extend the job families and job roles of theWSAA study (see Appendix C).In estimating future requirements it is recognised thatthere are qualifications in the VET and university sectorswhich are not represented to individual levels. Forexample, a university engineering degree could be for anEngineering Technologist (three-year) or for a ProfessionalEngineer (four-year).The tables used for presenting results in Section 4 alignwith the <strong>Australian</strong> Qualifications Framework (AQF). Thesurvey design (and subsequent feedback) identified aneed for a major review of occupation classification andrelated qualification levels.Survey RespondentsFrom the 495 organisations sent the survey, 54 responseswere received, or roughly 11 per cent of those contacted.This relatively low response rate was to be expectedgiven an extremely tight timeframe for responses. Theresponses were allocated to the following segments:public sector – state; public sector – local/regional (note:public includes majority government-owned corporations);private sector – consultant; private sector – contractor/constructor; private sector – manufacturer/distributor; andeducation and research.There were no survey returns from Commonwealthgovernment organisations.Of the 54 responses representing 3,468 water-relatedemployees, 35 were from companies registered with theAWA, accounting for a total of 2,720 water employees.Eight were LGAs which had 669 water employees andthe remaining 11 organisations were NRMs or CMAs,and had a total of 80 water employees (these figures givea total of 3,469 employees, with the difference due torounding).As shown in Table 3.7 and Figure 3.6, the 54 organisationsrepresented a total of 3,468 water-related employees.The highest number of responses came from localand/or regional government organisations, at 15, whichrepresented 744 water-related employees.There were three responses from state governmentorganisations, with a total of 92 water-related employees.Three of the NRMs which responded classifiedthemselves in the ‘education and research’ segment,a definition which applied to just nine water-relatedemployees in total. The total number of employeescovered by the public segment responses was 845. Itis noted that overall time constraints, and especiallythe short period allowed for returning responses to thesurvey, would have disadvantaged the large public sectororganisations at Commonwealth and State governmentlevels.Table 3.7: Companies from which responses were receivedSegment of water sectorNumber ofcompaniesresponded<strong>Water</strong>-relatedemployeesPublic - State 3 92Public - Local/Regional 15 744Private Sector - Consultant 14 432Private Sector - Contractor/Constructor 9 1,247Private Sector - Manufacturer/Distributor 10 943Education and Research 3 9Totals 54 3,468Note: Public includes majority Government-owned corporations.24 ICE WaRM • <strong>National</strong> <strong>Skills</strong> <strong>Audit</strong> (Phase One) Report
Figure 3.6: Number of organisations that responded, by segment1614151412Number108691043320Public - State Public -Local/RegionalPriv Sector -ConsultantPriv Sector -Contr/ConstrPriv Sector -Manuf/DistribEducation &ResearchSegment of water sectorThe other 33 responses came from the private sectorand applied to 2,622 water-related employees. The ninecontractor/constructor organisations represented 1,247of these employees, the 10 manufacturer/distributororganisations represented 943 employees, and the 14consultants represented 432 employees. (It was notconsidered appropriate to average out the size of therespondent organisations in the analysis, since theyranged from one to 3,500.)Current SupplyThe 54 organisations that responded reported 3,468employees in water-related work. This figure includesboth full-time and part-time employees; however, insome cases respondents have reported the number ofFull-Time Equivalents (FTEs) working in water-relatedroles. Therefore, the 3,468 employees does not meanthat there are 3,468 persons in the sample organisationsworking in water, but could actually be higher thanthis, though the total percentage in part-time work isonly 2.9 per cent, suggesting the impact would not besignificant.Table 3.8 shows the share of the workforce employed inwater-related work for each for the segments, and this isalso illustrated in Figure 3.7.This distribution provided an indication of the relativerequirements for water-related skills across thesegments. The manufacturer/distributor organisationshave the highest share of water-related employees at46.2 per cent, which was probably because this groupTable 3.8: Numbers of employees in water sector - totals and working specifically in waterSegment of water sectorTotal number ofemployeesTotal number ofemployees workingin waterPercentageof employeesworking in waterPublic - State 309 105 33.9Public - Local/Regional 3,639 744 31.0Private Sector - Consultant 4,145 432 10.4Private Sector - Contractor/Constructor 4,635 1,247 19.5Private Sector - Manufacturer/Distributor 2,044 943 46.2Education and Research 77 9 11.8Total 14,799 3,468 23.4ICE WaRM • <strong>National</strong> <strong>Skills</strong> <strong>Audit</strong> (Phase One) Report 25
Figure 3.7: Percentage of employees in water-related work, by segment50.045.046.240.0% Employees working in water35.030.025.020.015.010.033.931.010.419.511.85.0-Public - State Public -Local/RegionalPriv Sector -ConsultantPriv Sector -Contr/ConstrPriv Sector -Manuf/DistribEducation andResearchSegment of water sectorincluded specialised producers and distributors of waterrelatedproducts. The other private sector organisationsrequire much smaller proportions of their workforceto be employed in water-related roles. The state andlocal/regional government organisations indicated thatroughly one third of their total workforce was employedin water-related roles.Respondents were asked whether they provided waterrelatedservices to urban areas and/or regional areasand the results are shown in Table 3.9. Of the 54 in thetotal survey sample, there were 51 respondents to thisquestion. Of these, 48 said that they provide services tourban areas and 50 provide services to regional areas.As can be seen, the employment pattern of therespondents was characterised by full-time employment.Only three per cent of employees were engaged ona part-time basis, with over one-third of part timeemployees in business support roles.‘Operators’ was the most common job family,accounting for 34 per cent of total employment. Theindustry appears to have a reasonably highly skilledemployment profile, with 22 per cent of the estimatedworkforce in a professional occupation, nine per centin a paraprofessional occupation and 18 per cent ofemployees being tradespersons. Civil engineers aloneaccounted for 10 per cent of the estimated employment.Table 3.10 sets out the distribution of employmentby key occupation for the respondents to the survey.These proportions have been calculated based on theestimated population levels and so differ slightly fromthe raw responses.Table 3.9: Companies providing water-related services to urban areas and/or regional areasIt is noted that the proportion of employees classifiedas ‘Business support’ in the non-WSAA segment, at10.5 per cent, was much lower than the 39 per centreported in the WSAA segment. This may be attributableto the apportionment of these roles in mixed sectorbusinesses in the non-WSAA segment.Segment of water sectorIn which areas do you provide services?Urban Regional Total samplePublic - State 3 2 3Public - Local/Regional 11 13 15Private Sector - Consultant 13 14 14Private Sector - Contractor/Constructor 8 8 9Private Sector - Manufacturer/Distributor 10 10 10Education and Research 3 3 3Total 48 50 5426 ICE WaRM • <strong>National</strong> <strong>Skills</strong> <strong>Audit</strong> (Phase One) Report
Table 3.10: Distribution of estimated (non-WSAA) water industry employment by key occupationJob RolesFull-time% of totalPart-time% of totalTotal% of totalManagers and AdministratorsCorporate Manager 2.0 0.1 2.1Operational Manager 4.9 0.0 5.0Engineer - ProfessionalsCivil Engineer 9.5 0.3 9.8Mechanical Engineer 1.6 0.2 1.8Electrical Engineer 2.3 0.0 2.3Process/Chemical Engineer 3.6 0.0 3.6Environmental Engineer 1.7 0.0 1.7Science/Technical - ProfessionalsEnvironmental professional 1.5 0.1 1.6Public Health Professionals 0.0 0.0 0.0Chemist 0.9 0.0 0.9Engineer - ParaprofessionalsCivil Engineering Paraprofessional 3.8 0.0 3.8Mechanical Engineering Paraprofessional 0.9 0.0 0.9Electrical Engineering Paraprofessional 2.8 0.0 2.8Environmental Paraprofessional (Scientific) 0.5 0.0 0.5Science/technology - ParaprofessionalsEnvironmental Paraprofessional 0.4 0.0 0.4Public Health Paraprofessional 0.0 0.0 0.0Chemist Paraprofessional 0.7 0.0 0.7Trades and Related WorkersElectrician 1.9 0.1 2.0Electronic Instrument Tradesperson 0.9 0.0 0.9Fitter 4.9 0.1 5.0Metal fabricator (incl. boilermakers) 0.7 0.0 0.7Metal casting and forging trades (incl. blacksmiths) 0.0 0.0 0.0Plumber 6.9 0.0 6.9Apprentice 2.1 0.0 2.1OperatorsConstruction and Maintenance 10.0 0.6 10.6<strong>Water</strong> Industry Operator 10.5 0.2 10.7Process/production workers 12.7 0.0 12.8Business supportProfessionals 3.6 0.4 4.0Paraprofessionals 5.8 0.7 6.5Total 97.1 2.9 100.0ICE WaRM • <strong>National</strong> <strong>Skills</strong> <strong>Audit</strong> (Phase One) Report 27
Age BracketsThe organisations were asked how many of their waterrelatedemployees were in the 45 to 55 age bracket andhow many were aged 55 and above. This information willbe helpful in providing an estimate of the numbers ofpeople likely to retire during the forecast period.As shown in Table 3.11, the estimated non-WSAA waterworkforce is relatively mature, with 23 per cent ofemployees aged over 45. Environmental Paraprofessionalfeatures the oldest occupation profile with 57 per centaged over 45, followed by Corporate Managers andOperations Managers. Environmental Engineers are theyoungest occupation, with only four per cent aged over45 which is likely to be because it is a relatively newcategory.The age distribution of the estimated non-WSAAworkforce by broad job families is illustrated in Figure3.8. Managers and Science/Technology Paraprofessionalshave very aged occupation profiles, whereas for ScienceProfessionals; Tradespersons and Operators, less than 20per cent of the workforce was aged over 45.Figure 3.8: Age profile of the estimated (non-WSAA) water sector workforce by job family50.045.045 - 55 55+40.035.030.0%25.020.015.010.05.00.0Managers and AdminEngineer - ProfScience/Technical - ProfEngineer - ParaprofScience/technology -ParaprofTrades and Related WorkersOperatorsBusiness supportJob Family28 ICE WaRM • <strong>National</strong> <strong>Skills</strong> <strong>Audit</strong> (Phase One) Report
Table 3.11: Age profile of estimated (non-WSAA) water industry employment by key occupation,percentage of total employmentJob RolesManagers and Administrators45-54% of total55 plus% of totalTotal over 45% of totalCorporate Manager 53.6 2.1 55.8Operational Manager 32.9 13.3 46.3Engineer - ProfessionalsCivil Engineer 18.8 6.6 25.5Mechanical Engineer 17.5 11.4 28.9Electrical Engineer 26.4 10.1 36.6Process/Chemical Engineer 36.4 1.9 38.3Environmental Engineer 3.6 0.0 3.6Science/Technical - ProfessionalsEnvironmental professional 13.7 0.0 13.7Public Health Professionals 0.0 0.0 0.0Chemist 33.0 0.0 33.0Engineer - ParaprofessionalsCivil Engineering Paraprofessional 19.2 5.9 25.1Mechanical Engineering Paraprofessional 9.0 9.9 18.9Electrical Engineering Paraprofessional 24.9 1.6 26.5Environmental Paraprofessional (Scientific) 17.4 17.4 34.8Science/technology - ParaprofessionalsEnvironmental Paraprofessional 21.7 35.5 57.2Public Health Paraprofessional 0.0 0.0 0.0Chemist Paraprofessional 24.3 0.0 24.3Trades and Related WorkersElectrician 26.3 8.3 34.5Electronic Instrument Tradesperson 18.7 11.0 29.7Fitter 11.8 7.2 18.9Metal fabricator (incl. boilermakers) 23.1 0.0 23.1Metal casting and forging trades (incl. blacksmiths) 0.0 0.0 0.0Plumber 14.0 4.3 18.3Apprentice 3.2 0.0 3.2OperatorsConstruction and Maintenance 6.5 6.4 13.0<strong>Water</strong> Industry Operator 19.4 13.4 32.8Process/production workers 4.4 1.1 5.5Business supportProfessionals 15.3 6.4 21.6Paraprofessionals 19.6 4.7 24.3Total 16.9 6.2 23.1ICE WaRM • <strong>National</strong> <strong>Skills</strong> <strong>Audit</strong> (Phase One) Report 29
Sources of Recently Appointed StaffThe survey included a question about the sources ofrecently appointed staff, that is, those newly employedwithin the past five years. Table 3.12 and Figure 3.9 showthe seven categories of sources plus ‘other’.The largest source of employees were revealed asorganisations in other industries, at 34, ahead of sourcingemployees from within the water industry, which totalled30 responses. Government and government-ownedTable 3.12: Sources of employees over the past five years 2003-08corporations, and graduates from the university sectorwere also highly significant, at 25 and 24, respectively.There was also shown to be some movement within theorganisations themselves, cited by 15 respondents. Thesources specified under the ‘other’ category, as selectedby nine respondents, included recruiters, personalnetworks, general trades, recent migrants to Australia,local community, and the private sector. The waterutilities provided employees to eight of the sample, andthe lowest response was with regard to the VET sector,which provided water-related employees to only three ofthe sample.Total sourced from(ranked 1 to 3 in importance)1 2 3From overseasOwn organisation 4 4 3 4 15University Graduates 8 10 5 1 24VET Graduates 0 2 1 0 3Organisations in the water industry 10 6 11 3 30Other Organisations 15 10 7 2 34Government 6 9 10 0 25<strong>Water</strong> utilities 2 4 2 0 8Other 4 1 3 1 9TotalFigure 3.9: Sources of employees over five years 2003-0840353025Number20151050OtherOrganisationsOrganisationsin the <strong>Water</strong> IndustryGovernmentsUniversityGraduatesOwnOrganisationOther<strong>Water</strong> UtilitiesVET Graduates30 ICE WaRM • <strong>National</strong> <strong>Skills</strong> <strong>Audit</strong> (Phase One) Report
Recruitment Requirements and IssuesThe organisations were asked in the survey about theirexpectations and requirements of skills when recruitingemployees into water-related roles. They were askedif they had recruited skilled employees using a 457visa. They were also asked whether new professional,paraprofessional and tradespeople are required to have awater industry specific qualification and/or experience.Table 3.13 shows the numbers of employees on a 457visa that organisations had recruited. The 457 visa isthe most commonly used programme for employersto sponsor overseas workers to work in Australia on atemporary basis. This visa allows overseas employeesto work for a period of between three months and fouryears.It can be seen from Table 3.13 that segments thatreported most commonly recruiting employees usinga 457 visa are the local and regional governments at69 per cent, and manufacturers and distributors inthe private sector, at 60 per cent. Approximately onethird of employers in the consultants and contractors/constructors groupings said that they had recruited usinga 457 visa. The three state government and the twoeducation and research respondents all said that theyhad not sourced any employees in this way.Employers were asked what types of employees theyhad the most difficulty recruiting and retaining. Theresponses are presented in Table 3.14 and presentedgraphically in Figures 3.10 and 3.11. It is very clear fromthe tables and figures that the occupational group whichis most difficult both to recruit and to retain is thatof professional engineers. This accounted for nearlyhalf of the answers with regard to recruitment andretention difficulties. The tables show that the segmentsciting professional engineers were predominantly theconsultants and manufacturers and distributors in theprivate sector. This occupational group was also citedby the public sector, particularly the local and regionalgovernment organisations.The second key group that employees highlighted thatthey had the most difficulty recruiting and retaining isthat of science/technical professionals. All but one of thesegments – manufacturers and distributors in the privatesector – said they had difficulty recruiting this type ofemployee, and all but one of the segments – contractorsand constructors – said they had difficulty retainingthem.Nine organisations claimed to experience difficulty inrecruiting managers and two in retaining them. Thisissue mostly affected the local and regional governmentorganisations, although three consultants and onecontractor/constructor also said they had problemsrecruiting managers. Retaining managers seemed tobe less of a problem overall. With regard to the trades,the private sector experienced the most difficulty inrecruiting employees, particularly contractor/constructorsand manufacturer/distributors. Retention was moreproblematic for contractor/ constructors, and cited as aproblem for two of the local and regional governmentorganisations.Business support employees were said to be difficult torecruit and retain by two private sector companies, andretention was also a problem for two of the local andregional government organisations.According to the sample, no significant problem wasreported in recruiting or retaining staff in the followingareas: science/technical paraprofessionals; engineerparaprofessionals; and operators.The organisations in the survey were then askedwhether they required their water-related employees tohave water-specific qualifications and experience, withthe response options of always, sometimes, rarely andnever. The responses are shown in Table 3.15.It can be seen that water-specific qualifications aremost required for new professional employees, withmore than half of the respondents (56 per cent) sayingthat this was a requirement for always or sometimes.This requirement drops to 42 per cent with newparaprofessional employees and falls further for newTable 3.13: Employers recruiting using a 457 visaHave you recruited skilled employees using a 457 visa?Segment of water sector Yes No % Yes % NoPublic - State 0 3 0 100Public - Local/Regional 9 4 69 31Private Sector - Consultant 5 9 36 64Private Sector - Contractor/Constructor 2 4 33 67Private Sector - Manufacturer/Distributor 6 4 60 40Education and Research 0 2 0 100Total 22 26 46 54ICE WaRM • <strong>National</strong> <strong>Skills</strong> <strong>Audit</strong> (Phase One) Report 31
Table 3.14: The types of employees that employers have the most difficulty recruiting and retainingSegment ofwater sectorPublic -StatePublic -Local/RegionalPrivate -ConsultantPrivate -Contractor/ConstructorPrivate -Manufacturer/DistributorEducation andResearchManagerWhich types of employee do you have the most difficulty recruiting?EngineerProfEngineerParaprofScience/TechnicalProf1 2Science/TechnicalParaprofTrades5 5 3 1OperatorsBusinessSupport3 9 2 11 1 1 2 17 1 2Total 9 23 0 10 1 5 0 22Which types of employee do you have the most difficulty retaining?Segment ofwater sectorManagerEngineerProfEngineerParaprofScience/TechnicalProfScience/TechnicalParaprofTradesOperatorsBusinessSupportPublic -StatePublic -Local/RegionalPrivate -ConsultantPrivate -Contractor/ConstructorPrivate -Manufacturer/DistributorEducation andResearch32 3 4 2 1 210 1 11 1 55 2 1 1 1Total 2 19 1 12 1 8 1 42TotalEngineer -ProfessionalScience/Technical -ProfessionalsDifficultiesRecruitingRetaining23 1910 12Manager 9 2Trades 5 8Business Support 2 4Science/technical -ParaprofessionalEngineer -Paraprofessional1 10 1Operators 0 1Total responses 50 4832 ICE WaRM • <strong>National</strong> <strong>Skills</strong> <strong>Audit</strong> (Phase One) Report
Figure 3.10: The categories of employees that organisations experience difficulty in recruiting252320%151010955210Engineer ProfScience/TechnicalProfManager Trades Business Support Science/technicalParaprofFigure 3.11: The categories of employees that organisations experience difficulty retaining20191816141212%1088642241 1 10Engineer ProfScience/Technical ProfManagerTradesBusiness SupportScience/technical ParaprofEngineer ParaprofOperatorsICE WaRM • <strong>National</strong> <strong>Skills</strong> <strong>Audit</strong> (Phase One) Report 33
Table 3.15: Preferences of organisations for water industry-specific qualifications and/or experienceNew professional employees to have water industry specific:Qualification(s)ExperienceSegment of water sector always sometimes rarely never always sometimes rarely neverPublic - State 1 1 1 3Public - Local/Regional 3 7 1 1 3 9Private Sector - Consultant 1 7 5 1 3 11Private Sector - Contractor/ConstructorPrivate Sector - Manufacturer/Distributor1 3 3 1 4 23 4 2 1 7 1Education and Research 1 1 1 2 1Total 5 22 15 6 8 36 4 0New paraprofessional employees to have water industry specific:Qualification(s)ExperienceSegment of water sector always sometimes rarely never always sometimes rarely neverPublic - State 1 1 1 3Public - Local/Regional 1 5 3 2 1 6 2 1Private Sector - Consultant 7 3 3 4 5 2 1Private Sector - Contractor/ConstructorPrivate Sector - Manufacturer/Distributor2 2 3 1 2 3 13 3 3 1 4 2 1Education and Research 1 1 2Total 1 18 13 13 7 20 11 4New tradespersons to have water industry specific:Qualification(s)ExperienceSegment of water sector always sometimes rarely never always sometimes rarely neverPublic - State 1 1Public - Local/Regional 1 5 2 2 8 2Private Sector - Consultant 1 2 1 5 3 1 4Private Sector - Contractor/ConstructorPrivate Sector - Manufacturer/Distributor1 5 1 3 3 13 1 4 2 5 1 1Education and Research 1 1 1 1Total 2 11 11 13 5 17 6 934 ICE WaRM • <strong>National</strong> <strong>Skills</strong> <strong>Audit</strong> (Phase One) Report
tradespersons to 35 per cent. Those saying that theynever require their new employees to have waterspecificqualifications increases from new professionals(13 per cent) to new paraprofessionals (29 per cent) andis highest with the new tradespeople (35 per cent).With regard to water-specific experience, this isshown in Table 3.15 to be most strongly required fornew professional employees, with 92 per cent ofrespondents answering that water-specific experienceis required always or sometimes. It can be seen thatthis requirement drops away to similar levels for theparaprofessional and tradesperson positions, at 64and 59 per cent, respectively. It is interesting to notethat organisations that always require this experiencedoes not vary greatly between the types of employees.However, at the other end of the spectrum, thosewho answered that water-specific experience isnever required rises from zero for new professionalemployees, to four for paraprofessionals and to nine fortradespeople.It may be concluded from the respondents that waterspecificqualifications and experience are requiredmostly for new professional employees, less so for newparaprofessionals and less again for new tradespeople.However, it is important to note that in every employeegrouping, there is a requirement by more than twothirds of respondents that the new employees havewater-specific qualifications and/or experience.Estimated <strong>Water</strong> Industry CurrentEmploymentTo form a picture of the overall size of the watersector outside of WSAA’s membership, populationestimates have been calculated for the sample frame.As discussed the sample frame was divided into stratato represent relatively similar sections of the sample,and the ‘grossing up’ to the population estimate wasundertaken by extrapolating within the strata.As no survey returns were received from councils inTasmania, South Australia, Western Australia and theNorthern Territory, and only one response was receivedfrom Victoria the population estimates do not includeany employment in local government for these states.No responses were received from private sectoranalytical laboratories, or from irrigation operators, andso employment in those organisations also was notincluded in these estimates.Thus, these population estimates represent anestimated total employment for the membership ofAWA, (excluding those which are also members ofWSAA), Local Government employment in Queenslandand New South Wales, and those CMAs and NRMorganisations for which contact information was publiclyavailable. These estimates should be treated withcaution, as the combination of a lack of prior informationon the population of organisations in the water sector,together with the low response rate means that thestandard errors are large.Table 3.16 shows the estimated water sector relatedemployment outside of the main urban water utilities(the members of WSAA who are considered separatelyin Section 3.2). It is estimated that the sector surveyedemploys roughly 24,000 employees although, as isnoted above, a number of parts of the water sector arenot included in this estimate.Current GapsAs part of the survey, respondents were askedto estimate the current number of vacancies intheir organisation by occupation. These results arepresented in Table 3.17 on a population basis for thesurvey’s sample frame. As with the estimate for totalemployment, these estimates should be treated withcaution, as the combination of a lack of prior informationon the population of organisations in the water sector,together with the low response rate means that thestandard errors are large.Civil Engineers account for the largest number ofvacancies by a considerable margin, with 438 positionsestimated to be currently unfilled (20 per cent of totalvacancies for the sector). The highest vacancy rate,however, is for Chemists, with 21 per cent of positionscurrently reported to be unfilled, with ElectricalEngineers and Civil Engineers having the next highestvacancy rates. In total there are estimated to be 2,000vacant positions amongst the organisations surveyed.Projected Future GapsTable 3.18 sets out the estimated employmentby occupation of the non-WSAA water sector in2018. Where estimated 2018 employment was notcompleted by the respondent it has been assumedthat employment will remain at its current level. Theseresults are presented on a population basis for thesurvey’s sample frame. As with the estimate for totalemployment, these estimates should be treated withcaution, as the combination of a lack of prior informationon the population of organisations in the water sector,together with the low response rate means that thestandard errors are large.Total employment is projected to increase by just over9,000, or 40 per cent, from its current level. The highestprojected growth rate for an occupation is for ‘PublicHealth Professionals’ with employment projected togrow by over 400 per cent, albeit from a very low base.The next highest growth rates are for EnvironmentalEngineers (100 per cent) and Civil Engineers (97 perICE WaRM • <strong>National</strong> <strong>Skills</strong> <strong>Audit</strong> (Phase One) Report 35
Table 3.16: Estimated total sampled (non-WSAA) water sector employmentManagers and AdministratorsAWA MembersLocalGovernmentTotal (a)EmploymentCorporate Manager 410 69 507Operational Manager 883 271 1,200Engineer - ProfessionalsCivil Engineer 1,760 521 2,288Mechanical Engineer 362 51 415Electrical Engineer 527 0 528Process/Chemical Engineer 811 17 828Environmental Engineer 353 35 399Science/Technical - ProfessionalsEnvironmental professional 281 81 675Public Health Professionals 11 0 11Chemist 147 51 200Engineer - ParaprofessionalsCivil Engineering Paraprofessional 266 624 890Mechanical Engineering Paraprofessional 173 35 208Electrical Engineering Paraprofessional 658 0 659Environmental Paraprofessional (Scientific) 32 86 118Science/technology - ParaprofessionalsEnvironmental Paraprofessional 47 53 132Public Health Paraprofessional 0 0 0Chemist Paraprofessional 84 86 169Trades and Related WorkersElectrician 334 121 460Electronic Instrument Tradesperson 201 17 218Fitter 978 191 1,175Metal fabricator (incl. boilermakers) 152 0 158Metal casting and forging trades (incl blacksmiths) 0 0 0Plumber 316 1,291 1,608Apprentice 191 293 488OperatorsConstruction and Maintenance 415 2,052 2,520<strong>Water</strong> Industry Operator 219 2,268 2,510Process/production workers 2,050 921 2971Business supportProfessionals 739 191 998Paraprofessionals 742 762 1,553Total 13,143 9,790 22,933Note: (a) The total also includes responses from catchment management authorities, natural resource management organisations, andtwo state government agencies.36 ICE WaRM • <strong>National</strong> <strong>Skills</strong> <strong>Audit</strong> (Phase One) Report
Table 3.17: Estimated current vacancies for sampled (non-WSAA) water sector employeesManagers and AdministratorsTotal (a)PositionsVacancies(number)Vacancies(per cent)Corporate Manager 572 65 11.3Operational Manager 1,310 110 8.4Engineer - ProfessionalsCivil Engineer 2,726 438 16.1Mechanical Engineer 478 63 13.3Electrical Engineer 642 114 17.7Process/Chemical Engineer 914 85 9.3Environmental Engineer 457 58 12.6Science/Technical - ProfessionalsEnvironmental professional 764 88 11.6Public Health Professionals 11 0 0.0Chemist 253 53 20.9Engineer - ParaprofessionalsCivil Engineering Paraprofessional 1,030 140 13.6Mechanical Engineering Paraprofessional 248 40 16.0Electrical Engineering Paraprofessional 758 99 13.1Environmental Paraprofessional (Scientific) 118 0 0.0Science/technology - ParaprofessionalsEnvironmental Paraprofessional 132 0 0.0Public Health Paraprofessional 0 0 0.0Chemist Paraprofessional 169 0 0.0Trades and Related WorkersElectrician 535 75 14.1Electronic Instrument Tradesperson 241 22 9.2Fitter 1,220 45 3.7Metal fabricator (incl. boilermakers) 158 0 0.0Metal casting and forging trades (incl blacksmiths)Plumber 1,656 48 2.9Apprentice 506 18 3.5OperatorsConstruction and Maintenance 2,584 64 2.5<strong>Water</strong> Industry Operator 2,750 240 8.7Process/production workers 2,974 3 0.1Business supportProfessionals 1,089 91 8.4Paraprofessionals 1,602 49 3.1Total 25,896 2,009 7.8Note: (a) This column records total positions, defined as total current employment plus total current vacancies.ICE WaRM • <strong>National</strong> <strong>Skills</strong> <strong>Audit</strong> (Phase One) Report 37
Table 3.18: Projected total (non-WSAA) water sector employment by 2018Managers and AdministratorsCurrentEmployment2018EmploymentChange(number)Corporate Manager 507 557 51Operational Manager 1,200 1,521 321Engineer - ProfessionalsCivil Engineer 2,288 4,527 2,239Mechanical Engineer 415 745 331Electrical Engineer 528 817 288Process/Chemical Engineer 828 1,147 319Environmental Engineer 399 799 400Science/Technical - ProfessionalsEnvironmental Professional 675 1,044 369Public Health Professionals 11 56 45Chemist 200 335 135Engineer - ParaprofessionalsCivil Engineering Paraprofessional 890 1,410 520Mechanical Engineering Paraprofessional 208 302 94Electrical Engineering Paraprofessional 659 978 319Environmental Paraprofessional (Scientific) 118 184 66Science/technology - ParaprofessionalsEnvironmental Paraprofessional 132 148 15Public Health Paraprofessional 0 9 9Chemist Paraprofessional 169 241 71Trades and Related WorkersElectrician 460 661 201Electronic Instrument Tradesperson 218 332 113Fitter 1,175 1,194 19Metal fabricator (incl. boilermakers) 158 150 -7Metal casting and forging trades (incl blacksmiths) 0 0 0Plumber 1,608 2,290 682Apprentice 488 567 79OperatorsConstruction and Maintenance 2,520 2,631 111<strong>Water</strong> Industry Operator 2,510 3,105 595Process/production workers 2971 3,080 109Business supportProfessionals 998 1,175 178Paraprofessionals 1,553 2,025 472Total 22,933 32,030 9,09738 ICE WaRM • <strong>National</strong> <strong>Skills</strong> <strong>Audit</strong> (Phase One) Report
cent). In absolute numbers the largest change is for CivilEngineers, with over 2,200 additional positions expectedto be created by 2018.The final component of the gap analysis was theproportion of current employees who may reasonablybe expected to have retired by 2018 (for the purposesof this gap analysis employees who leave the sectorto another job or for non-retirement reasons arenot considered). This estimate is subject to greateruncertainty than the overall ‘population’ estimates, asnot only are there uncertainties related to the ‘grossingup’ of the estimates, but assumptions need to be madeabout likely retirement rates. In the absence of betterinformation, it was assumed that in any given year eightper cent of those aged 55 and over will retire (based onABS data).Overall, as shown in Table 3.19, the projected job growthout to 2018 was the most significant driver of the totalnumber of additional water sector employees needed,accounting for almost 70 per cent. Current vacanciesand projected retirements each account for about 15 percent of the additional employees needed.A somewhat more speculative estimate of totaladditional employee needs can be made by includinga rough estimate of total resignations which lead to anemployee leaving the water sector. This was calculatedfrom estimated employment in each occupation(assuming straight-line growth between now and2018); turnover rates by three-digit ASCO occupationgroups sourced from the ABS’ Labour Mobility Survey(unfortunately these data relate to the 2002 surveyrather than the most recent 2006 survey, as thiswas the only version available to the researchers indisaggregated form at the time of the analysis), and theassumption that 20 per cent of those leaving a job inthe water sector (for non-retirement reasons) will leavethe sector (this is the assumption made in the WSAAreport).These assumptions lead to total vacancies caused byresignations over the 10 years to 2018 of 4,586, morethan twice the employee loss due to retirement. Thispicture is distorted somewhat by the extremely highturnover rates of two of the operators categories,‘Mining, Construction and Related Labourers’ which hadan annual resignation rate of 19 per cent and ‘ProcessWorkers’ with an annual resignation rate of 16 per cent.If these two occupations are excluded from the analysis,then the impact of resignations becomes similar to thatof retirements (2,468 employees over the 10 years forresignations compared to 2,032 retirements).ICE WaRM • <strong>National</strong> <strong>Skills</strong> <strong>Audit</strong> (Phase One) Report 39
Table 3.19: Projected total sampled (non-WSAA) additional water sector employees needed by 2018CurrentEmploymentCurrentVacancies(number)ProjectedJob Growth(number)ProjectedretirementsProjectedresignationsTotalAdditionalEmployeesManagers and AdministratorsCorporate Manager 507 65 51 99 86 215Operational Manager 1,200 110 321 225 155 656Engineer - ProfessionalsCivil Engineer 2,288 438 2,239 242 282 2,919Mechanical Engineer 415 63 331 53 48 447Electrical Engineer 528 114 288 81 57 483Process/Chemical Engineer 828 85 319 119 84 522Environmental Engineer 399 58 400 5 49 462Science/Technical - ProfessionalsEnvironmental professional 675 88 369 18 48 475Public Health Professionals 11 0 45 2 45Chemist 200 53 135 24 15 211Engineer - ParaprofessionalsCivil Engineering Paraprofessional 890 140 520 92 142 752Mechanical Engineering Paraprofessional 208 40 94 18 32 152Electrical Engineering Paraprofessional 659 99 319 65 101 484Environmental Paraprofessional (Scientific) 118 0 66 19 0 85Science/technology - ParaprofessionalsEnvironmental Paraprofessional 132 0 15 28 27 43Public Health Paraprofessional 0 0 9 0 0 9Chemist Paraprofessional 169 0 71 15 40 86Trades and Related WorkersElectrician 460 75 201 65 92 341Electronic Instrument Tradesperson 218 22 113 28 45 164Fitter 1,175 45 19 98 126 161Metal fabricator (incl. boilermakers) 158 0 -7 13 23 6Metal casting and forging trades (inclblacksmiths)0 0 0 0 0 0Plumber 1,608 48 682 121 118 851Apprentice 488 18 79 6 56 102OperatorsConstruction and Maintenance 2,520 64 111 148 1,079 323<strong>Water</strong> Industry Operator 2,510 240 595 364 287 1,199Process/production workers 2971 3 109 66 1,039 179Business supportProfessionals 998 91 178 85 183 537Paraprofessionals 1,553 49 472 148 369 1,038Total 22,933 2,009 9,097 2,246 4,586 17,93840 ICE WaRM • <strong>National</strong> <strong>Skills</strong> <strong>Audit</strong> (Phase One) Report
3.4 Analysis of Secondary Sector DataThis section provides a snapshot of the workforceemployed in the national water industry in Australia interms of its occupation, skill and structure. It identifieskey occupations in the sectors that make up thewater industry. The demographic description of peopleemployed in the key occupations is also provided.The analysis uses data from 2006 Census of Populationand Housing.Industry classes related to water industryIn the <strong>Australian</strong> and New Zealand Standard IndustryClassification (ANZIC) the economic activities of thewater industry are generally included in the followingtwo industry classes:• <strong>Water</strong> Supply (ANZSIC code 2811)• Sewerage and Drainage Services (ANZSIC code2812).However, there is a range of business activity thatmay not be predominantly related to water but isnevertheless critical provider of services to waterinfrastructure. The industry classes in this group include:• Other Agriculture and Fishing Support Services(ANZSIC code 0529)• Agricultural Machinery and Equipment Manufacturing(ANZSIC code 2461)• Other Heavy and Civil Engineering Construction(ANZSIC code 3109).Of these, the services provided by the last are likelyto be the most critical as far as construction of waterinfrastructure is concerned, though the proportion ofactivities in this sector that is water-related is difficultto tell. The water industry will be competing with otherindustries, such as mining and construction, for theservices provided by this sector. Nevertheless, theactivities are considered to provide significant inputinto the water industry, and therefore the sector wasincluded in the analysis.Data from the 2006 Census of Population and Housingwere used to:• Describe the occupational distribution of theworkforce in each industry sector.• Describe the qualifications profile of the workforce ineach sector by occupation.• Identify key occupations common to all sectors thatmake up the water industry.• Describe the demographic profile of the workforce ineach key occupation.Employment in <strong>Water</strong> Industry inAustralia by Industry and OccupationTable 3.20 shows total employment in the three industrysectors which either predominantly or substantiallyprovided inputs into the <strong>Australian</strong> water sector in2006. A total of about 55,000 people were employedTable 3.20: <strong>Water</strong> sector by occupation and industry, persons employed, Australia 2006IndustryOccupation group<strong>Water</strong> SupplySewerage &DrainageOther Heavy & Civil EngineeringConstruction*TotalManagers 2,660 140 3,790 6,590Professionals 4,700 210 3,490 8,400Technicians &Trades 3,250 400 10,230 13,880Community and PersonalServices70 10 90 170Clerical & Administration 4,560 270 4,460 9,290Sales 210 10 390 610Machinery Operators & Drivers 2,790 330 3,710 6,830Labourers 2,180 290 6,380 8,850All 20,420 1,660 32,540 54,620Source: Unpublished 2006 Census. Scope: Employed persons aged 15-69 years.Note: The numbers in this table have been rounded to the nearest 10. The row sums may not add to the margin totals becauseof rounding errors.Note: The data for Heavy and Civil Engineering are included in full, but marked with an asterisk (*) to indicate that an undefinedproportion of this class may be considered attributable to the water sector.ICE WaRM • <strong>National</strong> <strong>Skills</strong> <strong>Audit</strong> (Phase One) Report 41
in these three sectors, with the largest number in otherheavy and civil engineering construction. Sewerage anddrainage was the smallest sector employing less than1,700 people.Table 3.21 shows the occupational distribution ofemployment. About a quarter of all people workingin the water industry were either managers orprofessionals and another quarter comprised techniciansor tradespeople. The industry also employed significantnumbers of people in machinery operators and driversand labourers’ occupations.Although some similarities existed in the occupationaldistribution with each industry sector, there aresome significant differences. For example, the watersupply sector employed a much higher proportion ofprofessionals and correspondingly lower proportionof technicians and tradespersons than the other twosectors.Tables 3.22 to 3.24 show qualifications by occupationin each industry segment. These tables include moreoccupational detail than shown in previous tablesto highlight key occupations within each segment.Although some key occupations are common acrossthe three sectors, others are unique to a segment.For example, the <strong>Water</strong> Supply segment employed asignificant number of chemical and materials engineersand environmental scientists and geologists but hardlyany in these occupations are employed in the other twosegments. The water supply segment also employed asignificant number of science technicians.While the qualifications profile of the workforce in theSewerage and Drainage segment is generally similarto that of the workforce in Other Heavy and CivilEngineering Construction segment, it is quite differentfrom that of the workforce in the <strong>Water</strong> Supply segment.The <strong>Water</strong> Supply segment employed a higher proportionof people with qualifications, and furthermore theirqualifications were generally at higher levels.All three segments employed substantial numbersof labourers, about 8,900 in total. The proportion oflabourers in <strong>Water</strong> Supply, Sewerage and Drainage andOther Heavy and Civil Engineering Construction was 11,17 and 20 per cent, respectively.The key occupations common across the three industrysegments are:• Construction and engineering managers• Civil engineers• Metal fitters and machinists• Plumbers• Electricians• Stationary and mobile plant operators.Table 3.21: Occupational distribution in water industry by industry sector, Australia, 2006 (%)IndustryOccupation group<strong>Water</strong>SupplySewerage &DrainageOther Heavy & Civil EngineeringConstruction*TotalManagers 13 8 12 12Professionals 23 13 11 15Technicians &Trades 16 24 31 25Community and Personal Services 0 1 0 0Clerical & Administration 22 16 14 17Sales 1 1 1 1Machinery Operators & Drivers 14 20 11 13Labourers 11 17 20 16All 100 100 100 100Source: Unpublished 2006 Census. Scope: Employed persons aged 15-69 years.Note: The data for Heavy and Civil Engineering are included in full, but marked with an asterisk (*) to indicate that anundefined proportion of this class may be considered attributable to the water sector.42 ICE WaRM • <strong>National</strong> <strong>Skills</strong> <strong>Audit</strong> (Phase One) Report
Table 3.22: Qualifications in water supply industry by occupation, employed persons, Australia, 2006 (%)Occupation group Postgrad BachLevel of educationDip/AdvdipCertIII/IVAllCert I/II None % No.Managers 22 33 13 15 3 14 100 2,660Construction & engineering 23 46 13 9 2 7 100 500Others 22 30 13 17 3 15 100 2,160Professionals 18 49 11 9 2 11 100 4,360Business, HR & marketing 16 40 13 11 4 16 100 1,320Architects, planners, surveyors etc 12 32 22 14 5 16 100 230Chemical & materials 22 59 6 10 0 3 100 250Civil engineering 23 61 8 3 1 4 100 1,120Other engineering 20 65 6 5 3 1 100 400Environment scientists & geologists 21 47 5 11 3 13 100 540ICT professionals 11 37 17 12 2 22 100 500Other professionals 24 42 8 13 2 12 100 350Technicians/tradespersons 2 6 12 57 3 20 100 3,250Science techs 7 26 27 18 3 20 100 360Arch., building & surveying techs 2 4 12 46 0 36 100 260Metal fitters & machinists 0 1 3 79 3 14 100 610Plumbers 0 0 1 62 5 31 100 480Electricians 0 1 6 81 2 10 100 430Other technicians/tradespersons 3 8 19 48 3 18 100 1,100Other occupations (a) 4 11 11 19 7 47 100 4,830Machinery operators & drivers 1 3 4 39 7 45 100 2,790Stationary & mobile plant operators 1 4 5 43 7 40 100 2,300Other machinery operators & drivers 0 1 1 22 6 69 100 500Labourers 1 1 3 27 6 61 100 2,180All 9 20 10 26 5 31 100 20,420Source: Unpublished 2006 Census. Scope: Employed persons aged 15–69 years.Note: (a) Includes community and personal workers, clerical and administrative workers and Sales workers. The numbers inthis table have been rounded to the nearest 10. The row sums may not result in the margin totals because of rounding errors.ICE WaRM • <strong>National</strong> <strong>Skills</strong> <strong>Audit</strong> (Phase One) Report 43
Table 3.23: Qualifications in sewerage and drainage industry by occupation, employed persons, Australia, 2006 (%)Occupation group Postgrad Bach Dip/Adv dipLevel of educationCertIII/IVAllCert I/II None % No.Managers 18 29 17 20 1 16 100 140Professionals 17 44 13 11 1 15 100 210Civil engineering 21 54 6 12 0 7 100 70Other professionals 15 40 16 10 2 19 100 140Technicians/tradespersons 1 2 8 66 2 22 100 400Metal fitters & machinists 4 0 4 74 5 12 100 70Plumbers 0 0 3 70 0 27 100 150Electricians 0 0 0 89 0 11 100 40Other technicians/tradespersons 0 6 17 49 3 25 100 130Other occupations (a) 0 10 10 17 12 50 100 290Machinery operators & drivers 0 2 4 32 6 56 100 330Labourers 0 1 3 28 6 62 100 290All 4 11 8 33 5 39 100 1,660Source: Unpublished 2006 Census. Scope: Employed persons aged 15–69 years.Note: (a) Includes community and personal workers, clerical and administrative workers and Sales workers. The numbers inthis table have been rounded to the nearest 10. The row sums may not result in the margin totals because of rounding errors.44 ICE WaRM • <strong>National</strong> <strong>Skills</strong> <strong>Audit</strong> (Phase One) Report
Table 3.24: Qualifications in other heavy and civil engineering construction industry by occupation, employed persons,Australia, 2006 (%)Level of educationOccupation group Postgrad Bach Dip/Adv dipCertIII/IVAllCert I/II None % No.Managers 10 25 13 28 2 22 100 3,790Construction & engineering 7 31 12 29 2 19 100 1,310Others 12 21 14 27 2 24 100 2,480Professionals 11 50 14 11 3 12 100 3,490Business, HR & marketing 11 41 15 14 2 17 100 900Architects, planners, surveyors etc 0 32 35 12 0 21 100 170Civil engineering 11 64 10 3 3 9 100 910Other engineering 12 62 10 8 3 5 100 790Occupational & environmental health 7 12 24 43 0 14 100 140ICT professionals 12 45 14 12 1 16 100 390Other professionals 12 32 14 17 7 17 100 190Technicians/tradespersons 1 3 5 65 3 23 100 10,230Arch., building & surveying techs 1 5 7 45 4 38 100 870Other building & engineering techs 4 7 19 51 3 16 100 860Structural steel & welding trade 0 1 1 80 2 15 100 1,660Metal fitters & machinists 1 1 3 84 2 10 100 1,560Plumbers 1 2 3 52 4 39 100 1,290Other construction tradespersons 0 3 2 65 4 26 100 540Electricians 0 1 4 84 1 10 100 1,090Other Electrotechnology & telecom 0 2 6 53 6 33 100 1,430Other technicians/tradespersons 0 6 9 52 4 29 100 930Other occupations (a) 3 10 11 19 8 49 100 4,940Machinery operators & drivers 0 1 2 28 6 63 100 3,710Stationary & mobile plant operators 0 1 2 30 6 62 100 2,590Other machinery operators & drivers 0 2 2 25 6 65 100 1,120Labourers 0 2 3 27 8 60 100 6,380All 3 11 7 36 5 38 100 32,540Source: Unpublished 2006 Census. Scope: Employed persons aged 15–69 years.Note: (a) Includes community and personal workers, clerical and administrative workers and Sales workers. The numbers in thistable have been rounded to the nearest 10. The row sums may not result in the margin totals because of rounding errors.ICE WaRM • <strong>National</strong> <strong>Skills</strong> <strong>Audit</strong> (Phase One) Report 45
Table 3.25 shows the age profile of people employedin the key occupations across all sectors and Table 3.26shows the gender profile.About 1,850 construction and engineering managerswere employed in the three segments in 2006. Mostwere employed in the <strong>Water</strong> Supply and Other Heavyand Civil Engineering Construction segments. Only 40were employed in the Sewerage and Drainage sector.While the <strong>Water</strong> Supply sector employed a higherproportion of engineering than construction managers,the Other Heavy and Civil Engineering Constructionsector employed relatively more construction managers.It is interesting to note the difference in thequalifications held by these managers in the twosegments <strong>Water</strong> Supply and Other Heavy and CivilEngineering Construction. The qualifications of managersin <strong>Water</strong> Supply sector are generally at higher levels:70 per cent had higher education qualifications (23per cent at the postgraduate level) and seven per centhave no qualifications. In contrast, in Other Heavy andCivil Engineering Construction, only 37 per cent hadhigher education qualifications and 19 per cent had noqualifications.Most construction and engineering managers were male(94 per cent) and 75 per cent were aged 35–64 years.The generally older age profile reflects the fact thatpeople progress to managerial positions later in theircareer.The single biggest professional occupation in the threesectors is that of civil engineers. About 2,100 wereemployed in 2006, and most (about 80 per cent) hadhigher education qualifications. Once again, a relativelyhigher proportion of those working in the <strong>Water</strong> Supplysegment had higher education qualifications.About nine per cent of civil engineers were female. Theage profile of civil engineers approximates that for theworkforce as a whole, except at younger ages. As mostengineers are tertiary qualified, relatively few of themare likely to be aged 15–19 years which means a higherproportion are aged 25–34 years.Although a range of tradespersons are employed in thethree sectors, metal fitters and machinists, plumbersand electricians are the most common. About 2,300metal fitters and machinists, 1,900 plumbers and1,600 electricians were employed. The category OtherTable 3.25: Age by key occupations, employed persons in water industry, Australia, 2006 (%)Age (years)Occupation 15–19 20–34 35–44 45–54 55–64 65 or over TotalConstruction & engineering managers 5 18 29 29 18 2 100Civil engineers 10 29 22 21 15 2 100Metal fitters & machinists 16 22 26 23 12 1 100Plumbers 24 24 22 18 10 1 100Electricians 24 23 22 19 10 1 100Stationary & mobile plant operators 10 23 28 25 13 1 100All occupations 17 22 24 23 13 2 100Source: Unpublished 2006 Census. Scope: Employed persons aged 15–69 years.Table 3.26: Gender by key occupations, employed persons in water industry, Australia, 2006 (%)Occupation Males Females AllConstruction & engineering managers 94 6 100Civil engineers 91 9 100Metal fitters & machinists 99 1 100Plumbers 99 1 100Electricians 99 1 100Stationary & mobile plant operators 96 4 100All occupations 54 46 100Source: Unpublished 2006 Census. Scope: Employed persons aged 15–69 years.46 ICE WaRM • <strong>National</strong> <strong>Skills</strong> <strong>Audit</strong> (Phase One) Report
Heavy and Civil Engineering Construction employed arelatively higher number of metal fitters and machinistscompared to the other two sectors, and Sewerageand Drainage employed relatively more plumbers andfewer electricians. Most metal fitters and machinistsand electricians had qualifications at the Certificate IIIor IV level but about 10 per cent had no qualifications.In contrast, only about 60 per cent of plumbers had aqualification at Certificate III or higher level and 36 percent had no qualifications.Almost all tradespersons employed in the three tradeoccupations are male. Metal fitters and machinistsare generally older than electricians and plumbers.In particular, almost a quarter of all plumbers andelectricians were under the age of 25 years. This isperhaps an indication of higher rate of apprenticeshiptraining these two occupations.About 5,100 stationary and mobile plant operators wereemployed in the three sectors. While about half of themhad no qualifications, most of the rest had a CertificateIII or IV. Once again, a relatively higher proportion ofthose who worked in the <strong>Water</strong> Supply segment hadqualifications.Most stationary and mobile plant operators are male.Relatively fewer of them are aged 15–19 years comparedto the workforce as a whole but by the same token moreof them are aged 35–54 years.ICE WaRM • <strong>National</strong> <strong>Skills</strong> <strong>Audit</strong> (Phase One) Report 47
4 Analysis of Results4.1 Combining the WSAAand Current SurveysThese projected gaps can be mapped against qualificationlevels, although in many cases an individual’s level ofexperience can change the level of qualification requiredfor a role. For example, in order to fill an Engineer levelposition a recent graduate would require at least a Bachelorsdegree; however, where an individual has significantexperience in the field a Diploma may be sufficient.It is also the case that during periods of high demandfor particular occupations employers will often alter thequalification level that they require for a given position.Table 4.1 sets out the current ‘gaps’ (unfilled vacancies)in the non-WSAA water segment by job family mappedagainst typical minimum qualification levels. As with allof the results of this survey, the estimates are subject toa considerable degree of uncertainty.The largest area of demand is for degree level qualificationsand above, accounting for almost half of the currentrequirement, although there is also considerable unmetdemand for those with vocational qualifications.Table 4.2 sets out the projected number of new employeesrequired by the (non-WSAA) water segment by 2018combining the estimates of current unfilled vacancies,projected retirements, and projected jobs growth. Thisestimate is subject to greater uncertainty than the overall‘population’ estimates, as not only are the uncertaintiesrelated to the ‘grossing-up’ of the estimates, butassumptions need to be made about likely retirementrates. These estimates do not include estimates of thenumbers of new employees needed to replace thoseleaving the water sector for a reason other than retirement,such as those shifting to employment in anotherindustry.It is projected based on the survey results that almost8,000 employees with degree level qualifications orhigher will be required by 2018, 46 per cent of the total.A further 9,200 individuals with vocational level qualificationsmay be required, although this has assumed thatall of the workers in the job family ‘operators’ will requiresome form of VET qualification (which may not be thecase).As common job families have been used between thissurvey and the survey of WSAA members the two setsof results can be combined. The results are not perfectlycomparable as the WSAA survey was undertaken in2007 and, therefore, 10 year projections refer to 2017rather than 2018; however, this should not alter any ofthe findings significantly.Table 4.3 sets out the results of the WSAA survey by jobfamily and qualification. The WSAA members requirementsfor their future workforce are slightly less skillintensive than those reported in the survey of the widerwater sector, with 42 per cent of the required additionalemployees requiring a Bachelors degree or above (42 percent of the total).Table 4.4 sets out the combined results from the twosurveys. Over the next 10 years it appears that the watersector will need an additional 26,000 employees, 11,404of whom are projected to require a bachelors degree orabove. The actual requirements may be greater than thisif booming sectors such as mining and infrastructuredevelopment attract skilled employees currently workingin the water sector to shift industry.Table 4.1: Estimated current vacancies for non-WSAA segment water sector employees by job family and qualification<strong>Australian</strong>QualificationsFrameworkCert II Cert III Cert IV DiplomaAdvDiplomaAssociateDegreeVoc GradCertVoc GradDipBachelor Grad Cert Grad Dip Masters DoctorateManagers 175EngineerProfessionalsScience/TechnicalProfessionals758141EngineerParaprofessionals279Science/technologyParaprofessionalsTrades and RelatedWorkers208Operators 307Business support 49 9148 ICE WaRM • <strong>National</strong> <strong>Skills</strong> <strong>Audit</strong> (Phase One) Report
Table 4.2: Projected total non-WSAA additional water sector employees needed by 2018<strong>Australian</strong>QualificationsFrameworkCert II Cert III Cert IV DiplomaAdvDiplomaAssociateDegreeVoc GradCertVoc GradDipBachelor Grad Cert Grad Dip Masters DoctorateManagers 870EngineerProfessionalsScience/TechnicalProfessionals4,834731EngineerParaprofessionalsScience/technologyParaprofessionals1,473139Trades and RelatedWorkers1,626Operators 1,701Business support 354 669Table 4.3: Projected total additional water sector employees required by WSAA members by 2017<strong>Australian</strong>QualificationsFrameworkCert II Cert III Cert IV DiplomaAdvDiplomaAssociateDegreeVoc GradCertVoc GradDipBachelor Grad Cert Grad Dip Masters DoctorateManagers 735EngineerProfessionalsScience/TechnicalProfessionals1,277307EngineerParaprofessionalsScience/technologyParaprofessionals585175Trades and RelatedWorkers823Operators 1,678Business support 1,792 1,284ICE WaRM • <strong>National</strong> <strong>Skills</strong> <strong>Audit</strong> (Phase One) Report 49
Table 4.4: Projected total additional water sector employees required by 2018<strong>Australian</strong>QualificationsFrameworkCert II Cert III Cert IV DiplomaAdvDiplomaAssociateDegreeVoc GradCertVoc GradDipBachelor Grad Cert Grad Dip Masters DoctorateManagers 1,847EngineerProfessionalsScience/TechnicalProfessionals6,6321,104EngineerParaprofessionalsScience/technologyParaprofessionals2,332380Trades and RelatedWorkers2,909Operators 5,783Business support 2,830 1,821Total 5,783 2,909 5,542 11,40450 ICE WaRM • <strong>National</strong> <strong>Skills</strong> <strong>Audit</strong> (Phase One) Report
4.2 Aggregation of <strong>Audit</strong> Findings<strong>Water</strong> Industry Workforce Profile Current/2009WSAA SACES CEET (2006 data)• <strong>Water</strong> utilities have arelatively old workforceand therefore a relativelylarge number ofimpending retirements,and issues aroundknowledge transfer andsuccession managementstrategies.• There is a high turnoverof civil engineers, whichaccounts for about 10 percent of the water utilitiesworkforce.• The current workforceis highly experienced,but relatively inflexible.There is a dominanceof permanent, full-time,older and long-tenuredemployees.• Characterised by full-timeemployment. Only 3 per centof employees are engaged on apart-time basis, with over 33 percent of part time employees inbusiness support roles.• Operators is the most commonjob family at 34 per cent of total.• A reasonably highly skilledemployment profile, 22 per centin a professional occupation, 9per cent in a paraprofessionaloccupation and 18 per centtradespersons. Civil engineersalone account for 10 per cent.• The workforce is relativelymature, with 23 per centaged over 45. EnvironmentalParaprofessionals have the oldestprofile with 57 per cent agedover 45, followed by CorporateManagers and OperationsManagers. EnvironmentalEngineers are the youngestoccupation, with only 4 per centaged over 45.• Managers and Science/Technology Paraprofessionalshave very aged occupationprofiles, whereas for ScienceProfessionals; Tradespersons andOperators, fewer than 20 percent are aged over 45.• About 25 per cent of all people working in the waterindustry were either managers or professionals andanother 25 per cent were technicians or tradespeople.• The industry also employs significant numbers ofpeople in machinery operators and drivers and labourersoccupations.• The <strong>Water</strong> Supply segment employed a much higherproportion of professionals and correspondingly lowerproportion of technicians and tradespersons than theother two sectors (Sewage & Drainage and Heavy &Civil Engineering Construction) and furthermore theirqualifications were generally at higher levels.• The <strong>Water</strong> Supply segment employs a significantnumber of chemical and materials engineers andenvironmental scientists and geologists but hardly any inthe other two segments. This segment also employed asignificant number of science technicians.• Most construction and engineering managers were male(94 per cent) and 75 per cent were aged 35–64 years.• The single biggest professional occupation in the threesectors is that of civil engineers and 80 per cent hadhigher education qualifications.• About 9 per cent of civil engineers were female.• The age profile of civil engineers approximates that forthe workforce as a whole.• Of tradespersons, metal fitters and machinists,plumbers and electricians are the most common.• Metal fitters and machinists are generally older thanelectricians and plumbers.• Mobile plant operators were employed in the threesectors. While about half of them had no qualifications,most of the rest had a Certificate III or IV. A relativelyhigher proportion of those who worked in the <strong>Water</strong>Supply sector had qualifications.• Most stationary and mobile plant operators are male.• All three segments employ substantial numbers oflabourers.Summary comments• WSAA segment most closely identified in 2006 Census data as water supply and sewerage and drainage services, confirmed inCEET analysis.• Non-WSAA segment shows differences from WSAA segment, including lower age profile, much lower proportion of businesssupport staff.• Heavy Civil Engineering and Construction is relevant to water sector and other sectors as well.ICE WaRM • <strong>National</strong> <strong>Skills</strong> <strong>Audit</strong> (Phase One) Report 51
Employment Gaps – Qualifications 2018WSAA SACES CEET• Gaps by job roles not available for 2008.• There is a high turnover of civilengineers, which accounts for about10 per cent of the water utilitiesworkforce.• There is a sizeable workforce gapforecast for the future (8,656). This willbe driven predominantly by retirementsand resignations and to a lesser extentby increasing demand.• In addition to current skills deficits,there will be other skills which willbecome increasingly important,specifically: asset management, projectmanagement, and commercial acumen/cost management.• The SACES survey provides current gaps by job roles(see Section 3.3) and gaps by job role and qualificationsboth current and 2018 (see Section 4.1).• The largest area of demand is for degree levelqualifications and above accounting for almost half of thecurrent requirement, although there is also considerableunmet demand for those with vocational qualifications.• The highest projected growth rate for an occupationis for ‘Public Health Professionals’ with employmentprojected to grow by over 40 per cent, albeit froma very low base. The next highest growth rates arefor Environmental Engineers (100 per cent) and CivilEngineers (97 per cent). In absolute numbers the largestchange is for Civil Engineers, with over 2,200 additionalpositions required by 2018.• It is projected based on the survey results that almost8,000 employees with degree level qualifications orhigher will be required by 2018, 46 per cent of thetotal. A further 9,200 individuals with vocational levelqualifications will be required.• Refer 4.1 for discussion on qualifications.• Not in scope.Summary comments• Section 4.1 specifically addresses the combination of WSAA and SACES results to determine gaps by job roles and AQFqualifications at 2018.• Range and proportions of categories of skills requirements in both segments quite similar.52 ICE WaRM • <strong>National</strong> <strong>Skills</strong> <strong>Audit</strong> (Phase One) Report
Workforce Numbers and Gap Numbers Current/2009WSAA SACES CEET (2006 data)• 19,5000 positionsin 2007.• Estimated that the sector surveyed employsroughly 23,000 employees, although a numberof parts of the water sector are not included inthis estimate. An additional 2,000 positions arevacant.• 20,420 are in <strong>Water</strong> Supply group and 1,660in Sewage and Drainage, giving a totalof over 22,000. To this must be added anundetermined proportion of the 32,540 fromHeavy and Civil Engineering Construction.Summary comments• The CEET numbers for the core water industry groups confirm the WSAA numbers of employees (19,500 of 20,240). As theSACES estimate is for a separate segment on the industry minimum, the total is over 44,000.• To this 44,000 must be added to other parts of the industry not surveyed by SACES (including Commonwealth and Stategovernments) and a proportion of Heavy and Civil Engineering Construction identified by CEET. Hence the current industry iswell in excess of 50,000 and estimated at 80,000.• 2008 gap in WSAA segment is not precisely estimated due to differences in survey dates and projected movements over2007 to 2009.WSAA SACES CEET2018• The WSAA survey determined a mostlikely scenario of an aggregate urbanutilities workforce requirement of 20,924at 2017, with a gap of 8,656 employees.• There is a sizeable workforce gap forecastfor the future (8,656). This will be drivenpredominantly by retirements andresignations and to a lesser extent byincreasing demand.• In addition to current skills deficits, therewill be other skills which will becomeincreasingly important, specifically: assetmanagement, project management, andcommercial acumen/cost management.• The SACES survey determined an employmentrequirement at 2018 of 34,000, comprisingemployees of AWA members and local government,with a gap requiring 18,000 employees.• Total employment is projected to increase by justover 9,000, or 40 per cent.• For the current employees who may be retired by2018, it was assumed that in any given year 8 percent of those aged 55 and over will retire (based onABS data).• Overall, the projected job growth out to 2018 is themost significant driver, accounting for almost 70 percent. Current vacancies and projected retirementseach account for about 15 per cent of the additionalemployees needed.• Not in scope.Summary comments• For WSAA, growth is very modest; for SACES growth is the most significant factor.• The impacts of retirements and resignations are much greater than the numbers indicate, as the lost staff are typically themost senior, most experienced and represent the corporate memory of their organisations.ICE WaRM • <strong>National</strong> <strong>Skills</strong> <strong>Audit</strong> (Phase One) Report 53
Recruiting and Retaining - GeneralWSAA SACES CEET• The largest source of employees is other industries, ahead of sourcingemployees from within the water industry.• There was shown to be some movement within the organisationsthemselves.• The sources specified under the ‘other’ category included recruiters,personal networks, general trades, recent immigrants to Australia, localcommunity, and the private sector.• The segments that reported most commonly recruiting employees usinga 457 visa are the local and regional governments with 69 per cent andmanufacturers and distributors in the private sector (60 per cent). About33 per cent in the consultants and contractors/ constructors groupingshad recruited using a 457 visa. The three state government and the twoeducation and research respondents all said that they had not sourcedany employees in this way.• The occupational group which is most difficult both to recruit and toretain is professional engineers, with nearly half of the answers withregard to recruitment difficulties, and 40 per cent of retention problems.• The second key group which employees answered that they had themost difficulty recruiting and retaining is that of science/technicalprofessionals.• Nine organisations claimed to experience difficulty in recruitingmanagers, and two in retaining them. This issue mostly affected the localand regional government organisations and retaining managers seemedto be less of a problem overall.• In trades, the private sector experienced the most difficulty in recruitingemployees, particularly contractor/constructors and manufacturer/distributors. Retention was more problematic for contractor/constructors.• Not addresseddirectly butknown that theHeavy and CivilEngineeringConstructiongroup coversmultipleindustries, hencetransfer betweenindustries is likely.Summary comments• Interesting but insufficient data to draw significant conclusions other than confirmation of anecdotal data.Temporary skilled migration is used, but magnitude unclear.54 ICE WaRM • <strong>National</strong> <strong>Skills</strong> <strong>Audit</strong> (Phase One) Report
Recruiting and Retaining – Qualifications and/or Experience Current/2009WSAA SACES CEET• <strong>Water</strong> utilities have a relativelyold workforce and thereforea relatively large number ofimpending retirements, andissues around knowledgetransfer and successionmanagement strategies.• <strong>Water</strong>-specific qualifications are most required for newprofessional employees, and with 56 per cent of respondentsthis was a requirement for always or sometimes. Thisrequirement drops with new paraprofessional employees to42 per cent, and falls further for new tradespersons to 35 percent. Those saying that they never require their new employeesto have water-specific qualifications increases from newprofessionals (13 per cent) to new paraprofessionals (29 percent) and is highest with the new tradespeople (35 per cent).• With regard to water-specific experience, this is most stronglyrequired for new professional employees, with 92 per centof respondents answering that water-specific experience isrequired always or sometimes. This requirement drops awayto similar levels for the paraprofessional and tradespersonpositions, at 64 and 59 per cent, respectively. Those that alwaysrequire this experience does not vary greatly between thetypes of employees. However, those who answered that waterspecificexperience is never required rises from zero for newprofessional employees, to four for paraprofessionals and tonine for tradespeople.• It may be concluded from the respondents that water-specificqualifications and experience are required mostly for newprofessional employees, less so for new paraprofessionals andless again for new tradespeople. However, it is important tonote that in every employee grouping, there is a requirement bymore than 66 per cent of respondents that the new employeeshave water-specific qualifications and/or experience.• Qualifications arehigher for employeesin <strong>Water</strong> Supply incomparison to theother sectors.Summary comments• Expected responses to the SACES survey would be more revealing. Interesting that sector experience is valued more highly byemployers than qualifications, even for professional categories.ICE WaRM • <strong>National</strong> <strong>Skills</strong> <strong>Audit</strong> (Phase One) Report 55
4.3 DiscussionA survey response was received from the <strong>Australian</strong>Hydrographers <strong>Association</strong> (AHA), which is an industryrepresentative organisation. While it is not an employer,it is still a useful source of information about the peopleemployed in hydrography. The AHA provided all ofthe information requested in the survey, based on thenumber of hydrographers who are registered with them.The occupation classifications for the 350 full-timeemployees are all given as ‘environmental professional’within the broader science/technical professionalgroup. There are 20 vacant positions. There are 100employees in the 45 to 55 age bracket, and 80 in the55-and-over bracket, which amounts to 51 per cent ofthe 350 employees. Given the estimated increase inrequirements out to 2018 of 150, taking the desired totalto 500 employees, this response highlights gaps in therequirements for hydrographers.The AHA representative reported that hydrography is aparaprofessional discipline with qualifications rangingfrom a specific Hydrography Certificate IV to degrees insimilar fields such as Environmental Science. There wassaid to be “a definite skill shortage in the industry dueto the increasing demands as a result of the <strong>National</strong><strong>Water</strong> Initiative. This, along with an ageing workforceand a previous and current lack of recruitment and formaltraining programmes has compounded this problem.”Currently only one TAFE institute in NSW and theDepartment of <strong>Water</strong> in WA deliver any training inhydrography. There may well be other functional rolechanges, such as those arising from the <strong>National</strong> <strong>Water</strong>Initiative, which might impact directly or indirectly onwater management skills requirements over the nextdecade.This issue was confirmed in the initial feedback fromthe reviewing groups with membership drawn fromCommonwealth and State governments. SeveralDepartments and agencies are suffering acute shortagesof hydrographers and related professionals suchas hydrologists, hydro-geologists and groundwaterhydrologists. The Bureau of Meteorology has recentlycommenced a major programme for the <strong>National</strong> <strong>Water</strong>Initiative (referred to by AHA) on measurement of waterresources, requiring recruitment of several hundrednew staff across these skills areas, which has seriouslyexposed these current gaps.It should also be noted in this context that theseparticular gaps were not well captured in the survey data,due to the low response rates from Commonwealth andState Government Departments, agencies and relatedorganisations. This can be attributed to the very shorttime allowed for compilation and submission of surveyresponses which, given the size and complexity of theseorganisations, would have made it extremely difficult forthem to respond. Others commented that current staffshortages compounded this difficulty.An initial draft version of this report was circulated toboth the Advisory and Reference Groups for feedbackwithin a short timeframe. Some of their comments willfeed directly into the strategy report where the roles forboth groups will be more significant, and have not beenreported at this stage. The following includes commentsnot raised elsewhere in the report.Points raised in relation to the sample composition andthe limitations imposed were similar to those discussedwithin the project implementation team and reportedin summary earlier in the report. There were specificquestions on the spatial distribution of the surveyresponses, and the ability of the data to support anyanalysis of the spatial distribution of demand. Becauseof the relatively low numbers of survey respondents,they do not provide representation of all regions inall categories, and some segments of the sectorwere under-represented in the sample. There areconsequently relatively wide confidence limits even inthe overall projections that have been included and, ascommented on earlier in the report; the data really doesnot allow more detailed interrogation such as spatialdistributions.This is also reflected in questions relating to the levelsof qualifications presented as projected gaps. In allsuch tables, the data presented are the minimumqualifications normally associated with the employmentcategories identified in the gap analysis. It is possiblethat in many cases higher qualifications are considereddesirable, and in some special cases may be mandatory.For example, no qualifications above bachelor degreeappear in the tables; however, it is well known thatemployment positions in higher education and researchorganisations will require doctorates. Similarly, theentry VET qualifications are not uniform for similar jobtitles in different organisations. The data in the tables istherefore a useful guide for the sector as a whole, butmay not be strictly applicable across all segments and allorganisations.A related comment concerned the differentiationbetween competencies that are particular to the watersector and those that may be more common to arange of industries. Because the survey and analysiswere based on surrogate measures for skills andcompetencies, and that all categories were not wellrepresented in the limited sample, it is not possible forthe data to provide this level of differentiation. It willbe useful to gain a better appreciation of this point inthe consultation phase of the assignment, as it may beimportant to the development of relevant strategies.The report addresses the requirements for qualificationsand training at different qualification levels, but there isno requirement in contracting services, in registering56 ICE WaRM • <strong>National</strong> <strong>Skills</strong> <strong>Audit</strong> (Phase One) Report
water authorities or in the regulation of water utilitiesthat they have qualified staff, especially at operatorand technical/ paraprofessional level. Contractsusually require that operators are “competent” orhave “relevant training” but how this is interpretedand applied is subjective and based on internal HumanResources policies. Should these requirementsbecome mandatory, the demand for formal training andcertification of competencies will increase.The significance of the shortages and gaps to publicsafety is understated. A shortage of constructionworkers impacts on planned building programmes,whilst a shortage of trained water operators may riskpublic health. Increasingly, water peak bodies andsome government health regulators are questioning theunregulated nature of the skills required in auditing andaccountability for water service contracts.Experienced paraprofessional operators should be ableto articulate into higher education and therefore “upskill”into professional pathways. Without water-specifichigher education qualifications this is very difficult. Itmight be an achievable leap to move from the skills of awater operator to water engineer, but far more difficultto move to a general/ civil engineer.It was considered useful to clarify the differencebetween that part of the water sector covered by thetwo surveys and the estimates of the whole nationalwater sector, particularly those numbers relating to theprojections for 2018. The difference arises because itwas simply not possible to define accurately and samplethe whole sector within the practical limitations of thisaudit. Indeed it would be extremely difficult to do sowithout such limitations, as the sector boundaries aredynamic and porous, especially in multi-disciplinarycommercial organisations such as consultants andcontractors servicing variations in workloads in differentregions and different industries. For the purposes of thisanalysis a boundary was defined, a sample was takento represent the population within that boundary, andstatistical methods were applied to provide reasonableprojections of the defined population. That part of thewater sector outside the defined boundary, which isknown to exist but was not measured by the survey andanalysis, can only be estimated from known exclusions,anecdotal and secondary data, and any estimates mustbe regarded as speculative.In the case of the projections for 2018, the analysisof the part of the sector which was defined, sampledand surveyed showed that, of the estimated totalworkforce of 54,900 at that time, only 28,400 of thecurrent workforce will remain, and some 26,600 new,skilled employees will be required to meet the demand.These numbers are all derived from the analysis ofthe surveyed population. However, it is known thatthe national water sector is larger than this, thoughestimates based on anecdotal and secondary data arenecessarily approximate. These tentative estimatesfor 2018 indicate the whole sector comprising upto 100,000 employees, and a gap of some 40,000to be filled by skilled new entrants. There are manyassumptions implicit in these numbers; they arepresented only to indicate that the 2018 gap of 26,600projected from the analysis of the surveyed segment isa very conservative estimate.Much of the data reported and discussed is restricted tothe traditional functions of the water sector. These arechanging and will need to continue to do so, probablyat a faster rate into the future. Further considerationneeds to be given to future needs, for example in termsof climate change, desalination and potential untappedsources, and the related skills required. In addition, bylooking at an integrated natural resources managementapproach, the following areas become more significantin terms of knowledge and skill needs:• Biodiversity and ecosystem services• Indigenous cultural heritage• Geology• Aquatic, riparian and river health• Groundwater aquifer (confined and unconfined)health and stability• Groundwater salinity issues• Irrigation issues – water use, technical, educationand training• <strong>Water</strong> trading• Social sciences• Economics• Community.Further consideration needs to be given to the currentshape of the industry versus the future structuresneeded to meet priorities and demands. How must thewhole sector change if it is to meet these challenges?Many problems and even some of the optimal solutionsare now known, but what does the nation need to do toassemble the necessary (political), strategic, technicaland managerial skills to execute new projects, toreconfigure existing systems and generally to acceleratechange in an effort to meet changing national waterpriorities? These are questions to be considered in theconsultation activities for strategy development duringthe second phase of this assignment.ICE WaRM • <strong>National</strong> <strong>Skills</strong> <strong>Audit</strong> (Phase One) Report 57
5 Outcomes/Issues5.1 Current Needs and GapsA first order estimate of water industry employee needsand gaps is determined by the combination of the WSAAsurvey and the May 2008 survey (non-WSSA members)conducted for this <strong>Skills</strong> <strong>Audit</strong>. This is presented in Figure5.1, showing a total of 44,442 employees and a gap of5,109.The WSAA survey determined a most likely scenario ofa current and short-term aggregate workforce of 19,500with an estimated gap of 3,100 positions at 2009. Figure5.1 shows the 3,100 gap as the WSAA report does notprovide an estimate for 2007 or 2008. As the WSAAsurvey was conducted in 2007 an estimate of 1,550 hasbeen made for current (2008) vacancies, being half of the3,100. This 1,550 estimate is used in section 5.2 whichaddresses the gaps from current employment to theprojected 2018 requirements for the water industry as awhole, thus requiring a consistent estimate of a currentgap from both the WSAA survey and the 2008 survey.The May 2008 survey determined an estimatedemployment total of 22,933, comprising a widerpopulation of the water sector but excluding WSAAmembers, and requiring 2,009 additional employees tofill vacancies.This first order estimate is considered to be low asnot all of the water sector has been included in thecombination of the WSAA and the May 2008 surveys.For example, Commonwealth government employeeshave not been included and the water sector includesmany other organisations as discussed and illustratedsection 2.1.The analysis of Census data provides a secondaryanalysis of the scale of the industry. In the <strong>Australian</strong>and New Zealand Standard Industry Classification(ANZIC) the economic activities of the water industry aregenerally included in the following two industry classes:<strong>Water</strong> Supply (ANZSIC code 2811), and Sewerage andDrainage Services (ANZSIC code 2812).However, there is range of business activity that may notbe predominantly related to water but is nevertheless acritical provider of services to water infrastructure. Thisoccurs mainly in the Other Heavy and Civil EngineeringConstruction (ANZSIC code 3109) category, thoughothers are likely to be relevant.An estimate of total employment in the three industrysectors which are either predominantly to do with waterindustry or provide substantial input to it in Australiain 2006 gives a total of 55,000 people. Of these,32,540 are in the Other Heavy and Civil EngineeringConstruction category, for which data on the percentagein water-related activity is not available.Nevertheless there are a number of factors which,whilst speculative and not measured at this stage, leadto a much higher estimate of the scale of the currentwater industry. These factors include anecdotal evidencefrom people with a large degree of knowledge basedon experience in the industry, that the surveys do notinclude requirements from Commonwealth and Stategovernment departments and agencies and othersignificant segments, and that there is a large numberof other job categories which are known to be relevantto employees in the water industry but are not includedin the estimates based on Census data. Examples ofcategories not included are for jobs in instrumentation,control systems and information and communicationsFigure 5.1: Total employment and vacanciesEmployees50,00045,00040,00035,00030,00025,00020,00015,00010,0005,00003,10016,4002,00922,9335,10939,333WSAA 2007 Survey May 2008 Survey Total Surveyed(2007 and 2008)Current WorkforceVacancies58 ICE WaRM • <strong>National</strong> <strong>Skills</strong> <strong>Audit</strong> (Phase One) Report
technology. It is conservatively estimated that thewater sector could be as about double the surveyedpopulation, or a total of some 80,000 employees. Thistotal includes a current skills gap of about 5000 thoughdata inconsistencies do not allow a detailed breakdownon the current unfilled vacancies.5.2 Projected Needs and GapsThe projected needs and gaps are similarly estimatedfrom the two surveys to provide first order estimates.The WSAA survey determined a most likely scenarioof an aggregate workforce requirement of 20,924 at2017, with a gap of 8,656 employees. The May 2008survey determined an employment requirement at 2018of 34,039, comprising employees of AWA membersand local government, with a gap requiring 17,938employees.These estimates are presented in Figure 5.2, showinga total of 54,963 employees and a gap of 26,594 to befilled by new employees.The WSAA analysis considered the supply anddemand in determining the gap, with the supply(current workforce) being diminished by retirementsand resignations that result in departure from thesector. In the May 2008 survey, estimates of projectedretirements are based on survey data, while estimatesof the net impacts of resignations and departures fromthe water sector are based on secondary data, so asto be approximately compatible with the WSAA data.This compatibility allows the addition of the estimatesto provide a reasonable picture of the total sectorpopulation represented by both survey samples, asillustrated in Figures 5.2 and 5.3.Figure 5.3 illustrates the relative contributions of growth,retirements and resignations out of the sector from theWSAA survey population and the current (non-WSAA)survey population. The WSAA report projects relativelylow net growth, and higher losses due to retirementsand resignations, whereas for the non-WSAApopulation, the most significant factor in the projectedgap is attributed to growth. The total therefore showsthat, of the projected total gap of 26,468, almost half(47 per cent) is attributable to growth, with retirementsand resignations out of the sector comprising about onequartereach (27 per cent and 26 per cent respectively)to the total.As shown in Figure 5.4, the total positions required tobe filled by 2018 is about 26,500 through a combinationof industry growth, resignations and retirements. It isinteresting to note that the growth is about the sameas the combined contributions from net resignationsand retirements. Also interesting is that the sum ofthe depleted workforce (current employees remainingin the sector) plus retirements and resignations out ofthe sector in 2018 is approximately equal to the 2008workforce total, indicating a degree of confidence in thesurveys and analysis.The same reasoning used for the increasing theestimate of the current industry size (anecdotalevidence, segments of the industry not included inthe survey reports and secondary data) applies forthe projected workforce. Additionally there may belarge increases for works arising from the announced$40 billion industry investments over the next eight toten years which are not included the projections forthe survey populations. Again such extensions arespeculative; however a realistic estimate of the overallwater sector employment at 2018 is approximately100,000, including a gap of more than 40,000 to be filledby skilled new entrants.Figure 5.2: Total employment requirement in 201860,00050,000Employees40,00030,00020,00010,000026,59417,9388,65628,36912,26816,101WSAA 2007 Survey May 2008 Survey Total SurveyedDepleted WorkforcePositions to FillICE WaRM • <strong>National</strong> <strong>Skills</strong> <strong>Audit</strong> (Phase One) Report 59
Figure 5.3: Composition of survey population workforce in 201860,00050,00040,000Employees30,00020,00010,0000WSAA 2007 Survey May 2008 Survey Total SurveyedDepleted Workforce Retirements Resignations Grow thFigure 5.4: Current and projected surveyed workforce requirements, 2008 and 201860,00050,00040,000VacanciesPositions to befilledGrowthResignationsEmployees30,000Retirements20,00010,000WorkforceDepletedWorkforce02008 2018Current Retirements Resignations Grow th Vacancies60 ICE WaRM • <strong>National</strong> <strong>Skills</strong> <strong>Audit</strong> (Phase One) Report
5.3 Priority GapsPriority gaps in both the VET and university sectorsare presented in this section by mapping the job rolesagainst the AQF qualifications.These projected gaps can be mapped againstqualification levels, although in many cases anindividual’s level of experience can change the level ofqualification required for a role. For example, in order tofill an Engineer level position a recent graduate wouldrequire at least a Bachelors degree; however, wherean individual has significant experience in the fielda Diploma may be sufficient. It is also the case thatduring periods of high demand for particular occupationsemployers will often alter the qualification level that theyrequire for a given positions.Table 5.1 sets out the current ‘gaps’ (unfilled vacancies)in the non-WSAA water sector by job family mappedagainst typical minimum qualification levels. As with allof the results of this survey, the estimates are subject toa considerable degree of uncertainty.The largest area of demand is for Bachelor degree levelqualifications and above accounting for almost half of thecurrent requirement, although there is also considerableunmet demand for those with vocational qualifications.Table 5.2 sets out the projected number of newemployees required by the (non-WSAA) water sectorby 2018 combining the estimates of current unfilledvacancies, projected retirements, and projected jobsgrowth. his estimate is subject to greater uncertaintythan the overall ‘population’ estimates, as not only aretheir the uncertainties related to the ‘grossing up’ ofthe estimates, but assumptions need to be made aboutlikely retirement rates. These figures do not includeestimates of the numbers of new employees needed toreplace those leaving the water sector for a reason otherthan retirement, such as those shifting to employment inanother industry.It is projected based on the survey results that almost8,000 employees with degree level qualifications orhigher will be required by 2018, 46 per cent of thetotal. A further 9,200 individuals with vocational levelqualifications may be required, and this has assumedthat all of the workers in the ‘operators’ job family willrequire some form of VET qualification which may not bethe case.As common job families have been used both for thisMay 2008 survey and the survey of WSAA members,the two sets of results can be combined. The resultsare not perfectly comparable as the WSAA surveywas undertaken in 2007 and therefore their 10-yearprojections refer to 2017 rather than 2018; however, thisshould not alter any of the findings significantly.Table 5.3 sets out the results of the WSAA survey by jobfamily and qualification.The WSAA member’s requirements for their futureworkforce are slightly less skill intensive than thosereported in the survey of the wider water sector, with 42per cent of the required additional employees requiring abachelors degree or above.Table 5.1: Estimated current vacancies for non-WSAA segment water sector employees by job family and qualification<strong>Australian</strong>QualificationsFrameworkCert II Cert III Cert IV DiplomaAdvDiplomaAssociateDegreeVoc GradCertVoc GradDipBachelor Grad Cert Grad Dip Masters DoctorateManagers 175EngineerProfessionalsScience/TechnicalProfessionals758141EngineerParaprofessionals279Science/technologyParaprofessionalsTrades and RelatedWorkers208Operators 307Business support 49 91ICE WaRM • <strong>National</strong> <strong>Skills</strong> <strong>Audit</strong> (Phase One) Report 61
Table 5.4 shows the combined results from the twosurveys. Over the next 10 years the surveyed watersector will need an additional 26,500 employees, 11,400of whom are projected to require a bachelors degree orabove. The actual requirements may be greater than thisif booming sectors such as mining and infrastructuredevelopment attract skilled employees currently workingin the water sector to shift industry (refer also to Section5.2 above).These projections for total additional water sectoremployees are based on the results of the two surveysand, as discussed in the previous two sections, therequirements may be much higher. The estimates of totalgaps in 2018 for the whole sector (40,000 mentionedin section 5.2 above), and particularly their compositionacross the AQF, are speculative and include a rangeof assumptions. For example, it is not known to whatextent the work arising from the announced $40 billionsector investments over the next eight to ten yearshas been taken into account in the projections of thesurveyed population, and factors such as this willimpact estimates significantly. The spread of minimumqualifications may vary as well, but more likely than notwill follow a similar pattern to that illustrated in Table 5.4.Table 5.2: Projected total (non-WSAA) additional water sector employees needed by 2018<strong>Australian</strong>QualificationsFrameworkCert II Cert III Cert IV DiplomaAdvDiplomaAssociateDegreeVoc GradCertVoc GradDipBachelor Grad Cert Grad Dip Masters DoctorateManagers 1,112EngineerProfessionalsScience/TechnicalProfessionals5,355797EngineerParaprofessionalsScience/technologyParaprofessionals1,747205Trades and RelatedWorkers2,086Operators 4,105Business support 1,038 537Table 5.3: Projected total additional water sector employees required by WSAA members by 2017<strong>Australian</strong>QualificationsFrameworkCert II Cert III Cert IV DiplomaAdvDiplomaAssociateDegreeVoc GradCertVoc GradDipBachelor Grad Cert Grad Dip Masters DoctorateManagers 735EngineerProfessionalsScience/TechnicalProfessionals1,277307EngineerParaprofessionalsScience/technologyParaprofessionals585175Trades and RelatedWorkers823Operators 1,678Business support 1,792 1,28462 ICE WaRM • <strong>National</strong> <strong>Skills</strong> <strong>Audit</strong> (Phase One) Report
Table 5.4: Projected total additional water sector employees required by 2018<strong>Australian</strong>QualificationsFrameworkCert II Cert III Cert IV DiplomaAdvDiplomaAssociateDegreeVoc GradCertVoc GradDipBachelor Grad Cert Grad Dip Masters DoctorateManagers 1,847EngineerProfessionalsScience/TechnicalProfessionals6,6321,104EngineerParaprofessionalsScience/technologyParaprofessionals2,332380Trades and RelatedWorkers2,909Operators 5,783Business support 2,830 1,821Total 5,783 2,909 5,542 11,4045.4 <strong>Water</strong> Sector Issues for<strong>Skills</strong> DevelopmentThe <strong>Australian</strong> workforce is suffering from general skillsshortages at present, for a number of reasons whichcan be categorised as both short-term and long-term.The short-term issues may be mostly related to recentand current economic conditions, while the longer-termissues are more structural in nature, based on suchfactors as the accelerating decline in total workingagepopulation, sectoral reforms, and low levels ofinvestment in education and training. These generalissues are not discussed in detail here, but serve asa backdrop to any analysis of the issues affecting thewater sector in particular.There are a number of issues of relevance in improvingthe skills base in the water sector. As detailed in Chapter3, it is not as simple as defining priority occupations andfilling training or education places to alleviate the skillsshortage. There are a number of other factors in play thatare impacting on the water sector and the skill levels ofthe workforce that may make it difficult to achieve theskill level required.The water industry has experienced major industry,regulatory and business reform since the early 1990swhich, coupled with reduced sector investment andhigh efficiency dividend payments to government, havehad significant impact on the operations, managementand employee structure of water organisations andusers, and on the capabilities and expertise required.In particular, the in-house training and sponsorship ofexternal training traditionally provided by the publicsector have been significantly reduced. This wascoincident with significant reform of the education andtraining sectors, now a two-tier system of universitiesand VET, both under strain, which in response to fallingdemand have reduced relevant education and training.As in many sectors, the workforce is ageing in thewater industries, particularly in those organisationsthat emerged from the former water authorities,commissions and departments. There is competitionfor skilled workers across the economy, and fewer newentrants in technical vocations and professions.Key issues found in a preliminary investigationconducted by ICE WaRM in 2005 (still valid) and in theWSAA study concluded in 2008, include:• Key skills are lacking due to the retirement of acohort of workers with skills that have not been replacedthrough the education and training programmes ofUniversities and TAFE, nor through formerly traditionalmentoring and in-house training programmes.• There is a wide range of new capabilities that arerequired in the industry due to a changed environmentwhich often require training across a broad mix ofdisciplines, and in new disciplines and emergingtechnologies.• Broader issues also directly impact the water sector– the overall shortages of technical skills in the <strong>Australian</strong>economy, the strong competition for human resourceswithin the infrastructure/ mining sectors in particularand an extended period of low investment in curriculumdevelopment.ICE WaRM • <strong>National</strong> <strong>Skills</strong> <strong>Audit</strong> (Phase One) Report 63
• There is a high demand for civil engineers, whoaccount for a large proportion of the water sectorworkforce.• The current workforce is highly experienced, butrelatively inflexible. There is a dominance of permanent,full-time, older and long-tenured employees.• Some water sector organisations are not competitivewith regard to salaries for some job roles, affectingattraction and retention of staff.The combination of all of these factors has led to a risein demand for capabilities in water management roles atthe same time as a large cohort of workers prepare toretire, with few trained and experienced people from thenext generation to replace them.Given the acknowledged importance of science andengineering related qualifications and skills, it isrelevant to note the decline in interest in studying thesedisciplines. Potential reasons for this decline, and otherpriority issues within the education sector that result inbarriers for those considering eventual employment inthe water industry, have been identified as including:• Competition for employment from well-paid sectorswith lower entrance qualifications, such as mining andconstruction.• Changing/evolving job roles, definitions andqualifications make it difficult to choose a specific careerpath in the water industry.• Difficulty in sourcing water-specific training oreducation programmes in preferred locations. This ispartly attributable to the reduction of education optionsto only two tiers – TAFE and University – and theconsequent shrinking visibility of ‘technologist’ options.• Inadequacies in university laboratories using outdatedequipment.• Preferences for shorter training periods.• Increase in university staff to student ratio from 14:1to 21:1 by 2006. Heavier teaching loads means thatteaching staff are spread across more disciplines with aconcomitant reduction in teaching quality.• Difficulties in making academic appointments dueto shortages in quality staff and higher incentives forresearch than teaching.• Limited educational training, professionaldevelopment or incentives to improve teachingthroughout the tertiary education system.• Variable connectivity of universities with industryresulting in less employment-relevant curriculum.• The low-visibility of engineering, science and thewater industry in particular when choosing education andemployment options.A number of strategies and recommendations are indevelopment to help ameliorate some of these issues.These will be further investigated in Phase 2.5.5 Using Commitments for <strong>Water</strong>Specific PlacesThe overall need for new skilled employees in the watersector to 2018 has been estimated as a minimum ofan additional 26,500 employees, 11,404 of whom areprojected to require a bachelor degree or above. Therequirements for Certificate III, IV and Diploma coursesare approximately 5,800, 2,900 and 5,500 respectively aspresented in Table 5.4. The actual requirements may befar greater.There is an overlap in the current or proposed courses ofthe VET and university sectors at the Advanced Diplomato Graduate Diploma range of AQF qualifications,as indicated in Table 5.4, above. This suggests thatprospective students may be provided a larger range ofoptions, and also suggests that there is an opportunityfor pathways within and between the education sectorsto present an effective range of courses within existingand proposed funding.The Productivity Placement Program, with 450,000 newtraining places, will provide much needed capacity topositively impact on the requirements for VET sectorqualified employees. The competition for these placesfor all industries is expected to be high and allocation ofa specific quantity to the needs of the water industrywould help establish necessary programmes andfacilities with some degree of confidence.The requirements for university places are of concernin comparison to current commitments. Of the 2,300new places announced in September 2007 underthe Realising Our Potential programme, 560 were forengineers and 390 for science professionals in fieldsthat may be relevant to the water industry (excludesnon-relevant Engineering and Science Degrees, such asMarine Biology). The water industry alone is requiring anaverage of more than 600 extra engineers and 100 extrascience professional per year over the next 10 years.• Changing expectations from younger members ofworkforce who expect greater flexibility in workinghours, the opportunity to achieve a work/life balance andbetter optimised career paths than is offered by industry.64 ICE WaRM • <strong>National</strong> <strong>Skills</strong> <strong>Audit</strong> (Phase One) Report
Table 5.4: Projected total additional water sector employees required by 2018<strong>Australian</strong>QualificationsFrameworkCert II Cert III Cert IV DiplomaAdvDiplomaAssociateDegreeVoc GradCertVoc GradDipBachelor Grad Cert Grad Dip Masters DoctorateManagers 1,847EngineerProfessionalsScience/TechnicalProfessionals6,6321,104EngineerParaprofessionalsScience/technologyParaprofessionals2,332380Trades and RelatedWorkers2,909Operators 5,783Business support 2,830 1,821Total 5,783 2,909 5,542 11,4045.6 Opportunities for IndigenousPeopleIndigenous people participate throughout all sectors ofsociety with opportunities available through conventionalpathways, particularly mainstream education andtraining. There are unique opportunities for Indigenouspeople in rural and regional areas to make significantcontributions to the water sector. Two examplesare in the provision of sustainable water supply andsanitation within Indigenous and remote communities,and in sustainable land and water management withinenvironmental or natural resources managementprogrammes.There is abundant literature and long-term practicalexperience on the subject of sustainability of waterrelatedservices in challenging environments. All toooften the challenges are neither technical nor economic,but relate to social, institutional and environmentalfactors, and failures in any one of these aspectsresults in the failure of the service. The principlesand practical steps to achieve sustainability are wellknown and documented. Foremost amongst theseis the development of community empowerment andownership of the solutions they determine, implementand manage. For Indigenous communities and theservices they demand, achieving sustainability requiresthat they are the principal players. There are numerousopportunities available in this area, and best served bysuitably skilled and motivated Indigenous people.There is a companion project being undertaken withinthe same COAG framework, and in parallel with thisassignment, to address water supply and sanitation forIndigenous and remote communities. It is expected thatthis companion project will assist in identifying theseopportunities in more detail.The affinity of Indigenous people to the naturalenvironment is legendary, and some considerablesuccesses have been recorded in formally engagingthese custodial skills in natural resource managementprogrammes. This is an ideal entry point for morespecific focus on land and water managementprogrammes. Conventional training programmes havehad limited take-up by Indigenous candidates, butcould be adapted to make them more attractive andrelevant to this group, particularly those with practicalbackground and experience in (traditional) environmentalmanagement.5.7 Engagement of the <strong>Water</strong>Sector and University SectorFigure 5.3 presents a model that maps different levelsof engagement between industry and universities. Lowlevel, traditional activities include career expos andgeneral awareness-raising; activities that are currentlycarried out on an ad hoc basis. Higher level, structuredengagement includes activities such as curriculumdevelopment or review, sponsorship from collaborativeICE WaRM • <strong>National</strong> <strong>Skills</strong> <strong>Audit</strong> (Phase One) Report 65
organisations such as CRCs or International Centres ofExcellence, culminating at strategic partnerships suchas already exist with the defence and mining sectors.By following a model such as this, engagement maybe structured at different, strategic levels that mayhelp achieve higher levels of collaboration betweenuniversities and the water sector.Industry skills shortages are critical and are resultingin increased competition for new workers and lookingat ways of retraining or upskilling existing workers.As industry needs continue to grow, it will becomeimperative to overcome barriers identified here andimplementing improved ways of engaging withuniversities. The resultant relationships need to evolvefrom traditional, low level engagement towards morestrategic partnerships, such as industry internships andindustry support for particular courses. These wouldthen need to be widely promoted to ensure uptake ofnew opportunities. Industry has both the opportunityand need to engage with universities more effectively toachieve their strategic interests and invest in the future.5.8 Skilled MigrantsAs explained in Chapter 2, for reasons of time prioritiesin conducting these studies, and the existence ofconsiderable previous work on the issues of skilledimmigration, these issues were not included in anycomprehensive way in this audit phase of activity. Itis recognised that migration is one of the range ofstrategies that may be considered in addressing shortandlong-term skills shortages and gaps. Indeed thereis considerable history of the application of this strategyin Australia generally, and in some sectors in particular,such as health. At the same time as this report wasbeing prepared, changes to migration policies were beingwidely discussed in the <strong>Australian</strong> media, with an overallannual increase of some 25 per cent being proposedacross all categories, including unskilled migrants.It is worth highlighting some general comments aboutthe use of skilled migration as a strategy for filling skillsshortages and gaps. There are two basic variations incommon use: permanent migration, presumably moreappropriate for addressing chronic or long-term skillsshortages, and temporary (referred to as 457 visas)which are designed for short-term skills needs.The 457 visa is reported to be very popular amongstemployer groups, and is used quite extensively incertain sectors, such as resources and mining. Itsattractiveness is understandable, and its use mostlyjustified as filling a short-term local demand bubble ina world-wide marketplace. This argument carries mostweight in industries with large, short-period fluctuationsin demand (frequent boom-bust cycles) and for veryFigure 5.3: Industry/University engagement modelSource: Murray 2008b, adapted from Bryant 2008.66 ICE WaRM • <strong>National</strong> <strong>Skills</strong> <strong>Audit</strong> (Phase One) Report
highly specialised skills with infrequent or unsustainedlocal demand. Many sectors of the economy, includingthe water sector, are difficult to characterise in theseterms at any time, except perhaps in relation to theglobal marketplace.The arguments for and against are not presented here.Suffice to note that there are some risks, especiallyfrom a socio-economic perspective, in using thisapproach extensively, or building reliance upon its use.Where longer-term, steady skills demands have beenmet through temporary migration, local development ofthe same skills diminish to the extent that the capacityof the education and training institutions servicing themalso deteriorates.Permanent migration programmes have somecharacteristics in common, though targeting is moredifficult, response times are slower, and impacts morelong-lasting. It is important to consider not only theimpacts in the new host country and community, butalso the impacts on the migrants’ home country by thelong-term or permanent loss of their skills, especiallywhere it is a developing country. Entrepreneurialresponses to opportunities presented under anymigration programme may expected, such as the useof agents, and the adaptation of education and traininginstitutions to new markets. Some responses to rulesmay be unexpectedly innovative, requiring vigilance tolimit unintended consequences.Notwithstanding these general comments, it is clearfrom the current and projected skills shortages andgaps reported earlier, and the lead times involved inaccelerating education and training, skilled migration islikely to form part of any strategic approach to addressworkforce requirements. It will be important to ensurethat any skilled migration programme is well targetedand balanced with complimentary short- and long-termeducation and training programmes in the water sector.<strong>Skills</strong> shortages are an issue internationally for manyskills generally and for the water industry in particular.Programmes for attracting skilled migrants to Australiawill compete with those mounted by other countries,and of course <strong>Australian</strong> skilled employees may betargeted. Any contribution to closing the skills gapsthrough skilled migration strategies will need to considerthese factors.ICE WaRM • <strong>National</strong> <strong>Skills</strong> <strong>Audit</strong> (Phase One) Report 67
6 Next StepsThe first phase of this two-phase assignment has beenfocused on an audit function: attempting to confirm withquantitative analysis that there is indeed a significantskills issue in the national water sector, now and fora foreseeable future. <strong>Audit</strong>s are necessarily based onthe recent past and current information, knowledgeand perspectives. Statistically, future projections areinformed by an analysis of the past. While this providessome confidence about the numbers, the underlyingassumption is that the future will look a lot like the past.As we grapple with the concepts surrounding climatechange, it is necessary to consider also that the futuremay be significantly different from the current and recentpast.Already the water sector is changing much faster thanin living memory. Many of these changes pre-datethe current drought and climate change debate; theyhave their foundations in the 1994 COAG reforms tothe water sector. These reforms separated the variousaccess rights to water from land titles, thus allowingthe development of economic valuations of water andtrading of these entitlements. They also forced theseparation of regulatory and operational responsibilitiesin the water sector, which started a cycle of significantinstitutional reforms, restructuring and down-sizing thelarge public sector organisations and outsourcing manyof their operational functions.The leaner utilities which emerged from thatrestructuring started paying significant returns togovernment, generally as efficiency dividends; the majorurban utilities alone contribute more than $1 billionannually. They virtually stopped recruiting new staff andstopped training. Private sector service providers did notfill the training gap. The pool of qualified and experiencedwater sector workers has now dried up. The ‘traditional’or ‘core’ water sector, and its ways of operating, haschanged, and the coping mechanisms of the past are nolonger available.It is worth considering this recent history, as thereare lessons to be learned. Perhaps principal amongstthem is that short-term approaches have long-termconsequences, and in the water sector, in particular, theymay take a long time even to become very apparent. It isimportant that these lessons are not lost in planning forthe future.Coincident with this long-developing skills crisis inthe ‘traditional’ water sector have been the changesin community standards and expectations, and thetendency towards a more holistic perspective andgreater value being placed on water. Again, thesechanges may be more exposed in the current publicdebates surrounding the worst drought in recordedhistory and issues associated with climate change, butthey have been developing over relatively long periods,as have broad social attitudes to issues such as theenvironment and gender, and are continuing to evolve.Consequently, the definitions of water and the watersector have already changed, and will keep changing overtime.While these changes have been identified in theprocesses of the first phase of activities, theirimplications have not necessarily been addressed inthis audit and are planned to be specifically consideredin the second phase. In other words, the first phaseapplied current thinking to confirm the extent of the skillsshortages; to take this forward to the second phasestrategy development will involve building on a broadrange of future thinking though wide consultation.Concerns were raised that the current pace of changein the water sector will not be sustained nor willthe changes be sustainable. There are significantdevelopments already in the pipeline for the next 10years, but what happens after that? The methodologyfor this audit was designed to limit detailed considerationto a 10-year time frame. For the water sector, 10 yearsis not a long planning horizon. It is important that muchlonger timeframes are considered in the consultations.It is also recognised that many sector segments targetedin the survey were unable to complete the requiredresponses in the extremely short time available to them.They need to be given further opportunities to contributeto the overall findings, and will be invited to focus groupand other consultations planned for the next phase.Similarly, it was not possible to explore identified issuesin great depth in the limited time for Phase 1, but arelisted for ongoing attention in Phase 2. For example,there are new initiatives in the VET sector which werenot well captured in the data reported here, but will beincorporated in strategy development activities. Theserious structural issues in the other main providers ofcapacity development, the universities, also warrantmore careful attention.The ToR for the assignment mention that there may wellbe other issues in improving the skills base of the sector.While there were agreed limitations in the methodology,it is unlikely that any significant issue has not beenraised in the course of Phase 1; even so, it is worthwhilecanvassing more widely to ensure that this is the case.<strong>Water</strong> industry leaders are already concerned and actingon a number of issues. The <strong>National</strong> <strong>Water</strong> <strong>Skills</strong> TaskForce was recently formed to oversee the developmentand implementation of specific initiatives which theindustry perceives as sufficiently urgent and importantto form part of any sector skills strategy. It is plannedto engage with the Task Force and ensure that there isappropriate alignment of activities and priorities, andthat the industry will support the general outcomes ofthis assignment, and lead at least several of the specificactivities arising.There is no doubt that water is special, to all, butparticularly to <strong>Australian</strong>s. Australia has an enviable68 ICE WaRM • <strong>National</strong> <strong>Skills</strong> <strong>Audit</strong> (Phase One) Report
international reputation for water management, builtover decades of responsible stewardship. This is notthe perspective of today illustrated by the findings ofthe Phase 1 audit. Regaining the initiative, and havingthe capacity to respond to the challenges of tomorrow’swater sector will require commitment to soundstrategies. Developing such strategies, informed by theaudit and soundly based in broader consultation, will bethe focus of the next phase activities.ICE WaRM • <strong>National</strong> <strong>Skills</strong> <strong>Audit</strong> (Phase One) Report 69
ReferencesAttikiouzel Y 2008, ‘Linking R&D into practice’, paper presented to the Business/Higher Education Round Table, BuildingTomorrow’s Engineers Symposium 2008, Melbourne, Vic.<strong>Australian</strong> Council of Deans of Science (ACDS) 2007, Sustaining science: university science in the 21st century,prepared by I R Dobson, Centre for Population and Urban Research, and the Educational Policy Institute, ACDS, Sydney.<strong>Australian</strong> Council of Engineering Deans (ACED) 2008a, Engineers for the future – addressing the supply and qualityof <strong>Australian</strong> engineering graduates for the 21st century, prepared by The Carrick Institute for Learning and Teaching inHigher Education Ltd, NSW.<strong>Australian</strong> Council of Engineering Deans (ACED) 2008b, Engineers for the future – addressing the supply and qualityof <strong>Australian</strong> engineering graduates for the 21st century, draft summary report, prepared by The Carrick Institute forLearning and Teaching in Higher Education Ltd, NSW.<strong>Australian</strong> Industry Group (AIG) 2007, Skilling the existing workforce – background research paper, prepared by PNoonan, Commonwealth Government, Canberra.<strong>Australian</strong> <strong>National</strong> Training Authority (ANTA) 2005, Industry <strong>Skills</strong> Report – Resources and Infrastructure <strong>Skills</strong> Council,May 2005, ANTA, Brisbane.<strong>Australian</strong> <strong>National</strong> Training Authority (ANTA) 2004a, Shaping our future – Australia’s national strategy for vocationaleducation and training 2004-2010. Action plan 2004-2010, ANTA, Brisbane.<strong>Australian</strong> <strong>National</strong> Training Authority (ANTA) 2004b, Shaping our future – Australia’s national strategy for vocationaleducation and training 2004-2010. Innovation: ideas for action, ANTA, Brisbane.<strong>Australian</strong> <strong>National</strong> Training Authority (ANTA) 2004c, Shaping our future – Australia’s national strategy for vocationaleducation and training 2004-2010. Mapping the future: a forward plan for <strong>Australian</strong> vocational education and trainingstatistics 2004-2010, ANTA, Brisbane.<strong>Australian</strong> <strong>National</strong> Training Authority (ANTA) 2003, Shaping our future – Australia’s national strategy for vocationaleducation and training 2004-2010, ANTA, Brisbane.<strong>Australian</strong> <strong>Water</strong> <strong>Association</strong> (AWA) 2008, <strong>Australian</strong> <strong>Water</strong> Directory, AWA, NSW.Bozik M 2008, ‘Mind the gap’, Career Matters (APESMA), Issue 9, p.2.Bryant A 2008, ‘Industry Influence on Higher Education’, paper presented to the Business/Higher Education RoundTable, Building Tomorrow’s Engineers Symposium 2008, Melbourne, Vic.Climate Change and <strong>Water</strong> Working Group (CCWG) 2008, Report to Council of <strong>Australian</strong> Governments, available online26/05/08, at: http://www.coag.gov.auCommonwealth of Australia 2008a, ‘<strong>National</strong> water skills forum’, prepared by Palm Consulting Group, Canberra.Commonwealth of Australia 2008b, Portfolio budget statements 2008-2009, budget related Paper No. 1.6 –Environment, <strong>Water</strong>, Heritage and the Arts portfolio, Commonwealth Government, Canberra.Commonwealth of Australia 2007, Realising our potential, Commonwealth Government, Canberra.Department of Education, Employment and Workplace Relations (DEEWR) 2008a, Undergraduate applications, offersand acceptances 2008, Commonwealth Government, Canberra.Department of Education, Employment and Workplace Relations (DEEWR) 2008b, Skilling Australia for the future–Discussion paper 2008, Commonwealth Government, Canberra.Department of Education, Employment and Workplace Relations (DEEWR) 2008c, Skilling Australia for the future– skills shortages and the Productivity Places Program, Commonwealth Government, Canberra.Department of Education, Employment and Workplace Relations (DEEWR) 2008d, Productivity Places Program,available online, at: http://www.productivityplaces.deewr.gov.au/home.htmICE WaRM • <strong>National</strong> <strong>Skills</strong> <strong>Audit</strong> (Phase One) Report R.1
Department of Education, Employment and Workplace Relations (DEEWR) 2008e, <strong>Skills</strong> Initiative, available online, at:http://www.skillsinitiative.gov.au/Department of Education, Employment and Workplace Relations (DEEWR) 2008f, Training and <strong>Skills</strong> Key Priorities,available online, at: http://www.dest.gov.au/sectors/training_skills/programmes_funding/programme_categories/key_skills_priorities/Department of Education, Science and Training (DEST) 2006, Skilling Australia – 2005–08 Commonwealth-StateAgreement for skilling Australia’s workforce, Commonwealth Government, Canberra.Department of Education, Science and Training (DEST) 2005, Skilling Australia – new directions for vocational educationand training, Commonwealth Government, Canberra.Energy and Utility <strong>Skills</strong> 2004, Labour market investigation into the UK water industry, Energy and Utility <strong>Skills</strong>, UK.Government <strong>Skills</strong> Australia (GSA) 2008, Environmental scan, Commonwealth Government, Canberra,Government <strong>Skills</strong> Australia (GSA) 2007a, NWP07 <strong>Water</strong> training package Vol I, GSA, Canberra.Government <strong>Skills</strong> Australia (GSA) 2007b, NWP07 <strong>Water</strong> training package Vol II, GSA, Canberra.Hopkins R 2008, ‘Education for <strong>Water</strong> Reform: <strong>National</strong> and International Perspectives’, paper presented to the 1st<strong>National</strong> <strong>Water</strong> Industry Capacity Development conference 2008, Gold Coast, Qld.Industry <strong>Skills</strong> Councils (ISC) 2008, Joint Industry <strong>Skills</strong> Councils response to the Skilling Australia for the Futurediscussion paper, ISC, Canberra.International Centre of Excellence in <strong>Water</strong> Resources Management (ICE WaRM) 2005, Gaps in skills, education andtraining in water management: a preliminary report, ICE WaRM, Adelaide.King R 2008, ‘Engineering still suffers from lack of visibility’, Civil Engineers Australia, Vol.80, No.5, pp.40-41.Lambert R (2003) Lambert review of business – university collaboration, available online 27/05/08, at: http://www.hmtreasury.gov.uk./media/9/0/lambert_review_final_450.pdfMurray A 2008a, ‘Collaborative education – everyone is a winner’, paper presented to the 1st <strong>National</strong> <strong>Water</strong> IndustryCapacity Development conference 2008, Gold Coast, Qld.Murray A 2008b, ‘Selling industry’s need to higher education’, paper and presentation, presented to the 1st <strong>National</strong><strong>Water</strong> Industry Capacity Development conference 2008, Gold Coast, Qld.<strong>National</strong> Centre for Vocational Education Research (NCVER) 2007a, A well-skilled future, prepared by S Richardson,<strong>National</strong> Institute of Labour Studies, Flinders University, Adelaide and R Teese, Centre For Post-Compulsory Educationand Lifelong Learning, University of Melbourne.<strong>National</strong> Centre for Vocational Education Research (NCVER) 2007b, Matching supply of and demand for skills:international perspectives, prepared by J Keating, Centre For Post-Compulsory Education and Lifelong Learning,University of Melbourne.<strong>National</strong> Centre for Vocational Education Research (NCVER) 2006, Future skill needs: projections & employers’ views,prepared by D Lowry, S Molloy and S McGlennon, <strong>National</strong> Institute of Labour Studies, Flinders University, Adelaide.New South Wales Department of Education and Training 2007, <strong>Audit</strong> of skills needs of water industry in NSW, preparedby the New South Wales Utilities and Electrotechnology Industry Training Advisory Body, Darlinghurst.<strong>National</strong> <strong>Water</strong> Commission 2005, Institutional arrangements in the <strong>Australian</strong> water sector – information paper,prepared by ACIL Tasman, Melbourne.Office of Post-Compulsory Education and Training (OPCET) n.d., Industry training demand profile, Government ofTasmania, Hobart.Organisation for Economic Cooperation and Development (OECD) 2007, Education at a glance, OECD, Paris, France.R.2 ICE WaRM • <strong>National</strong> <strong>Skills</strong> <strong>Audit</strong> (Phase One) Report
<strong>Water</strong> Industry Capacity Development (WICD) 2007, Project 2: university courses, preliminary water industry interactionwith universities survey, prepared by A Murray and S Seddon, WICD, NSW.<strong>Water</strong> Industry <strong>Skills</strong> Taskforce 2008, ‘<strong>Water</strong> industry skills taskforce’, follow-up letter and Terms of Reference,Commonwealth of Australia, Canberra, ACT.<strong>Water</strong> Services <strong>Association</strong> of Australia (WSAA) 2008, An assessment of the skills shortage in the urban waterindustry, WSAA Occasional Paper No.21, prepared by Kathleen Barrett, Infohrm Pty Ltd, WSAA, Melbourne.ICE WaRM • <strong>National</strong> <strong>Skills</strong> <strong>Audit</strong> (Phase One) Report R.3
Appendices
Appendix ATerms of ReferenceICE WaRM • <strong>National</strong> <strong>Skills</strong> <strong>Audit</strong> (Phase One) Report A.1
REQUEST FOR QUOTE - 0708-1210FOR THE PROVISION OFA <strong>National</strong> <strong>Water</strong> <strong>Skills</strong> <strong>Audit</strong> and StrategyDate: 17 April 2008TO:Richard HopkinsCEOInternational Centre of Excellencein <strong>Water</strong> Resources Management(ICE WaRM).ABN: 13112 314 780CONTACT: Richard HopkinsPHONE: (08) 8236 5200FAX: (08) 8236 5236EMAIL: rhopkins@icewarm.com.auFROM: Richard McLoughlinAssistant Secretary<strong>National</strong> Irrigation Efficiency BranchDepartment of the Environment,<strong>Water</strong>, Heritage and the ArtsJohn Gorton BuildingKing Edward TerracePARKES ACT 2601ABN: 34 190 894 983CONTACT: Sam RosebyPHONE: (02) 6274 1088FAX: (02) 6274 2782EMAIL: sam.roseby@environment.gov.au1. Background1.1 The Department of the Environment, <strong>Water</strong>, Heritage and the Arts (theDepartment) is an <strong>Australian</strong> Government organisation responsible foradvising the <strong>Australian</strong> Government on its policies for protecting theEnvironment and <strong>Water</strong> Resources, administering environment and heritagelaws, managing the <strong>Australian</strong> Government's main environment and heritageprogrammes, implementing an effective response to climate change andrepresenting the <strong>Australian</strong> Government in international environmentalagreements related to the Environment and Antarctica.1.2 On 26 March 2008, at its 21 st meeting, COAG agreed to set in trainimmediately a series of actions to report by July this year to coordinate effortstowards reform in the water sector. As part of this approach, Action 4(a)requires a Project Group with representatives from each <strong>Australian</strong> jurisdictionto advise COAG on a national strategy to address skills needs and gaps in thewater sector.1.3 The Department of the Environment, <strong>Water</strong>, Heritage and the Arts thereforehas a requirement to employ a consultant to conduct a national water skillsaudit and develop a strategy of skills needs and gaps in the water sector withthe work to be undertaken consisting of the following Phases (as referred to inPart A):(a)(b)A national audit of skills needs and gaps in the water sector; andThe development of a strategy to attract and retain skilled staff, asinformed by the audit.0708-1210 <strong>National</strong> <strong>Water</strong> <strong>Skills</strong> <strong>Audit</strong> and Strategy
2. Lodgement Details2.1 Quotes should be emailed to the contact officer identified in this RFQ at theemail address specified.If you also wish to submit a hardcopy response this can be sent to the contactofficer at the address listed below.Responses are to be addressed and delivered to:sam.roseby@environment.gov.auand / orSam Roseby<strong>National</strong> Irrigation Efficiency Branch<strong>Water</strong> Efficiency DivisionDepartment of the Environment, <strong>Water</strong>, Heritage and the ArtsKing Edward TerracePARKES ACT 26013. Project Officer3.1 The point of contact for all matters concerning the RFQ is the Project Officer,whose details are as follows:Sam Roseby<strong>National</strong> Irrigation Efficiency Branch<strong>Water</strong> Efficiency DivisionTel: (02) 6274 1088Fax: 02 6274 2782Email: sam.roseby@hotmail.com4. No Contract or Undertaking4.1 Nothing in this RFQ will be construed to create any binding contract (expressor implied) between the Department and any Respondent until a writtenContract is entered into with the successful Respondent (if any). Any conductor statement whether prior to or subsequent to the issuance of this RFQ is not,and this RFQ is not, and must not be deemed to be:(a)(b)an offer to contract; ora binding undertaking of any kind by the Department (including withoutlimitation, quasi-contractual rights, promissory estoppel, or rights with asimilar legal basis).5. Evaluation Process5.1 Responses received will be assessed in accordance with the CommonwealthProcurement Guidelines. The Department will select the successfulRespondent in accordance with the core principle underpinning <strong>Australian</strong>Government procurement – value for money. The evaluation will take into0708-1210 <strong>National</strong> <strong>Water</strong> <strong>Skills</strong> <strong>Audit</strong> and Strategy
account the evaluation criteria outlined in the Part B response below and howthe criteria are answered by the Respondent.5.2 If the Department considers, at any time, that none of the quotes receivedrepresent value for money to the Department or that entering into a contractwith any of the Respondents does not represent an effective, ethical andefficient use of Commonwealth funds, the Department may terminate thisprocess.6. Conflict of Interest6.1 You warrant that:(a) no conflict of interest exists; or,(b) you have stated any existing or potential conflict of interest in yourresponse to this request.6.2 If at any time prior to entering into a formal agreement with the Department, anactual or potential conflict of interest arises or may arise for any Tenderer, thatTenderer should immediately notify the Department in writing.6.3 If a conflict of interest is identified the Department may:(a)(b)(c)exclude the submission from further considerationenter into discussions to seek to resolve such conflict of interest ortake any other action it considers appropriate.7. Compliance with Legislation7.1 You must comply with all applicable laws of the Commonwealth, of any State,Territory or local authority.0708-1210 <strong>National</strong> <strong>Water</strong> <strong>Skills</strong> <strong>Audit</strong> and Strategy
PART A STATEMENT OF REQUIREMENT (Services) 0408-1210Requirement:<strong>National</strong> <strong>Water</strong> <strong>Skills</strong> <strong>Audit</strong> and StrategyDescription of the ServiceThe Services sought include, but are not limited to the following:PHASE 1: AUDIT REPORTStage 1: Draft <strong>Audit</strong> ReportThe audit of skills needs and gaps should focus on both current needs and projectedfuture needs over the immediate term (1-3 years), the medium term (the next tenyears) and the long term. It should consider urban and rural issues, and both theneeds of the industry and on-ground water managers, including environmental watermanagers. While it should identify opportunities to use current commitments toincrease water-specific places in tertiary and vocational education, it should alsocanvass what other issues are of relevance in improving the skills base of the watersector. Opportunities for increasing the skills and capacity for Indigenous people shouldbe included.The audit should be framed to inform the strategy, and in particular to:• Provide clear articulation of skills and competencies required by the industryboth now and in the medium and longer term.• Inform DEEWR of priority gaps in vocational training, to potentially informallocation of some 450,000 new apprenticeships to be allocated over the nextfour years.• Identify priority gaps in courses in the university sector, and ways to promotecloser engagement between the universities and the water sector.• Consider potential avenues to create a more streamlined, timely entry into thesector for skilled migrantsThe audit will define the water industry broadly to include water managers, and thoseworking on water in other industries. The review will build on previous research andsurveys, particularly:• ICE WaRM Gaps in skills, training and education in water management, Apreliminary report (2005) and the Preliminary <strong>Water</strong> Industry Interaction with theUniversities Survey (2007); and• WSAA <strong>Skills</strong> Shortages Project – Stage one (2008)The draft audit report is to be completed by 2 June 2008.Stage 2: <strong>Audit</strong> Report Feedback• With the completion of Stage 1, the Consultant shall circulate the draft audit reportto the Department and <strong>Water</strong> Sub Group Committee.• Comments received on the draft audit report are to be considered by theConsultant in the preparation of the final version of the report.The <strong>Water</strong> Sub Group will assess the draft audit report and provide comments back tothe Consultant by 4 June 2008.0708-1210 <strong>National</strong> <strong>Water</strong> <strong>Skills</strong> <strong>Audit</strong> and Strategy
Stage 3: Final <strong>Audit</strong> ReportProduce a final report that:• addresses each of the points included in Stage 1;• addresses the comments provided by the <strong>Water</strong> Sub Group in Stage 2;• includes an executive summary of the work undertaken and the key findings ofthis project;• includes a glossary of terminology used in the final report;• includes a bibliography of all reference materials referred to in the final report;and• is prepared in a simple English style of writing and is produced to a publicationready level (i.e. grammar, spelling etc, has been checked by someone who hasprofessional editorial skills).The final audit report will be required by 9 June 2008 to be presented to COAG at itsnext meeting on 3 July 2008.PHASE 2: NATIONAL WATER SKILLS STRATEGYStage 4: <strong>National</strong> StrategyBuilding on the audit, develop a national strategy for addressing the gaps identified inthe audit including options to provide additional water-sector relevant education andtraining positions via Government <strong>Skills</strong> Australia and other government programs.The strategy should address the need to:• attract and retain skilled staff in the water industry, whilst giving dueconsideration to the effects of market forces on staff availability, including inrural and regional areas• augment the technical skills base in the water industry• improve the training and skills support base for rural water managers (such ascouncils and property managers)• develop a capacity building strategy for remote and regional communities,particularly Indigenous communities, to build practical skills in water resourcemanagement and planning.The draft strategy is to be completed by 29 August 2008.Stage 5: <strong>National</strong> Strategy Feedback• With the completion of Stage 4, the Consultant shall circulate the draft strategy tothe Department and <strong>Water</strong> Sub Group Committee.• Comments received on the draft strategy are to be considered by the Consultant inthe preparation of the final version of the report. \The <strong>Water</strong> Sub Group will assess the draft strategy report and provide comments backto the Consultant by 12 September 2008.Stage 6: Final <strong>Audit</strong> ReportProduce a final report that:• addresses each of the points included in Stage 4;• addresses the comments provided by the <strong>Water</strong> Sub Group in Stage 5;0708-1210 <strong>National</strong> <strong>Water</strong> <strong>Skills</strong> <strong>Audit</strong> and Strategy
• includes an executive summary of the work undertaken and the key findings ofthis project;• includes a glossary of terminology used in the final report;• includes a bibliography of all reference materials referred to in the final report;and• is prepared in a simple English style of writing and is produced to a publicationready level (i.e. grammar, spelling etc, has been checked by someone who hasprofessional editorial skills).The final audit report will be required by 22 September 2008 to be presented to COAGat its meeting on 3 October 2008.ConsultationIt is expected that the service provider will consult the water sector widely in theprovision of this service. At a minimum, this should include:• State / Territory representatives who form membership of the COAG <strong>Water</strong> SubGroup;• <strong>Australian</strong> Government Departments;• Government <strong>Skills</strong> Australia;• Australia <strong>Water</strong> <strong>Association</strong>;• The <strong>Water</strong> Industry <strong>Skills</strong> Taskforce;• On ground water managers (including environmental water managers); and• Specific professional / vocational organisations (eg Engineers Australia,plumbing industry associations).0708-1210 <strong>National</strong> <strong>Water</strong> <strong>Skills</strong> <strong>Audit</strong> and Strategy
PART B RESPONSE TO REQUEST FOR QUOTE 0708 1210The respondent must respond to each of the following questions in order for theDepartment to conduct an assessment of the most suitable organisation to undertakethis service.Name of Organisation: International Centre for Excellence in <strong>Water</strong> ResourcesManagement (ICE WaRM)Your quote must:• provide a detailed breakdown of the cost of your quote that shows the hourly ratesper consultant (and include details of the personnel who will undertake the work) foreach phase of the Services required (as noted above). For the total price of thequote you must clearly note the GST payable. For example, “the total cost of thisquote is $XX,000 ($XX,000 + $X,000 in GST)”,• demonstrate that you have the following insurance cover:o workers compensation insurance for an amount required by the relevantState or Territory legislation;o public liability insurance for an amount of not less than 5 million dollars; ando professional indemnity insurance for an amount of not less than 5 milliondollars.Assessment Criteria:The criteria that will be used to assess your quote include:1. extent to which the quote demonstrates its understanding of the projectspecifications and project topic;2. extent to which the quote demonstrates high level experience and skills indeveloping and implementing work of the nature proposed;3. extent to which the quote has an effective and appropriate methodology andplan for undertaking the tasks included in the project specifications;4. extent to which the quote demonstrates that the consultant has the capacity andresources to complete the work within the required time frame; and5. price.0708-1210 <strong>National</strong> <strong>Water</strong> <strong>Skills</strong> <strong>Audit</strong> and Strategy
Appendix BProject organisation chartAdvisory GroupSponsor and Chair - <strong>Australian</strong> Academy of Technological Sciences and Engineering (ATSE)Sector<strong>Water</strong>CMA/NRMOrganisation<strong>Water</strong> <strong>Skills</strong> Forum TaskforceIrrigation Australia<strong>National</strong> Irrigation Council<strong>Water</strong> Industry Operators’ <strong>Association</strong>Regional NRM and CMAGovernmentEducationProfessionalVocationalHigher EducationICE WaRM • <strong>National</strong> <strong>Skills</strong> <strong>Audit</strong> (Phase One) Report B.1
Reference GroupSponsor and Chair - <strong>Australian</strong> <strong>Water</strong> <strong>Association</strong> (AWA)Sector<strong>Water</strong> <strong>Association</strong><strong>Water</strong> UtilitiesCMA/NRMOrganisation<strong>Water</strong> Services <strong>Association</strong> of Australia (WSAA)<strong>Australian</strong> <strong>Water</strong> <strong>Association</strong> (AWA)Irrigation Australia<strong>Water</strong> Industry Operators’ <strong>Association</strong>Urban, regional and ruralRegional NRM and CMAConsultantsEducationProfessionsVocationalHigher EducationB.2 ICE WaRM • <strong>National</strong> <strong>Skills</strong> <strong>Audit</strong> (Phase One) Report
Appendix CJob Family Description Job Role Example job rolesManagerManagers are those at the firstthree or four levels of largeorganisations or first two levels ofsmaller organisations.Corporate managerOperational managerCEO, Human Resource Manager, Finance Manager,Corporate Services Manager, Policy and Planning Manager,Marketing and Business Development ManagerIT Manager, Engineering Manager, Sales Manager, NaturalResource Management OfficerCivil EngineerCivil Engineer, Project Manager, Asset Manager, Hydrologist,HydrogeologistEngineer -ProfessionalEngineering Professionals aredegree qualified or are at a levelin the organisation that requiresthe job role to be performed at aprofessional standard.Mechanical EngineerElectrical EngineerProcess/Chemical EngineerMechanical Engineer, Project Manager, Building ServicesEngineerElectrical Engineer, Project Manager, Building ServicesEngineerProcess/Chemical Engineer, Project ManagerEnvironmental EngineerEnvironmental Engineer, Project Manager, Building ServicesEngineerScience/TechnicalProfessionalsScience/technical professionalsare degree qualified or are ata level in the organisation thatconsiders the job role to beperformed at a professionalstandard.Environmental ProfessionalPublic Health ProfessionalChemist ProfessionalEnvironmental Scientist, NRM Project Officers, NRMFacilitators, Environment Protection Officer (EPA),Hydrogeologist, <strong>Water</strong> Resources PlannerMicrobiologist, Environmental Health Officer, EnvironmentalHealth RegulatorChemistCivil ParaprofessionalCivil Engineering Technician, Civil Engineering Associate,Bulk Supply Coordinator, Groundwater ExtractionCoordinator, Senior Hydrometric Monitoring Officer, DesignDraftspersonEngineer -ParaprofessionalEngineering Paraprofessionals arenot required to possess degreelevel qualifications for the role butare highly experienced in the fieldof expertise.Mechanical ParaprofessionalElectrical ParaprofessionalMechanical Engineering Technician, Mechanical EngineeringAssociate, Plumbing Engineering Technician, PlumbingEngineering Associate, Bulk Supply CoordinatorElectronic Engineering Technicians, Electrical EngineeringAssociate, Bulk Supply CoordinatorProcess/Chemical EngineerChemical EngineerEnvironmentalParaprofessional(Engineering)Environment OfficerScience/TechnicalParaprofessionalsScience/technicalparaprofessionals are notrequired to possess degree levelqualifications for the role but arehighly experienced in the field ofexpertise.EnvironmentalParaprofessional (Scientific)Public HealthParaprofessionalChemist ParaprofessionalEnvironmental Officer/Technician, Technician/Officer, <strong>Water</strong>Licensing Field Officer, Catchment Management CoordinatorTechnician/Officer, Public Health InspectorChemistry Technician, Chemistry Technical Officer,Chemistry Lab TechnicianTradesTradespersons possess a tradecertificate. Includes Apprentices.Electrical TradespersonMechanical and BuildingTradespersonElectrician, Electronic Instrument Tradesperson, ApprenticeFitter, Plumber, Boilermaker, Welder, Carpenter, Blacksmith,ApprenticeConstruction andMaintenanceMaintenance Operator/Assistant, Operations Assistant,Meter Restrictor/ReaderOperatorsOperators generally acquire theirskills through on-the-job trainingand/or a relevant VET Certificate2/3.Operations<strong>Water</strong> Treatment Plant Operator/Assistant Operator, <strong>Water</strong>Sampler, Wastewater Treatment Plant Operator/AssistantOperator, Assistant Reuse Operator, Bulk Supply Operator,<strong>Water</strong> Bailiff, Distribution Network Operator, Pipeline andCanal Operator, Dam Operator, Process WorkerBusiness SupportBusiness Support Professionalsare degree qualified or are ata level in the organisation thatconsiders the job role to beperformed at a professionalstandard. Business Supportparaprofessionals are notrequired to possess degree levelqualifications for the role but arehighly experienced in the field ofexpertise.Source: Adapted from WSAA 2008.ProfessionalParaprofessionalAccountant, Learning and Development Co-ordinator, ITSupport Officer, Community Liaison OfficerPayroll Clerk, Accounts Clerk, Administration Officer,Personal AssistantICE WaRM • <strong>National</strong> <strong>Skills</strong> <strong>Audit</strong> (Phase One) Report C.1