National Water Skills Audit - Australian Water Association
National Water Skills Audit - Australian Water Association
National Water Skills Audit - Australian Water Association
- No tags were found...

You also want an ePaper? Increase the reach of your titles
YUMPU automatically turns print PDFs into web optimized ePapers that Google loves.
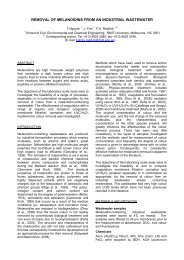
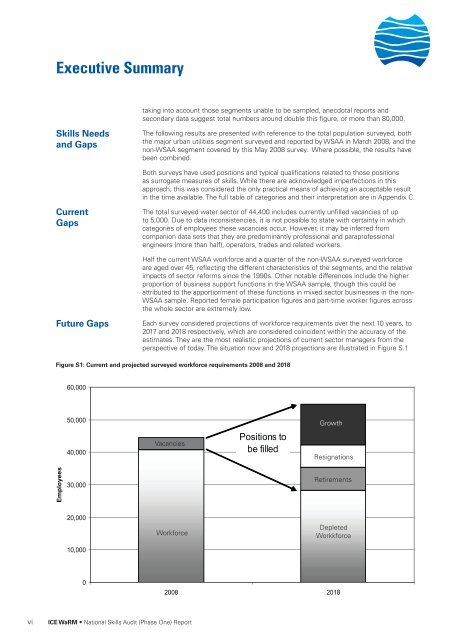
Executive Summary<strong>Skills</strong> Needsand GapsCurrentGapsFuture Gapstaking into account those segments unable to be sampled, anecdotal reports andsecondary data suggest total numbers around double this figure, or more than 80,000.The following results are presented with reference to the total population surveyed, boththe major urban utilities segment surveyed and reported by WSAA in March 2008, and thenon-WSAA segment covered by this May 2008 survey. Where possible, the results havebeen combined.Both surveys have used positions and typical qualifications related to those positionsas surrogate measures of skills. While there are acknowledged imperfections in thisapproach, this was considered the only practical means of achieving an acceptable resultin the time available. The full table of categories and their interpretation are in Appendix C.The total surveyed water sector of 44,400 includes currently unfilled vacancies of upto 5,000. Due to data inconsistencies, it is not possible to state with certainty in whichcategories of employees these vacancies occur. However, it may be inferred fromcompanion data sets that they are predominantly professional and paraprofessionalengineers (more than half), operators, trades and related workers.Half the current WSAA workforce and a quarter of the non-WSAA surveyed workforceare aged over 45, reflecting the different characteristics of the segments, and the relativeimpacts of sector reforms since the 1990s. Other notable differences include the higherproportion of business support functions in the WSAA sample, though this could beattributed to the apportionment of these functions in mixed sector businesses in the non-WSAA sample. Reported female participation figures and part-time worker figures acrossthe whole sector are extremely low.Each survey considered projections of workforce requirements over the next 10 years, to2017 and 2018 respectively, which are considered coincident within the accuracy of theestimates. They are the most realistic projections of current sector managers from theperspective of today. The situation now and 2018 projections are illustrated in Figure S.1Figure S1: Current and projected surveyed workforce requirements 2008 and 201860,00050,000Growth40,000VacanciesPositions tobe filledResignationsEmployees30,000Retirements20,00010,000WorkforceDepletedWorkkforce02008 2018viICE WaRM • <strong>National</strong> <strong>Skills</strong> <strong>Audit</strong> (Phase One) Report