National Water Skills Audit - Australian Water Association
National Water Skills Audit - Australian Water Association
National Water Skills Audit - Australian Water Association
- No tags were found...
You also want an ePaper? Increase the reach of your titles
YUMPU automatically turns print PDFs into web optimized ePapers that Google loves.
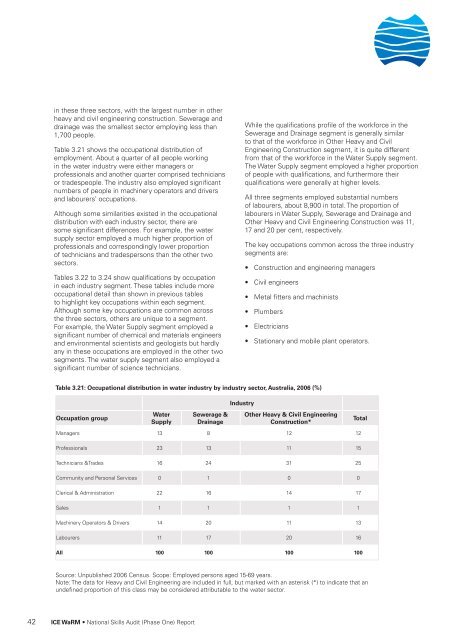
in these three sectors, with the largest number in otherheavy and civil engineering construction. Sewerage anddrainage was the smallest sector employing less than1,700 people.Table 3.21 shows the occupational distribution ofemployment. About a quarter of all people workingin the water industry were either managers orprofessionals and another quarter comprised techniciansor tradespeople. The industry also employed significantnumbers of people in machinery operators and driversand labourers’ occupations.Although some similarities existed in the occupationaldistribution with each industry sector, there aresome significant differences. For example, the watersupply sector employed a much higher proportion ofprofessionals and correspondingly lower proportionof technicians and tradespersons than the other twosectors.Tables 3.22 to 3.24 show qualifications by occupationin each industry segment. These tables include moreoccupational detail than shown in previous tablesto highlight key occupations within each segment.Although some key occupations are common acrossthe three sectors, others are unique to a segment.For example, the <strong>Water</strong> Supply segment employed asignificant number of chemical and materials engineersand environmental scientists and geologists but hardlyany in these occupations are employed in the other twosegments. The water supply segment also employed asignificant number of science technicians.While the qualifications profile of the workforce in theSewerage and Drainage segment is generally similarto that of the workforce in Other Heavy and CivilEngineering Construction segment, it is quite differentfrom that of the workforce in the <strong>Water</strong> Supply segment.The <strong>Water</strong> Supply segment employed a higher proportionof people with qualifications, and furthermore theirqualifications were generally at higher levels.All three segments employed substantial numbersof labourers, about 8,900 in total. The proportion oflabourers in <strong>Water</strong> Supply, Sewerage and Drainage andOther Heavy and Civil Engineering Construction was 11,17 and 20 per cent, respectively.The key occupations common across the three industrysegments are:• Construction and engineering managers• Civil engineers• Metal fitters and machinists• Plumbers• Electricians• Stationary and mobile plant operators.Table 3.21: Occupational distribution in water industry by industry sector, Australia, 2006 (%)IndustryOccupation group<strong>Water</strong>SupplySewerage &DrainageOther Heavy & Civil EngineeringConstruction*TotalManagers 13 8 12 12Professionals 23 13 11 15Technicians &Trades 16 24 31 25Community and Personal Services 0 1 0 0Clerical & Administration 22 16 14 17Sales 1 1 1 1Machinery Operators & Drivers 14 20 11 13Labourers 11 17 20 16All 100 100 100 100Source: Unpublished 2006 Census. Scope: Employed persons aged 15-69 years.Note: The data for Heavy and Civil Engineering are included in full, but marked with an asterisk (*) to indicate that anundefined proportion of this class may be considered attributable to the water sector.42 ICE WaRM • <strong>National</strong> <strong>Skills</strong> <strong>Audit</strong> (Phase One) Report


