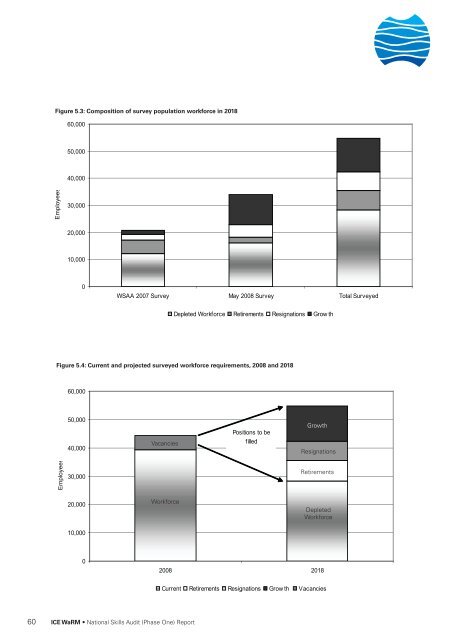
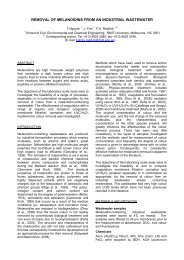
technology. It is conservatively estimated that thewater sector could be as about double the surveyedpopulation, or a total of some 80,000 employees. Thistotal includes a current skills gap of about 5000 thoughdata inconsistencies do not allow a detailed breakdownon the current unfilled vacancies.5.2 Projected Needs and GapsThe projected needs and gaps are similarly estimatedfrom the two surveys to provide first order estimates.The WSAA survey determined a most likely scenarioof an aggregate workforce requirement of 20,924 at2017, with a gap of 8,656 employees. The May 2008survey determined an employment requirement at 2018of 34,039, comprising employees of AWA membersand local government, with a gap requiring 17,938employees.These estimates are presented in Figure 5.2, showinga total of 54,963 employees and a gap of 26,594 to befilled by new employees.The WSAA analysis considered the supply anddemand in determining the gap, with the supply(current workforce) being diminished by retirementsand resignations that result in departure from thesector. In the May 2008 survey, estimates of projectedretirements are based on survey data, while estimatesof the net impacts of resignations and departures fromthe water sector are based on secondary data, so asto be approximately compatible with the WSAA data.This compatibility allows the addition of the estimatesto provide a reasonable picture of the total sectorpopulation represented by both survey samples, asillustrated in Figures 5.2 and 5.3.Figure 5.3 illustrates the relative contributions of growth,retirements and resignations out of the sector from theWSAA survey population and the current (non-WSAA)survey population. The WSAA report projects relativelylow net growth, and higher losses due to retirementsand resignations, whereas for the non-WSAApopulation, the most significant factor in the projectedgap is attributed to growth. The total therefore showsthat, of the projected total gap of 26,468, almost half(47 per cent) is attributable to growth, with retirementsand resignations out of the sector comprising about onequartereach (27 per cent and 26 per cent respectively)to the total.As shown in Figure 5.4, the total positions required tobe filled by 2018 is about 26,500 through a combinationof industry growth, resignations and retirements. It isinteresting to note that the growth is about the sameas the combined contributions from net resignationsand retirements. Also interesting is that the sum ofthe depleted workforce (current employees remainingin the sector) plus retirements and resignations out ofthe sector in 2018 is approximately equal to the 2008workforce total, indicating a degree of confidence in thesurveys and analysis.The same reasoning used for the increasing theestimate of the current industry size (anecdotalevidence, segments of the industry not included inthe survey reports and secondary data) applies forthe projected workforce. Additionally there may belarge increases for works arising from the announced$40 billion industry investments over the next eight toten years which are not included the projections forthe survey populations. Again such extensions arespeculative; however a realistic estimate of the overallwater sector employment at 2018 is approximately100,000, including a gap of more than 40,000 to be filledby skilled new entrants.Figure 5.2: Total employment requirement in 201860,00050,000Employees40,00030,00020,00010,000026,59417,9388,65628,36912,26816,101WSAA 2007 Survey May 2008 Survey Total SurveyedDepleted WorkforcePositions to FillICE WaRM • <strong>National</strong> <strong>Skills</strong> <strong>Audit</strong> (Phase One) Report 59
Figure 5.3: Composition of survey population workforce in 201860,00050,00040,000Employees30,00020,00010,0000WSAA 2007 Survey May 2008 Survey Total SurveyedDepleted Workforce Retirements Resignations Grow thFigure 5.4: Current and projected surveyed workforce requirements, 2008 and 201860,00050,00040,000VacanciesPositions to befilledGrowthResignationsEmployees30,000Retirements20,00010,000WorkforceDepletedWorkforce02008 2018Current Retirements Resignations Grow th Vacancies60 ICE WaRM • <strong>National</strong> <strong>Skills</strong> <strong>Audit</strong> (Phase One) Report