National Water Skills Audit - Australian Water Association
National Water Skills Audit - Australian Water Association
National Water Skills Audit - Australian Water Association
- No tags were found...

You also want an ePaper? Increase the reach of your titles
YUMPU automatically turns print PDFs into web optimized ePapers that Google loves.
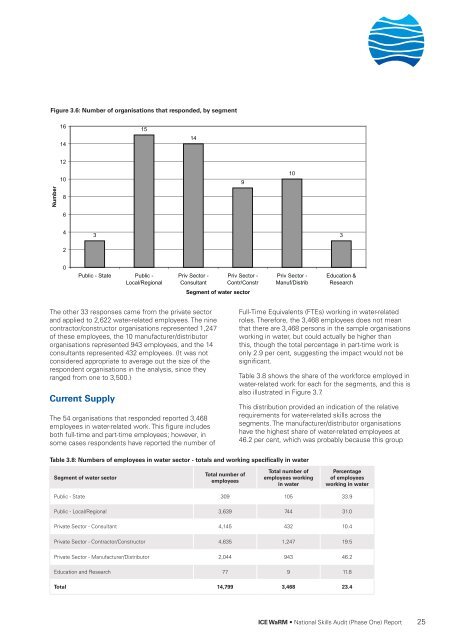
Figure 3.6: Number of organisations that responded, by segment1614151412Number108691043320Public - State Public -Local/RegionalPriv Sector -ConsultantPriv Sector -Contr/ConstrPriv Sector -Manuf/DistribEducation &ResearchSegment of water sectorThe other 33 responses came from the private sectorand applied to 2,622 water-related employees. The ninecontractor/constructor organisations represented 1,247of these employees, the 10 manufacturer/distributororganisations represented 943 employees, and the 14consultants represented 432 employees. (It was notconsidered appropriate to average out the size of therespondent organisations in the analysis, since theyranged from one to 3,500.)Current SupplyThe 54 organisations that responded reported 3,468employees in water-related work. This figure includesboth full-time and part-time employees; however, insome cases respondents have reported the number ofFull-Time Equivalents (FTEs) working in water-relatedroles. Therefore, the 3,468 employees does not meanthat there are 3,468 persons in the sample organisationsworking in water, but could actually be higher thanthis, though the total percentage in part-time work isonly 2.9 per cent, suggesting the impact would not besignificant.Table 3.8 shows the share of the workforce employed inwater-related work for each for the segments, and this isalso illustrated in Figure 3.7.This distribution provided an indication of the relativerequirements for water-related skills across thesegments. The manufacturer/distributor organisationshave the highest share of water-related employees at46.2 per cent, which was probably because this groupTable 3.8: Numbers of employees in water sector - totals and working specifically in waterSegment of water sectorTotal number ofemployeesTotal number ofemployees workingin waterPercentageof employeesworking in waterPublic - State 309 105 33.9Public - Local/Regional 3,639 744 31.0Private Sector - Consultant 4,145 432 10.4Private Sector - Contractor/Constructor 4,635 1,247 19.5Private Sector - Manufacturer/Distributor 2,044 943 46.2Education and Research 77 9 11.8Total 14,799 3,468 23.4ICE WaRM • <strong>National</strong> <strong>Skills</strong> <strong>Audit</strong> (Phase One) Report 25