National Water Skills Audit - Australian Water Association
National Water Skills Audit - Australian Water Association
National Water Skills Audit - Australian Water Association
- No tags were found...

Create successful ePaper yourself
Turn your PDF publications into a flip-book with our unique Google optimized e-Paper software.
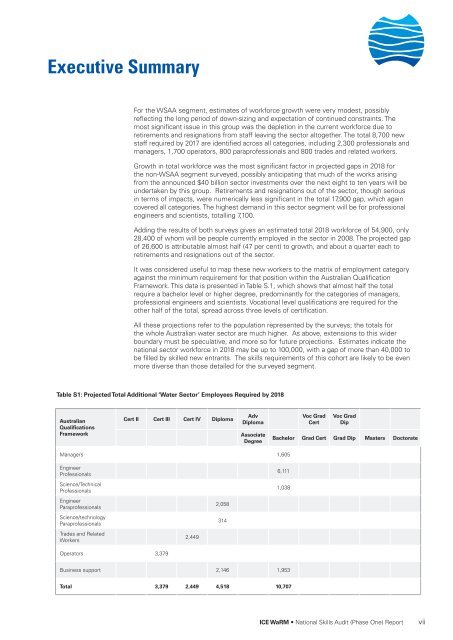
Executive SummaryFor the WSAA segment, estimates of workforce growth were very modest, possiblyreflecting the long period of down-sizing and expectation of continued constraints. Themost significant issue in this group was the depletion in the current workforce due toretirements and resignations from staff leaving the sector altogether. The total 8,700 newstaff required by 2017 are identified across all categories, including 2,300 professionals andmanagers, 1,700 operators, 800 paraprofessionals and 800 trades and related workers.Growth in total workforce was the most significant factor in projected gaps in 2018 forthe non-WSAA segment surveyed, possibly anticipating that much of the works arisingfrom the announced $40 billion sector investments over the next eight to ten years will beundertaken by this group. Retirements and resignations out of the sector, though seriousin terms of impacts, were numerically less significant in the total 17,900 gap, which againcovered all categories. The highest demand in this sector segment will be for professionalengineers and scientists, totalling 7,100.Adding the results of both surveys gives an estimated total 2018 workforce of 54,900, only28,400 of whom will be people currently employed in the sector in 2008. The projected gapof 26,600 is attributable almost half (47 per cent) to growth, and about a quarter each toretirements and resignations out of the sector.It was considered useful to map these new workers to the matrix of employment categoryagainst the minimum requirement for that position within the <strong>Australian</strong> QualificationFramework. This data is presented in Table S.1, which shows that almost half the totalrequire a bachelor level or higher degree, predominantly for the categories of managers,professional engineers and scientists. Vocational level qualifications are required for theother half of the total, spread across three levels of certification.All these projections refer to the population represented by the surveys; the totals forthe whole <strong>Australian</strong> water sector are much higher. As above, extensions to this widerboundary must be speculative, and more so for future projections. Estimates indicate thenational sector workforce in 2018 may be up to 100,000, with a gap of more than 40,000 tobe filled by skilled new entrants. The skills requirements of this cohort are likely to be evenmore diverse than those detailed for the surveyed segment.Table S1: Projected Total Additional ‘<strong>Water</strong> Sector’ Employees Required by 2018<strong>Australian</strong>QualificationsFrameworkCert II Cert III Cert IV DiplomaAdvDiplomaAssociateDegreeVoc GradCertVoc GradDipBachelor Grad Cert Grad Dip Masters DoctorateManagers 1,605EngineerProfessionalsScience/TechnicalProfessionals6,1111,038EngineerParaprofessionalsScience/technologyParaprofessionals2,058314Trades and RelatedWorkers2,449Operators 3,379Business support 2,146 1,953Total 3,379 2,449 4,518 10,707ICE WaRM • <strong>National</strong> <strong>Skills</strong> <strong>Audit</strong> (Phase One) Reportvii