water authorities or in the regulation of water utilitiesthat they have qualified staff, especially at operatorand technical/ paraprofessional level. Contractsusually require that operators are “competent” orhave “relevant training” but how this is interpretedand applied is subjective and based on internal HumanResources policies. Should these requirementsbecome mandatory, the demand for formal training andcertification of competencies will increase.The significance of the shortages and gaps to publicsafety is understated. A shortage of constructionworkers impacts on planned building programmes,whilst a shortage of trained water operators may riskpublic health. Increasingly, water peak bodies andsome government health regulators are questioning theunregulated nature of the skills required in auditing andaccountability for water service contracts.Experienced paraprofessional operators should be ableto articulate into higher education and therefore “upskill”into professional pathways. Without water-specifichigher education qualifications this is very difficult. Itmight be an achievable leap to move from the skills of awater operator to water engineer, but far more difficultto move to a general/ civil engineer.It was considered useful to clarify the differencebetween that part of the water sector covered by thetwo surveys and the estimates of the whole nationalwater sector, particularly those numbers relating to theprojections for 2018. The difference arises because itwas simply not possible to define accurately and samplethe whole sector within the practical limitations of thisaudit. Indeed it would be extremely difficult to do sowithout such limitations, as the sector boundaries aredynamic and porous, especially in multi-disciplinarycommercial organisations such as consultants andcontractors servicing variations in workloads in differentregions and different industries. For the purposes of thisanalysis a boundary was defined, a sample was takento represent the population within that boundary, andstatistical methods were applied to provide reasonableprojections of the defined population. That part of thewater sector outside the defined boundary, which isknown to exist but was not measured by the survey andanalysis, can only be estimated from known exclusions,anecdotal and secondary data, and any estimates mustbe regarded as speculative.In the case of the projections for 2018, the analysisof the part of the sector which was defined, sampledand surveyed showed that, of the estimated totalworkforce of 54,900 at that time, only 28,400 of thecurrent workforce will remain, and some 26,600 new,skilled employees will be required to meet the demand.These numbers are all derived from the analysis ofthe surveyed population. However, it is known thatthe national water sector is larger than this, thoughestimates based on anecdotal and secondary data arenecessarily approximate. These tentative estimatesfor 2018 indicate the whole sector comprising upto 100,000 employees, and a gap of some 40,000to be filled by skilled new entrants. There are manyassumptions implicit in these numbers; they arepresented only to indicate that the 2018 gap of 26,600projected from the analysis of the surveyed segment isa very conservative estimate.Much of the data reported and discussed is restricted tothe traditional functions of the water sector. These arechanging and will need to continue to do so, probablyat a faster rate into the future. Further considerationneeds to be given to future needs, for example in termsof climate change, desalination and potential untappedsources, and the related skills required. In addition, bylooking at an integrated natural resources managementapproach, the following areas become more significantin terms of knowledge and skill needs:• Biodiversity and ecosystem services• Indigenous cultural heritage• Geology• Aquatic, riparian and river health• Groundwater aquifer (confined and unconfined)health and stability• Groundwater salinity issues• Irrigation issues – water use, technical, educationand training• <strong>Water</strong> trading• Social sciences• Economics• Community.Further consideration needs to be given to the currentshape of the industry versus the future structuresneeded to meet priorities and demands. How must thewhole sector change if it is to meet these challenges?Many problems and even some of the optimal solutionsare now known, but what does the nation need to do toassemble the necessary (political), strategic, technicaland managerial skills to execute new projects, toreconfigure existing systems and generally to acceleratechange in an effort to meet changing national waterpriorities? These are questions to be considered in theconsultation activities for strategy development duringthe second phase of this assignment.ICE WaRM • <strong>National</strong> <strong>Skills</strong> <strong>Audit</strong> (Phase One) Report 57
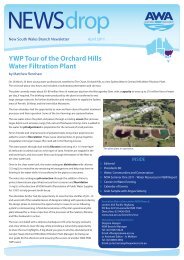
5 Outcomes/Issues5.1 Current Needs and GapsA first order estimate of water industry employee needsand gaps is determined by the combination of the WSAAsurvey and the May 2008 survey (non-WSSA members)conducted for this <strong>Skills</strong> <strong>Audit</strong>. This is presented in Figure5.1, showing a total of 44,442 employees and a gap of5,109.The WSAA survey determined a most likely scenario ofa current and short-term aggregate workforce of 19,500with an estimated gap of 3,100 positions at 2009. Figure5.1 shows the 3,100 gap as the WSAA report does notprovide an estimate for 2007 or 2008. As the WSAAsurvey was conducted in 2007 an estimate of 1,550 hasbeen made for current (2008) vacancies, being half of the3,100. This 1,550 estimate is used in section 5.2 whichaddresses the gaps from current employment to theprojected 2018 requirements for the water industry as awhole, thus requiring a consistent estimate of a currentgap from both the WSAA survey and the 2008 survey.The May 2008 survey determined an estimatedemployment total of 22,933, comprising a widerpopulation of the water sector but excluding WSAAmembers, and requiring 2,009 additional employees tofill vacancies.This first order estimate is considered to be low asnot all of the water sector has been included in thecombination of the WSAA and the May 2008 surveys.For example, Commonwealth government employeeshave not been included and the water sector includesmany other organisations as discussed and illustratedsection 2.1.The analysis of Census data provides a secondaryanalysis of the scale of the industry. In the <strong>Australian</strong>and New Zealand Standard Industry Classification(ANZIC) the economic activities of the water industry aregenerally included in the following two industry classes:<strong>Water</strong> Supply (ANZSIC code 2811), and Sewerage andDrainage Services (ANZSIC code 2812).However, there is range of business activity that may notbe predominantly related to water but is nevertheless acritical provider of services to water infrastructure. Thisoccurs mainly in the Other Heavy and Civil EngineeringConstruction (ANZSIC code 3109) category, thoughothers are likely to be relevant.An estimate of total employment in the three industrysectors which are either predominantly to do with waterindustry or provide substantial input to it in Australiain 2006 gives a total of 55,000 people. Of these,32,540 are in the Other Heavy and Civil EngineeringConstruction category, for which data on the percentagein water-related activity is not available.Nevertheless there are a number of factors which,whilst speculative and not measured at this stage, leadto a much higher estimate of the scale of the currentwater industry. These factors include anecdotal evidencefrom people with a large degree of knowledge basedon experience in the industry, that the surveys do notinclude requirements from Commonwealth and Stategovernment departments and agencies and othersignificant segments, and that there is a large numberof other job categories which are known to be relevantto employees in the water industry but are not includedin the estimates based on Census data. Examples ofcategories not included are for jobs in instrumentation,control systems and information and communicationsFigure 5.1: Total employment and vacanciesEmployees50,00045,00040,00035,00030,00025,00020,00015,00010,0005,00003,10016,4002,00922,9335,10939,333WSAA 2007 Survey May 2008 Survey Total Surveyed(2007 and 2008)Current WorkforceVacancies58 ICE WaRM • <strong>National</strong> <strong>Skills</strong> <strong>Audit</strong> (Phase One) Report