tradespersons to 35 per cent. Those saying that theynever require their new employees to have waterspecificqualifications increases from new professionals(13 per cent) to new paraprofessionals (29 per cent) andis highest with the new tradespeople (35 per cent).With regard to water-specific experience, this isshown in Table 3.15 to be most strongly required fornew professional employees, with 92 per cent ofrespondents answering that water-specific experienceis required always or sometimes. It can be seen thatthis requirement drops away to similar levels for theparaprofessional and tradesperson positions, at 64and 59 per cent, respectively. It is interesting to notethat organisations that always require this experiencedoes not vary greatly between the types of employees.However, at the other end of the spectrum, thosewho answered that water-specific experience isnever required rises from zero for new professionalemployees, to four for paraprofessionals and to nine fortradespeople.It may be concluded from the respondents that waterspecificqualifications and experience are requiredmostly for new professional employees, less so for newparaprofessionals and less again for new tradespeople.However, it is important to note that in every employeegrouping, there is a requirement by more than twothirds of respondents that the new employees havewater-specific qualifications and/or experience.Estimated <strong>Water</strong> Industry CurrentEmploymentTo form a picture of the overall size of the watersector outside of WSAA’s membership, populationestimates have been calculated for the sample frame.As discussed the sample frame was divided into stratato represent relatively similar sections of the sample,and the ‘grossing up’ to the population estimate wasundertaken by extrapolating within the strata.As no survey returns were received from councils inTasmania, South Australia, Western Australia and theNorthern Territory, and only one response was receivedfrom Victoria the population estimates do not includeany employment in local government for these states.No responses were received from private sectoranalytical laboratories, or from irrigation operators, andso employment in those organisations also was notincluded in these estimates.Thus, these population estimates represent anestimated total employment for the membership ofAWA, (excluding those which are also members ofWSAA), Local Government employment in Queenslandand New South Wales, and those CMAs and NRMorganisations for which contact information was publiclyavailable. These estimates should be treated withcaution, as the combination of a lack of prior informationon the population of organisations in the water sector,together with the low response rate means that thestandard errors are large.Table 3.16 shows the estimated water sector relatedemployment outside of the main urban water utilities(the members of WSAA who are considered separatelyin Section 3.2). It is estimated that the sector surveyedemploys roughly 24,000 employees although, as isnoted above, a number of parts of the water sector arenot included in this estimate.Current GapsAs part of the survey, respondents were askedto estimate the current number of vacancies intheir organisation by occupation. These results arepresented in Table 3.17 on a population basis for thesurvey’s sample frame. As with the estimate for totalemployment, these estimates should be treated withcaution, as the combination of a lack of prior informationon the population of organisations in the water sector,together with the low response rate means that thestandard errors are large.Civil Engineers account for the largest number ofvacancies by a considerable margin, with 438 positionsestimated to be currently unfilled (20 per cent of totalvacancies for the sector). The highest vacancy rate,however, is for Chemists, with 21 per cent of positionscurrently reported to be unfilled, with ElectricalEngineers and Civil Engineers having the next highestvacancy rates. In total there are estimated to be 2,000vacant positions amongst the organisations surveyed.Projected Future GapsTable 3.18 sets out the estimated employmentby occupation of the non-WSAA water sector in2018. Where estimated 2018 employment was notcompleted by the respondent it has been assumedthat employment will remain at its current level. Theseresults are presented on a population basis for thesurvey’s sample frame. As with the estimate for totalemployment, these estimates should be treated withcaution, as the combination of a lack of prior informationon the population of organisations in the water sector,together with the low response rate means that thestandard errors are large.Total employment is projected to increase by just over9,000, or 40 per cent, from its current level. The highestprojected growth rate for an occupation is for ‘PublicHealth Professionals’ with employment projected togrow by over 400 per cent, albeit from a very low base.The next highest growth rates are for EnvironmentalEngineers (100 per cent) and Civil Engineers (97 perICE WaRM • <strong>National</strong> <strong>Skills</strong> <strong>Audit</strong> (Phase One) Report 35
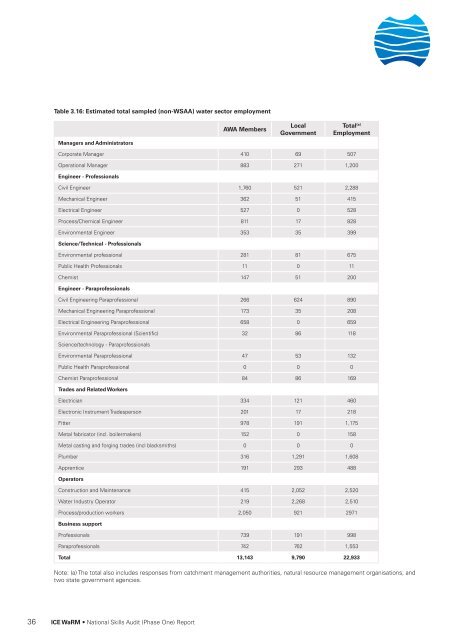
Table 3.16: Estimated total sampled (non-WSAA) water sector employmentManagers and AdministratorsAWA MembersLocalGovernmentTotal (a)EmploymentCorporate Manager 410 69 507Operational Manager 883 271 1,200Engineer - ProfessionalsCivil Engineer 1,760 521 2,288Mechanical Engineer 362 51 415Electrical Engineer 527 0 528Process/Chemical Engineer 811 17 828Environmental Engineer 353 35 399Science/Technical - ProfessionalsEnvironmental professional 281 81 675Public Health Professionals 11 0 11Chemist 147 51 200Engineer - ParaprofessionalsCivil Engineering Paraprofessional 266 624 890Mechanical Engineering Paraprofessional 173 35 208Electrical Engineering Paraprofessional 658 0 659Environmental Paraprofessional (Scientific) 32 86 118Science/technology - ParaprofessionalsEnvironmental Paraprofessional 47 53 132Public Health Paraprofessional 0 0 0Chemist Paraprofessional 84 86 169Trades and Related WorkersElectrician 334 121 460Electronic Instrument Tradesperson 201 17 218Fitter 978 191 1,175Metal fabricator (incl. boilermakers) 152 0 158Metal casting and forging trades (incl blacksmiths) 0 0 0Plumber 316 1,291 1,608Apprentice 191 293 488OperatorsConstruction and Maintenance 415 2,052 2,520<strong>Water</strong> Industry Operator 219 2,268 2,510Process/production workers 2,050 921 2971Business supportProfessionals 739 191 998Paraprofessionals 742 762 1,553Total 13,143 9,790 22,933Note: (a) The total also includes responses from catchment management authorities, natural resource management organisations, andtwo state government agencies.36 ICE WaRM • <strong>National</strong> <strong>Skills</strong> <strong>Audit</strong> (Phase One) Report