National Water Skills Audit - Australian Water Association
National Water Skills Audit - Australian Water Association
National Water Skills Audit - Australian Water Association
- No tags were found...

Create successful ePaper yourself
Turn your PDF publications into a flip-book with our unique Google optimized e-Paper software.
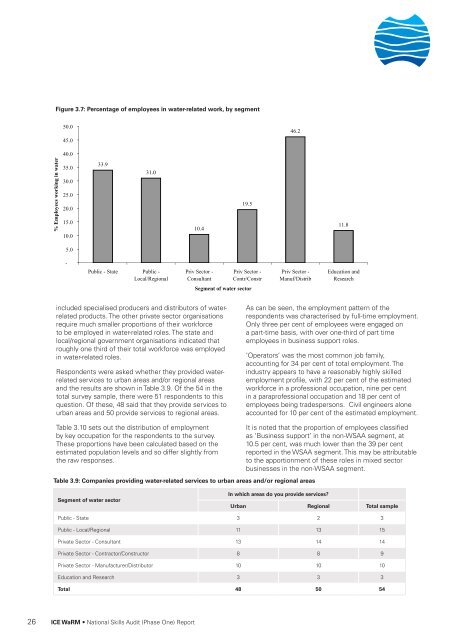
Figure 3.7: Percentage of employees in water-related work, by segment50.045.046.240.0% Employees working in water35.030.025.020.015.010.033.931.010.419.511.85.0-Public - State Public -Local/RegionalPriv Sector -ConsultantPriv Sector -Contr/ConstrPriv Sector -Manuf/DistribEducation andResearchSegment of water sectorincluded specialised producers and distributors of waterrelatedproducts. The other private sector organisationsrequire much smaller proportions of their workforceto be employed in water-related roles. The state andlocal/regional government organisations indicated thatroughly one third of their total workforce was employedin water-related roles.Respondents were asked whether they provided waterrelatedservices to urban areas and/or regional areasand the results are shown in Table 3.9. Of the 54 in thetotal survey sample, there were 51 respondents to thisquestion. Of these, 48 said that they provide services tourban areas and 50 provide services to regional areas.As can be seen, the employment pattern of therespondents was characterised by full-time employment.Only three per cent of employees were engaged ona part-time basis, with over one-third of part timeemployees in business support roles.‘Operators’ was the most common job family,accounting for 34 per cent of total employment. Theindustry appears to have a reasonably highly skilledemployment profile, with 22 per cent of the estimatedworkforce in a professional occupation, nine per centin a paraprofessional occupation and 18 per cent ofemployees being tradespersons. Civil engineers aloneaccounted for 10 per cent of the estimated employment.Table 3.10 sets out the distribution of employmentby key occupation for the respondents to the survey.These proportions have been calculated based on theestimated population levels and so differ slightly fromthe raw responses.Table 3.9: Companies providing water-related services to urban areas and/or regional areasIt is noted that the proportion of employees classifiedas ‘Business support’ in the non-WSAA segment, at10.5 per cent, was much lower than the 39 per centreported in the WSAA segment. This may be attributableto the apportionment of these roles in mixed sectorbusinesses in the non-WSAA segment.Segment of water sectorIn which areas do you provide services?Urban Regional Total samplePublic - State 3 2 3Public - Local/Regional 11 13 15Private Sector - Consultant 13 14 14Private Sector - Contractor/Constructor 8 8 9Private Sector - Manufacturer/Distributor 10 10 10Education and Research 3 3 3Total 48 50 5426 ICE WaRM • <strong>National</strong> <strong>Skills</strong> <strong>Audit</strong> (Phase One) Report