National Water Skills Audit - Australian Water Association
National Water Skills Audit - Australian Water Association
National Water Skills Audit - Australian Water Association
- No tags were found...

Create successful ePaper yourself
Turn your PDF publications into a flip-book with our unique Google optimized e-Paper software.
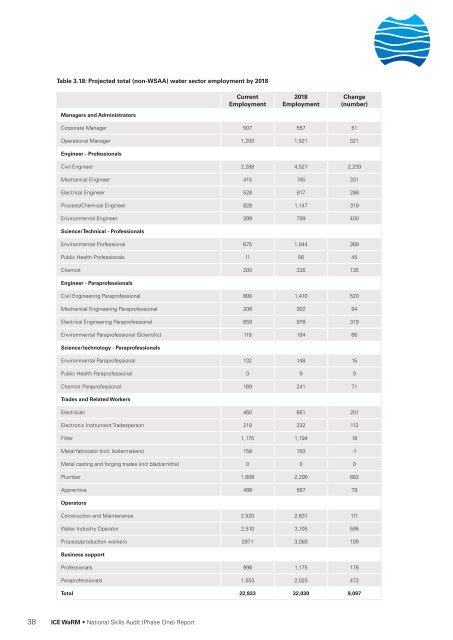
Table 3.18: Projected total (non-WSAA) water sector employment by 2018Managers and AdministratorsCurrentEmployment2018EmploymentChange(number)Corporate Manager 507 557 51Operational Manager 1,200 1,521 321Engineer - ProfessionalsCivil Engineer 2,288 4,527 2,239Mechanical Engineer 415 745 331Electrical Engineer 528 817 288Process/Chemical Engineer 828 1,147 319Environmental Engineer 399 799 400Science/Technical - ProfessionalsEnvironmental Professional 675 1,044 369Public Health Professionals 11 56 45Chemist 200 335 135Engineer - ParaprofessionalsCivil Engineering Paraprofessional 890 1,410 520Mechanical Engineering Paraprofessional 208 302 94Electrical Engineering Paraprofessional 659 978 319Environmental Paraprofessional (Scientific) 118 184 66Science/technology - ParaprofessionalsEnvironmental Paraprofessional 132 148 15Public Health Paraprofessional 0 9 9Chemist Paraprofessional 169 241 71Trades and Related WorkersElectrician 460 661 201Electronic Instrument Tradesperson 218 332 113Fitter 1,175 1,194 19Metal fabricator (incl. boilermakers) 158 150 -7Metal casting and forging trades (incl blacksmiths) 0 0 0Plumber 1,608 2,290 682Apprentice 488 567 79OperatorsConstruction and Maintenance 2,520 2,631 111<strong>Water</strong> Industry Operator 2,510 3,105 595Process/production workers 2971 3,080 109Business supportProfessionals 998 1,175 178Paraprofessionals 1,553 2,025 472Total 22,933 32,030 9,09738 ICE WaRM • <strong>National</strong> <strong>Skills</strong> <strong>Audit</strong> (Phase One) Report