Depreciation of Infrastructure Assets & Resource Allocation Decision ...
Depreciation of Infrastructure Assets & Resource Allocation Decision ...
Depreciation of Infrastructure Assets & Resource Allocation Decision ...

Create successful ePaper yourself
Turn your PDF publications into a flip-book with our unique Google optimized e-Paper software.
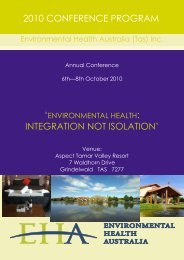
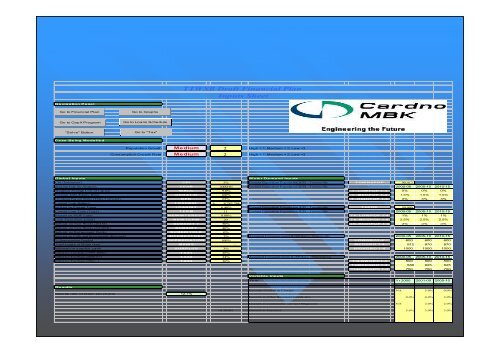
TTWSB Draft Financial Plan<br />
Inputs Sheet<br />
Na viga tion Pa ne l<br />
Go to Financial Plan<br />
Go to Graphs<br />
Go to CapX Program<br />
Go to Loans Schedule<br />
"Solve" Button<br />
Go to "Tax"<br />
Ca se Be ing Mode lle d<br />
Population Growth Medium 2 High = 1; Medium = 2; Low =3<br />
Consumption Growth Rate Medium 2 High = 1; Medium = 2; Low =3<br />
Globa l Inputs<br />
W a te r D e ma nd Inputs<br />
CPI (Indexation) CPI 2% Current Equivalent Population (EP) - Townsville T OW NSPOP 90,413<br />
Starting Year for Analysis YEAR 2000/01 Current Equivalent Population (EP) - Townsville 2000-05 2005-10 2010-15<br />
Weighted Average Cost <strong>of</strong> Capital WACC 9.0% T _LOW POP 1-4 0% 0% 0%<br />
Forecast Debt/Equity Ratio D ER AT IO 100% T _MED POP 1-4 1.5% 1.5% 1.5%<br />
Dividend Payout Ratio (Years 5 onward) DPR 65% T _HIGHPOP 1-4 3% 3% 3%<br />
Current Loan Balance LOANBAL $ 8,782,284<br />
Interest on Current Loans LOAN INT 6.40% Current Equivalent Population (EP) - Townsville T hPOP 50,000<br />
Current Loan Term (Years) T ERM 11 Current Equivalent Population (EP) - Townsville 2000-05 2005-10 2010-15<br />
Interest on NEW Loans N EWINT EREST 8.00% T h_LOWPOP 1-4 1% 1% 1%<br />
Loan Term (New Loans) N EW T ER M 20 T h_MEDPOP 1-4 2.5% 2.5% 2.5%<br />
Subsidy on New Works (DAM) SUBSID Y 1 50% T h_HIGH POP 1-4 3% 3% 3%<br />
Subsidy on New Works (OTHER) SUBSIDY 40%<br />
Subsidy on Replacement Works SUBSID YOLD 0%<br />
Interest on Cash and Investmants (Revenue) IN T ER EST REV 3% Assumed Consumptionm (L/EP/day) - Townsville 2000-05 2005-10 2010-15<br />
% <strong>Depreciation</strong> Funded DEPRECIAT ION 100% LOWGRO1-4 600 600 600<br />
Total Length <strong>of</strong> Mains (km) MAIN S - MED GR O 1-4 912 870 870<br />
Interest on surplus cash SURPLUS 3% H IGHGRO 1-4 1000 1000 1000<br />
Effective Tax Rate (1999-2000) T AX1 36%<br />
Effective Tax Rate (2000-01) T AX2 34% Assumed Consumptionm (L/EP/day) - Thuringowa 2000-05 2005-10 2010-15<br />
Effective Tax Rate (2001- ) T AX3 30% T hLOWGRO1-4 500 500 500<br />
T hMED GR O 1-4 588 625 625<br />
T hH IGHGRO 1-4 750 750 750<br />
Va ria ble Inputs 0 0 1<br />
Year Yr 2000 2001-05 2005-10<br />
Results<br />
Internal rate <strong>of</strong> return (20 years) 12.7%<br />
Forecast Growth in Charges NA 5.0% 0.0%<br />
Growth in Other Revenue (rentals etc) 0.0% 0.0% 2.0%<br />
Growth in Community Service Obligations NA 2.0% 2.0%<br />
10.39392 Growth in Expenses 5.6% 3.0% 3.0%