The world's local bank - HSBC
The world's local bank - HSBC
The world's local bank - HSBC

Create successful ePaper yourself
Turn your PDF publications into a flip-book with our unique Google optimized e-Paper software.
<strong>HSBC</strong> FRANCE<br />
Risk management (continued)<br />
risk management is presented to this committee,<br />
enabling it to gain an overview of the entire risk<br />
management system. Similarly, every <strong>HSBC</strong> France<br />
Board meeting involves a presentation of the main<br />
market risk information.<br />
Value at Risk<br />
One of the principal tools used by the Group to<br />
monitor and limit market risk exposure is VaR. Internal<br />
model of <strong>HSBC</strong> France is used to calculate a Value-at-<br />
Risk (VaR). VaR is a technique that estimates the<br />
potential losses that could occur on risk positions as a<br />
result of movements in market rates and prices over a<br />
specified time horizon and to a given level of confidence<br />
(for the Group, 99 per cent). <strong>HSBC</strong> France calculates<br />
VaR daily. <strong>The</strong> VaR model used by <strong>HSBC</strong> France, as<br />
for the Group, is based on historical simulation. <strong>The</strong><br />
historical simulation model derives plausible future<br />
scenarios from historical market rates time series, taking<br />
account of inter-relationships between different<br />
markets and rates, for example between interest rates<br />
and foreign exchange rates. Potential movements in<br />
market prices are calculated with reference to market<br />
data from the last two years. Internal model of<br />
<strong>HSBC</strong> France has been validated by the French<br />
regulator “Commission Bancaire” in 1999 for capital<br />
requirements calculations. <strong>HSBC</strong> France calculates a<br />
VaR based on an assumed holding period of 10 days.<br />
On a Group perspective, 1-day period VaR is obtained<br />
by dividing ten-day VaR by square root of ten.<br />
According to Group standards, the VaR exposure<br />
reported on pages 48 and 49 is expressed in VaR<br />
one-day.<br />
Although a useful guide to risk, VaR should<br />
always be viewed in the context of its limitations.<br />
For example:<br />
– the use of historical data as a proxy for estimating<br />
future events may not encompass all potential<br />
events, particularly those which are extreme in<br />
nature;<br />
– the use of a one-day holding period assumes that all<br />
positions can be liquidated or hedged in one day.<br />
This may not fully reflect the market risk arising at<br />
times of severe illiquidity, when a one-day holding<br />
period may be insufficient to liquidate or hedge all<br />
positions fully;<br />
– the use of a 99 per cent-confidence level, by<br />
definition, does not take into account losses that<br />
might occur beyond this level of confidence; and<br />
– VaR is calculated on the basis of exposures<br />
outstanding at the close of business and therefore<br />
does not necessarily reflect intra-day exposures.<br />
<strong>HSBC</strong> France recognises these limitations by<br />
supplementing its VaR limits by sensitivity limit<br />
structures. Additionally, stress testing scenarios are<br />
applied, both on individual portfolios and on <strong>HSBC</strong><br />
France’s consolidated positions. Stress scenarios are<br />
defined by a Group of specialists in Paris (market heads,<br />
controllers) in accordance with Group rules and practices.<br />
<strong>The</strong> one-day VaR, both trading and non-trading,<br />
for Global Markets was as follows:<br />
(in millions of euros)<br />
Total<br />
At 31 December 2005 . . . . . . . . . . . . . . . . . . . 9.5<br />
At 31 December 2004 . . . . . . . . . . . . . . . . . . . 10.6<br />
(in millions of euros) Average Minimum Maximum<br />
2005 . . . . . . . . . . . . . . . . . 13.7 5.6 22.9<br />
2004 . . . . . . . . . . . . . . . . . 9.9 6.0 14.7<br />
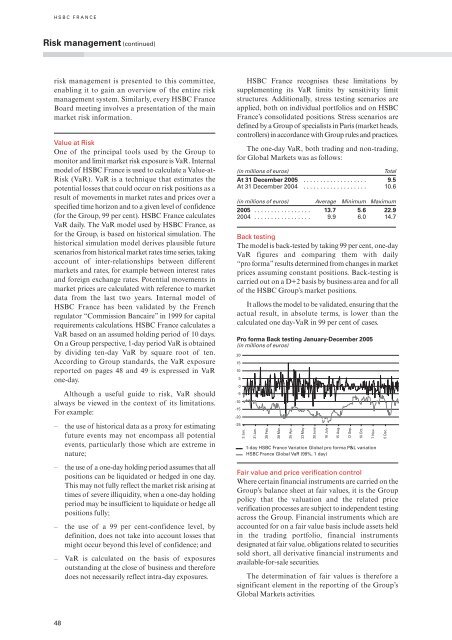
Back testing<br />
<strong>The</strong> model is back-tested by taking 99 per cent, one-day<br />
VaR figures and comparing them with daily<br />
“pro forma”results determined from changes in market<br />
prices assuming constant positions. Back-testing is<br />
carried out on a D+2 basis by business area and for all<br />
of the <strong>HSBC</strong> Group’s market positions.<br />
It allows the model to be validated, ensuring that the<br />
actual result, in absolute terms, is lower than the<br />
calculated one day-VaR in 99 per cent of cases.<br />
Pro forma Back testing January-December 2005<br />
(in millions of euros)<br />
20<br />
15<br />
10<br />
5<br />
0<br />
-5<br />
-10<br />
-15<br />
-20<br />
-25<br />
3 Jan.<br />
31 Jan.<br />
28 Feb.<br />
28 Mar.<br />
25 Apr.<br />
23 May<br />
1-day <strong>HSBC</strong> France Variation Global pro forma P&L variation<br />
<strong>HSBC</strong> France Global VaR (99%, 1 day)<br />
20 June<br />
Fair value and price verification control<br />
Where certain financial instruments are carried on the<br />
Group’s balance sheet at fair values, it is the Group<br />
policy that the valuation and the related price<br />
verification processes are subject to independent testing<br />
across the Group. Financial instruments which are<br />
accounted for on a fair value basis include assets held<br />
in the trading portfolio, financial instruments<br />
designated at fair value, obligations related to securities<br />
sold short, all derivative financial instruments and<br />
available-for-sale securities.<br />
<strong>The</strong> determination of fair values is therefore a<br />
significant element in the reporting of the Group’s<br />
Global Markets activities.<br />
18 July<br />
15 Aug.<br />
12 Sep.<br />
10 Oct.<br />
7 Nov.<br />
5 Dec.<br />
48