Download - forensic medicine
Download - forensic medicine
Download - forensic medicine

Create successful ePaper yourself
Turn your PDF publications into a flip-book with our unique Google optimized e-Paper software.
JIAFM, 2007 - 29(4); ISSN: 0971-0973<br />
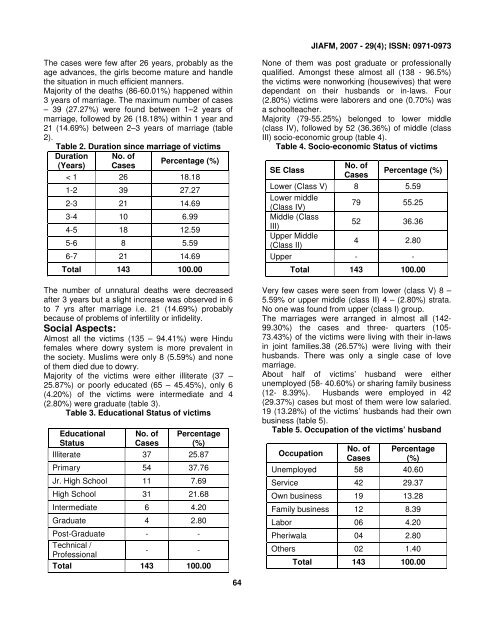
The cases were few after 26 years, probably as the<br />
age advances, the girls become mature and handle<br />
the situation in much efficient manners.<br />
Majority of the deaths (86-60.01%) happened within<br />
3 years of marriage. The maximum number of cases<br />
– 39 (27.27%) were found between 1–2 years of<br />
marriage, followed by 26 (18.18%) within 1 year and<br />
21 (14.69%) between 2–3 years of marriage (table<br />
2).<br />
Table 2. Duration since marriage of victims<br />
Duration<br />
(Years)<br />
No. of<br />
Cases<br />
Percentage (%)<br />
< 1 26 18.18<br />
1-2 39 27.27<br />
2-3 21 14.69<br />
3-4 10 6.99<br />
4-5 18 12.59<br />
5-6 8 5.59<br />
6-7 21 14.69<br />
Total 143 100.00<br />
The number of unnatural deaths were decreased<br />
after 3 years but a slight increase was observed in 6<br />
to 7 yrs after marriage i.e. 21 (14.69%) probably<br />
because of problems of infertility or infidelity.<br />
Social Aspects:<br />
Almost all the victims (135 – 94.41%) were Hindu<br />
females where dowry system is more prevalent in<br />
the society. Muslims were only 8 (5.59%) and none<br />
of them died due to dowry.<br />
Majority of the victims were either illiterate (37 –<br />
25.87%) or poorly educated (65 – 45.45%), only 6<br />
(4.20%) of the victims were intermediate and 4<br />
(2.80%) were graduate (table 3).<br />
Table 3. Educational Status of victims<br />
Educational<br />
Status<br />
No. of<br />
Cases<br />
Percentage<br />
(%)<br />
Illiterate 37 25.87<br />
Primary 54 37.76<br />
Jr. High School 11 7.69<br />
High School 31 21.68<br />
Intermediate 6 4.20<br />
Graduate 4 2.80<br />
Post-Graduate - -<br />
Technical /<br />
Professional<br />
- -<br />
Total 143 100.00<br />
None of them was post graduate or professionally<br />
qualified. Amongst these almost all (138 - 96.5%)<br />
the victims were nonworking (housewives) that were<br />
dependant on their husbands or in-laws. Four<br />
(2.80%) victims were laborers and one (0.70%) was<br />
a schoolteacher.<br />
Majority (79-55.25%) belonged to lower middle<br />
(class IV), followed by 52 (36.36%) of middle (class<br />
III) socio-economic group (table 4).<br />
Table 4. Socio-economic Status of victims<br />
SE Class<br />
No. of<br />
Cases<br />
Percentage (%)<br />
Lower (Class V) 8 5.59<br />
Lower middle<br />
(Class IV)<br />
79 55.25<br />
Middle (Class<br />
III)<br />
52 36.36<br />
Upper Middle<br />
(Class II)<br />
4 2.80<br />
Upper - -<br />
Total 143 100.00<br />
Very few cases were seen from lower (class V) 8 –<br />
5.59% or upper middle (class II) 4 – (2.80%) strata.<br />
No one was found from upper (class I) group.<br />
The marriages were arranged in almost all (142-<br />
99.30%) the cases and three- quarters (105-<br />
73.43%) of the victims were living with their in-laws<br />
in joint families.38 (26.57%) were living with their<br />
husbands. There was only a single case of love<br />
marriage.<br />
About half of victims’ husband were either<br />
unemployed (58- 40.60%) or sharing family business<br />
(12- 8.39%). Husbands were employed in 42<br />
(29.37%) cases but most of them were low salaried.<br />
19 (13.28%) of the victims’ husbands had their own<br />
business (table 5).<br />
Table 5. Occupation of the victims’ husband<br />
Occupation<br />
No. of<br />
Cases<br />
Percentage<br />
(%)<br />
Unemployed 58 40.60<br />
Service 42 29.37<br />
Own business 19 13.28<br />
Family business 12 8.39<br />
Labor 06 4.20<br />
Pheriwala 04 2.80<br />
Others 02 1.40<br />
Total 143 100.00<br />
64
![syllabus in forensic medicine for m.b.b.s. students in india [pdf]](https://img.yumpu.com/48405011/1/190x245/syllabus-in-forensic-medicine-for-mbbs-students-in-india-pdf.jpg?quality=85)
![SPOTTING IN FORENSIC MEDICINE [pdf]](https://img.yumpu.com/45856557/1/190x245/spotting-in-forensic-medicine-pdf.jpg?quality=85)
![JAFM-33-2, April-June, 2011 [PDF] - forensic medicine](https://img.yumpu.com/43461356/1/190x245/jafm-33-2-april-june-2011-pdf-forensic-medicine.jpg?quality=85)
![JIAFM-33-4, October-December, 2011 [PDF] - forensic medicine](https://img.yumpu.com/31013278/1/190x245/jiafm-33-4-october-december-2011-pdf-forensic-medicine.jpg?quality=85)