design of composite columns made of concrete ... - CCVI Information
design of composite columns made of concrete ... - CCVI Information
design of composite columns made of concrete ... - CCVI Information

Create successful ePaper yourself
Turn your PDF publications into a flip-book with our unique Google optimized e-Paper software.
DESIGN OF COMPOSITE COLUMNS MADE OF CONCRETE FILLED<br />
TUBES WITH INNER MASSIVE CORE PROFILES AND HIGH<br />
STRENGTH MATERIALS<br />
Univ.-Pr<strong>of</strong>. Dr.-Ing. G. Hanswille<br />
Institute for Steel and Composite Structures, University <strong>of</strong> Wuppertal<br />
Wuppertal, Germany<br />
stahlbau@uni-wuppertal.de<br />
Dipl.-Ing. M. Lippes<br />
Gevelsberg, Germany<br />
lippes@email.de<br />
ABSTRACT<br />
This paper deals with the <strong>design</strong> <strong>of</strong> <strong>composite</strong> <strong>columns</strong> <strong>made</strong> <strong>of</strong> <strong>concrete</strong> filled tubes with inner<br />
massive core pr<strong>of</strong>iles as well as high strength steel and high strength <strong>concrete</strong>. New research<br />
work is presented regarding the effect <strong>of</strong> residual stresses in inner core pr<strong>of</strong>iles resulting from<br />
the cooling process during fabrication. Based on Finite Element studies new models are<br />
presented for the determination <strong>of</strong> the distribution <strong>of</strong> residual stresses in solid round steel bars<br />
taking into account the steel grade, the dimensions <strong>of</strong> the core pr<strong>of</strong>iles and the cooling<br />
conditions during fabrication. Additional theoretical investigations are presented to estimate the<br />
effects <strong>of</strong> creep and shrinkage under long term loading. Finally recommendations are given for<br />
the <strong>design</strong> <strong>of</strong> this type <strong>of</strong> <strong>composite</strong> column based on the methods given in Eurocode 4-1-1.<br />
1 INTRODUCTION<br />
The use <strong>of</strong> <strong>composite</strong> <strong>columns</strong> <strong>made</strong> <strong>of</strong> high strength steel and high strength <strong>concrete</strong> is<br />
beneficial in order to realise a high resistance in combination with small dimensions <strong>of</strong> cross<br />
sections. At present the <strong>design</strong> <strong>of</strong> <strong>composite</strong> <strong>columns</strong> according to Eurocode 4 Part 1-1 /1/ is<br />
applicable only for steel grades up to S460 and <strong>concrete</strong> strengths up to C50/60 because no<br />
sufficient test data are available for higher strength. In the following new test results and<br />
analytical investigations are presented to open the scope in Eurocode 4-1-1 especially for high<br />
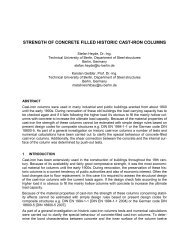
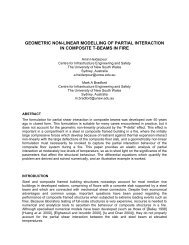
strength <strong>concrete</strong>. To fulfil the demand for more slender <strong>columns</strong> the use <strong>of</strong> <strong>concrete</strong> filled tubes<br />
with additional massive inner core pr<strong>of</strong>iles is very<br />
effective. Due to limited information about the effects <strong>of</strong><br />
residual stresses in massive core pr<strong>of</strong>iles which<br />
develop during production, the use <strong>of</strong> massive round<br />
steel cores in general is also not yet covered by the<br />
standards. Therefore numerical investigations for the<br />
determination <strong>of</strong> residual stresses in massive round<br />
steel bars had been <strong>made</strong> in order to widen the scope<br />
in EN 1994-1-1 /1/ for this type <strong>of</strong> column.<br />
Fig. 1- Composite column with inner<br />
massive core pr<strong>of</strong>ile
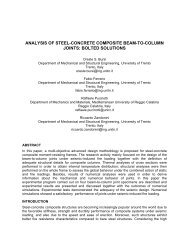
2 NEW TESTS AND EXPERIMENTAL SETUP<br />
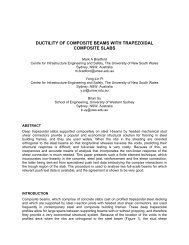
The test program comprises 6 <strong>columns</strong> with <strong>concrete</strong> filled tubes (series C1) and further 6<br />
<strong>columns</strong> with additional massive inner core pr<strong>of</strong>iles with a diameter <strong>of</strong> 70 mm (series C2).<br />
Columns in axial compression and with uniaxial bending due to end eccentricity e o <strong>of</strong> 5mm,<br />
20 mm and 60 mm were performed. <strong>Information</strong> about the test specimen and the test program<br />
is given in Figure 2 and Table 1. The <strong>concrete</strong> cylinder strength was 95 N/mm 2 , the yield<br />
strength <strong>of</strong> the tubes 333 N/mm 2 and the yield strength <strong>of</strong> the massive round core was 411<br />
N/mm 2 in the centre <strong>of</strong> the pr<strong>of</strong>ile and 447 N/mm 2 at the surface.<br />
test series C1<br />
tube 323,9 x 4<br />
F<br />
e o<br />
crushing <strong>of</strong> <strong>concrete</strong><br />
test series C2<br />
240<br />
plate<br />
480x360x80<br />
3792 mm<br />
longitudinal cracks<br />
local buckling<br />
core ∅ 70<br />
e o<br />
100<br />
centring bar<br />
360<br />
cracks in the<br />
tension zone<br />
80<br />
r=30<br />
e o<br />
480<br />
Fig. 2 – Test setup<br />
Fig. 3 – typical failure mode<br />
According to EC4-1-1 appendix B the <strong>columns</strong> were preloaded. First the load was applied in<br />
increments up to approximately 50% <strong>of</strong> the expected failure load and then cycled 150 times<br />
between 25% and 50% <strong>of</strong> the expected failure load. During the cyclic loading the load was<br />
applied force controlled. After this procedure the load was increased and applied displacement<br />
controlled up to the failure load. Each test was held at specific load levels for more than 15<br />
minutes to get information about relaxation. In this manner the ultimate static load considering<br />
relaxation effects could be determined. In all tests a nearly constant reduction <strong>of</strong> approximately<br />
4% <strong>of</strong> the ultimate short time static load could be observed. When reaching the ultimate load all<br />
tests failed in the middle third <strong>of</strong> the column by crushing <strong>of</strong> <strong>concrete</strong> and local buckling <strong>of</strong> the<br />
steel tube (Figure 3).<br />
Two <strong>columns</strong> did not reach the expected failure load. The unexpected failure was caused by<br />
airlocks due to an inefficient compaction <strong>of</strong> the <strong>concrete</strong> in the middle <strong>of</strong> the column and under<br />
the end plates. The <strong>concrete</strong> had been filled from the top. Based on the results it can be stated<br />
that this method and a rapid settling <strong>of</strong> the <strong>concrete</strong> leads to the risk <strong>of</strong> an insufficient<br />
compaction <strong>of</strong> the <strong>concrete</strong> especially when using high strength <strong>concrete</strong>. Because <strong>of</strong> the<br />
unexpected results these <strong>columns</strong> were excluded from further analyses. The horizontal<br />
deflection under maximum loads and the strains measured in the middle <strong>of</strong> the <strong>columns</strong> were<br />
used to determine the internal forces and the effective load eccentricity at failure load. Using the<br />
experimental stress-strain curves the bending moment in the middle <strong>of</strong> the column was<br />
calculated with the assumption that the cross section remains plain. The evaluation <strong>of</strong> the
tangential strains in the tubes indicated that the confinement effect <strong>of</strong> the tube on the<br />
compressive strength <strong>of</strong> <strong>concrete</strong> can be neglected.<br />
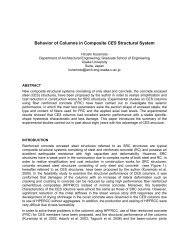
The evaluation <strong>of</strong> the internal forces showed that the effective eccentricity e x for the<br />
recalculation <strong>of</strong> the <strong>columns</strong> depends on the load level and is given by e x = e o +Δe x according to<br />
Figure 4. At the beginning <strong>of</strong> loading the effective eccentricity was approximately equal to the<br />
distance between the axis <strong>of</strong> the load introduction and the centre line <strong>of</strong> the centring bar. By<br />
increasing the load and also the rotation at the bearing <strong>of</strong> the column the eccentricity moved to<br />
the edge <strong>of</strong> the centring bar. The evaluation showed that the effective eccentricity converges to<br />
a value Δe x,u with increasing loading so that the load eccentricity at failure could be exactly<br />
determined (Figure 4).<br />
Table 1 – Experimental and calculated ultimate loads and corresponding horizontal<br />
deformations<br />
test series C1<br />
test series C2<br />
test 1 3 4 5 6 1 2 3 4 6<br />
experimental values<br />
e 0 [mm] 20 60 60 5 5 20 20 60 60 5<br />
F u [kN] 5439 3192 2986 5980 5903 5560 5322 3392 3277 7359<br />
Δe x,u [mm] 10 14 15 13 15 10 17 10 11 7<br />
u x (F u ) [mm] 12.4 20.2 19.6 15.1 11.6 16.0 16.1 23.8 23.2 15.0<br />
e x,u =e o +Δe xu +u x 42.4 94.2 94.6 33.1 30.6 46.0 53.1 93.8 94.2 27.0<br />
results <strong>of</strong> the recalculation with the FE - model<br />
e o,cal [mm] 30 74 75 18 20 30 37 70 71 12<br />
F u [kN] 4981 3247 3188 6182 5938 5493 5094 3401 3409 6969<br />
u x (F u ) [mm] 17.5 26.5 25.4 17.4 17.9 20.5 22.2 28.4 29.6 14.<br />
e x,u =e o,cal +u x 47.5 100.5 100.4 35.4 37.9 50.5 59.2 98.4 100.6 26.3<br />
Δe x [mm]<br />
F<br />
F<br />
40<br />
30<br />
20<br />
e x<br />
u x<br />
10<br />
0,2<br />
0,4<br />
0,6<br />
0,8<br />
Δe x,u F<br />
1,0 F u<br />
Δe x<br />
e o<br />
e x<br />
Fig. 4 – Relation between the effective eccentricity and the load level
3 NUMERICAL INVESTIGATIONS AND EVALUATION OF TEST RESULTS<br />
For the recalculation <strong>of</strong> the <strong>columns</strong> a 3-dimensional model with cuboid elements <strong>of</strong> the FEprogram<br />
Ansys was used. The mechanical properties <strong>of</strong> steel were represented by a multi-linear<br />
elastic-plastic stress-strain relationship on the basis <strong>of</strong> the von Mises yield criterion. For the<br />
mechanical properties <strong>of</strong> <strong>concrete</strong> an additional condition was used to model the low resistance<br />
against tension stresses more accurately /3/. In order to take into account the bond behaviour<br />
between steel and <strong>concrete</strong> in the interfaces between steel and <strong>concrete</strong> contact elements were<br />
used with a friction coefficient µ = 0.5. The model allows to consider initial bow imperfections<br />
and additional eccentric positions <strong>of</strong> the massive inner steel core. A typical relation between the<br />
normal force and the bending moment at midspan is shown in Figure 6. The measured and<br />
calculated strains in Figure 6 demonstrate that for <strong>design</strong> it can be assumed that the cross<br />
section remains plain.<br />
In order to check the safety level in comparison with the simplified <strong>design</strong> methods in Eurocode<br />
4 the general <strong>design</strong> method in Eurocode 4 has to be used. Regarding the safety concept in<br />
case <strong>of</strong> non linear finite element analysis the Eurocodes for <strong>composite</strong> structures give no clear<br />
guidance. Therefore the method developed in /4, 5/ was used, where for the resistance an<br />
overall safety factor γ R has to be determined which depends on the relation between the acting<br />
normal force and the acting bending moment. The safety factor γ R can be determined using the<br />
full plastic cross-section interaction curve <strong>of</strong> the section. As shown in Figure 5, the interaction<br />
curve using the mean values (measured values in case <strong>of</strong> tests) for the material strength as well<br />
as the curve using the <strong>design</strong> values according to Eurocode 4 have to be calculated. For the<br />
determination <strong>of</strong> the interaction curve based on <strong>design</strong> values the partial factor 1.5 for <strong>concrete</strong>,<br />
1.1 for structural steel and 1.15 for reinforcement have to be used. For a given combination <strong>of</strong><br />
internal forces N Ed and M Ed the safety factor γ R is given by the ratio <strong>of</strong> the vectors R pl,m and R pl,d .<br />
The incremental finite element analysis has to be performed using an initial geometrical bow<br />
imperfection and considering residual stresses in the massive inner core pr<strong>of</strong>ile. It has to be<br />
verified, that the load amplification factor λ u is greater than the overall safety factor γ R for the<br />
resistance.<br />
σ c<br />
f cm<br />
σ s<br />
0,4 f c<br />
E cm<br />
ε c1<br />
ε c1u<br />
N Ed<br />
N<br />
f ct<br />
E d<br />
R pl,d<br />
R pl,m<br />
B<br />
M Ed<br />
<strong>concrete</strong><br />
A<br />
ε c<br />
f sm<br />
M<br />
f tm<br />
E s<br />
reinforcement<br />
σ a<br />
E v<br />
Rpl,m<br />
γR<br />
=<br />
Rpl,d<br />
- ε s<br />
F d<br />
F<br />
w d<br />
F u,m<br />
= λ u<br />
F d<br />
w u<br />
f u<br />
+<br />
f y<br />
w<br />
-<br />
E a<br />
ε v<br />
geometrical<br />
imperfection<br />
F<br />
e o<br />
w o =L/1000<br />
structural steel<br />
w o<br />
ε a<br />
residual<br />
stresses in the<br />
core pr<strong>of</strong>ile<br />
σ E<br />
-<br />
d K<br />
d K<br />
d<br />
Fig. 5 – Safety concept in case <strong>of</strong> non linear <strong>design</strong> <strong>of</strong> <strong>composite</strong> <strong>columns</strong> /4,5/
The test results were evaluated based on the statistical method given in EN 1990, Appendix D<br />
in order to determine characteristic and <strong>design</strong> values. This method is based on a comparison<br />
<strong>of</strong> the experimental F u,exp and theoretical F u,cal values <strong>of</strong> the ultimate load, where the theoretical<br />
values result from a mechanical model. For the <strong>columns</strong> the theoretical values F u,cal were<br />
determined by help <strong>of</strong> a finite element analysis taking into account the measured stress strain<br />
relations from the tests and considering residual stress in the core pr<strong>of</strong>iles determined according<br />
to the following chapter 4. For the calculation <strong>of</strong> the ultimate load F um in addition to the end<br />
eccentricities acc. to Table 1 geometrical bow imperfections with a parabolic shape and a<br />
maximum value L/1000 were assumed. The results <strong>of</strong> the statistical evaluation <strong>of</strong> the test results<br />
acc. to EN 1990 are shown in Figure 7. The characteristic values are given by F R,k = 0.9 F u,m<br />
and the appropriate <strong>design</strong> value result to F R,d = 0.79 F u,m . For comparison in Figure 7 also the<br />
<strong>design</strong> values resulting from the general <strong>design</strong> method in Eurocode 4-1-1 are shown. These<br />
values calculated with the partial factors acc. to Eurocode 4-1-1 and the safety concept are<br />
shown in Figure 5. It can be seen that the general <strong>design</strong> method in Eurocode 4-1-1 leads to<br />
safe results also in case <strong>of</strong> high strength materials.<br />
F [kN]<br />
Test C2-6<br />
Strains at midspan<br />
F u,exp , F d [MN]<br />
8000<br />
6000<br />
4000<br />
FEM<br />
ε [‰] strain gauges<br />
F 2<br />
F 1<br />
-4<br />
FE-model<br />
F<br />
-3<br />
-2<br />
F 2 = 6969 kN<br />
-1<br />
F 1 = 6000 kN<br />
8,0<br />
6,0<br />
4,0<br />
characteristic<br />
values F Rk<br />
<strong>design</strong> values F Rd<br />
mean values F um<br />
2000<br />
Test<br />
100<br />
200<br />
M [kNm]<br />
N<br />
M<br />
strain<br />
gauges<br />
2,0<br />
statistical evaluation acc.<br />
to EN 1990<br />
<strong>design</strong> values based on<br />
the general <strong>design</strong><br />
method in EN 1994-1-1<br />
2,0<br />
4,0<br />
6,0<br />
8,0<br />
F u,cal<br />
Fig. 6 - Relation between the normal force and the<br />
bending moment at midspan<br />
and strain distribution<br />
Fig. 7 – Comparison <strong>of</strong> the experimental<br />
and theoretical ultimate loads and test<br />
evaluation acc. to EN 1990<br />
4 RESIDUAL STRESSES IN MASSIVE ROUND STEEL BARS<br />
As mentioned before for the determination <strong>of</strong> ultimate loads <strong>of</strong> <strong>columns</strong>, structural and<br />
geometrical imperfections must be taken into account. For <strong>composite</strong> <strong>columns</strong> with inner<br />
massive core pr<strong>of</strong>iles especially the residual stresses in the steel cores have to be considered.<br />
Residual stresses arise during production due to the uneven temperature distribution while the<br />
steel bar is cooling <strong>of</strong>f. The surface areas are cooling down and hardening faster with ongoing<br />
cooling. The later cooling <strong>of</strong> the inner parts causes then compression in the already hardened<br />
part near the surface and tension stresses in the inner parts <strong>of</strong> the cross section. In <strong>composite</strong><br />
<strong>columns</strong> these residual stresses cause a reduction <strong>of</strong> flexural stiffness and a reduction <strong>of</strong> the<br />
ultimate load due to earlier yielding <strong>of</strong> structural steel and increasing yielding zones in the<br />
structural steel section.
The simplified <strong>design</strong> method in Eurocode 4-1-1 covers the influence <strong>of</strong> residual stresses by<br />
equivalent initial bow imperfections where the distribution <strong>of</strong> residual stresses in structural steel<br />
sections is taken into account by different buckling curves. For <strong>columns</strong> with round inner core<br />
pr<strong>of</strong>iles until now no information is given in Eurocode 4-1-1 regarding the relevant buckling<br />
curve and the corresponding member imperfections. Up to now only a few experimental<br />
investigations are known which give information about the distribution <strong>of</strong> residual stresses in<br />
massive round steel bars /6/.<br />
To obtain more detailed information about the stress distribution and the maximum stresses, the<br />
cooling process was simulated using the FE-program ANSYS. The residual stresses were<br />
calculated for different diameters and steel grades. The temperature dependent material<br />
properties were taken from DIN EN 1993-1-2 /7/. Furthermore it was assumed, that there is no<br />
subsequent treatment to diminish the residual stresses.<br />
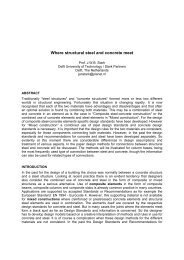
First <strong>of</strong> all the time-dependent temperature distribution was determined. The calculations were<br />
performed for the period <strong>of</strong> cooling after the final rolling <strong>of</strong> the steel. Thereby the convective and<br />
radiative heat transmission coefficients and the initial temperature <strong>of</strong> the massive pr<strong>of</strong>ile were<br />
the most important parameters which influence the distribution and values <strong>of</strong> the residual<br />
stresses. The simulations were performed with two different cooling conditions. Additional to<br />
normal cooling conditions unfavourable environmental conditions were examined. To achieve<br />
this, the convective heat transfer coefficient was determined for different continuous air flow. For<br />
the normal cooling conditions an air flow rate <strong>of</strong> w=1 m/s was assumed. With an air flow rate <strong>of</strong><br />
w=5 m/s extremely unfavourable cooling conditions were taken into account. This extreme<br />
cooling condition was used, to get information about the relation between the residual stresses<br />
and the different cooling conditions. The interaction between convection and radiation was not<br />
considered because this leads to a more slowly cooling and therefore to smaller residual<br />
stresses. Considering the interval <strong>of</strong> cooling from the initial state down to 100 °C the<br />
environmental conditions lead to cooling durations as shown in Figure 8. Figure 9 shows the<br />
development <strong>of</strong> the temperature in the centre and at the surface for a solid bar with a diameter<br />
<strong>of</strong> 200 mm.<br />
ΔT [K]<br />
T [°C]<br />
T R<br />
T i<br />
T a<br />
w<br />
300<br />
1200<br />
ΔT = T i –T R.<br />
24<br />
16<br />
12<br />
6<br />
d K<br />
t (T R = 100 o C) [h]<br />
Case 1:<br />
T i = 1000°C,<br />
T a = 20°C and<br />
α c (w = 5 m/s)<br />
Case 2:<br />
T i = 1200°C,<br />
T a = 20°C and<br />
α c (w = 1 m/s)<br />
d k [mm]<br />
200 400 600<br />
Fig. 8 –Duration <strong>of</strong> cooling down to a<br />
temperature T R =100 o C at the surface<br />
<strong>of</strong> the solid pr<strong>of</strong>ile<br />
250<br />
200<br />
150<br />
100<br />
50<br />
1000<br />
800<br />
600<br />
400<br />
200<br />
temperature T i<br />
temperature<br />
difference ΔT<br />
0 1 2 3 4 5 6 7<br />
T i<br />
d k =200mm<br />
T R<br />
normal cooling conditions<br />
extreme cooling conditions<br />
t [h]<br />
Fig. 9 – Time dependent development <strong>of</strong> the<br />
temperature and the temperature difference for a solid<br />
bar with a diameter d k = 200 mm
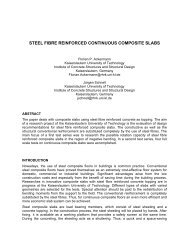
With the temperature dependent stress-strain relationships according to /7/ the distributions <strong>of</strong><br />
the residual stresses can be determined from the calculated time-dependent temperature<br />
distributions. Different environmental conditions affect the residual stresses significantly. For<br />
normal cooling conditions the distribution is characterised by nearly constant tensile stresses in<br />
the inner part <strong>of</strong> the cross section. When the cooling speed is increased the stress distribution<br />
can be approximated by a parabolic function. The area with constant tensile stresses in the<br />
centre becomes more distinctive for higher steel grades (Figure 10).<br />
σ E (r) [N/mm 2 ]<br />
200<br />
100<br />
0<br />
-100<br />
-200<br />
S235<br />
S460<br />
approximation<br />
S355<br />
r<br />
r K<br />
0,2 0,4 0,6 0,8 1,0<br />
d k = 200 mm<br />
-400<br />
-300<br />
-200<br />
-100<br />
σ ED [N/mm 2 ]<br />
extreme cooling<br />
conditions<br />
S460<br />
approximation<br />
S355<br />
S235<br />
normal cooling<br />
conditions<br />
σ ED -<br />
+<br />
r<br />
r<br />
r K<br />
d K<br />
Approximation:<br />
dK<br />
2<br />
σED<br />
= σED,o<br />
[N/ mm ]<br />
200<br />
2<br />
σED,o<br />
= −125<br />
N/ mm<br />
⎡ 2<br />
2r ⎤<br />
σ E (r) =σ ED ⎢1<br />
−<br />
2 ⎥<br />
⎢⎣<br />
r K ⎥⎦<br />
200 400 600<br />
d k [mm]<br />
Fig. 10 – Influence <strong>of</strong> the steel<br />
grade on the distribution <strong>of</strong> residual<br />
stresses in solid round bars<br />
Fig. 11 – Maximum compressive residual stresses at the<br />
surface <strong>of</strong> the cross section as a function <strong>of</strong> the steel<br />
grade and the diameter d k<br />
Figure 11 shows that the approximation for maximum residual compressive stress at the surface<br />
<strong>of</strong> solid bars and the distribution <strong>of</strong> the residual stresses is in good agreement with the more<br />
accurate values. Because the residual stresses near the surface are mainly responsible for the<br />
reduction <strong>of</strong> the ultimate loads for the recalculation <strong>of</strong> the tests the approximation was used.<br />
5 INFLUENCES OF CREEP AND SHRINKAGE<br />
Under permanent loads creep and shrinkage <strong>of</strong> <strong>concrete</strong> in <strong>composite</strong> members cause a<br />
redistribution <strong>of</strong> the sectional internal forces from the <strong>concrete</strong> section to the structural steel<br />
section. This can lead in case <strong>of</strong> further loading to an earlier yielding in the steel section, to<br />
larger yielding zones and therefore to a significant reduction <strong>of</strong> the flexural stiffness at ultimate<br />
limit states. For <strong>columns</strong> in compression and bending the decrease <strong>of</strong> the flexural stiffness<br />
causes increasing horizontal deformations and additional second order effects. Eurocode 4-1-1<br />
takes into account these effects by a reduction <strong>of</strong> the flexural stiffness <strong>of</strong> the column. The tests<br />
were subjected to short-term loading only. To obtain information about the influence <strong>of</strong> creep<br />
and shrinkage more exact calculations were done, where the creep function for high strength<br />
<strong>concrete</strong> according to Eurocode 2-1 /8/ and the test results in /9/ were used. The tests with<br />
<strong>concrete</strong> filled hollow sections in /9/ show that for <strong>concrete</strong> filled tubes a reduced creep<br />
coefficient can be assumed, which is in the range <strong>of</strong> 25% <strong>of</strong> the value for a cross section with its
surface fully exposed to the ambient environmental conditions. In a first step the redistribution <strong>of</strong><br />
sectional forces and the horizontal deformations were determined for permanent loads by an<br />
incremental analysis taking into account second order effects. In a second step the ultimate<br />
loads were determined by a non-linear calculation taking into account the redistribution <strong>of</strong><br />
internal forces and the additional deformations caused by creep and shrinkage due to<br />
permanent loads and the effects <strong>of</strong> residual stresses, geometrical imperfections and non-linear<br />
material behaviour. The calculations were carried out for a nominally pinned column in axial<br />
compression with a representative cross-section with a <strong>concrete</strong> filled steel tube 406.4 x 8.8,<br />
steel grade S355 and <strong>concrete</strong> strengths <strong>of</strong> 60 N/mm² and 100 N/mm². Table 2 shows the<br />
results <strong>of</strong> four <strong>columns</strong> with a related slenderness <strong>of</strong> 1.0 and 2.0 where F Rd,c+s is the <strong>design</strong><br />
value <strong>of</strong> the ultimate load taking into account creep and shrinkage and F Rd is the ultimate load<br />
without creep and shrinkage effects. It can be seen that in case <strong>of</strong> <strong>concrete</strong> filled tubes with high<br />
strength <strong>concrete</strong> the effects <strong>of</strong> creep and shrinkage lead to a reduction <strong>of</strong> the ultimate load less<br />
than 5% even if the column has a high related slenderness. Comparative results can be<br />
achieved by using the simplified <strong>design</strong> method given in EC4-1-1.<br />
Table 2 – Effects <strong>of</strong> creep and shrinkage and comparison with the simplified <strong>design</strong> method in<br />
EN 1994-1-1<br />
compressive<br />
cylinder strength<br />
f c<br />
related<br />
slenderness<br />
λ k<br />
f c = 60 N/mm 2 1.0<br />
f c = 60 N/mm 2 2.0<br />
f c = 100 N/mm 2 1.0<br />
f c = 100 N/mm 2 2.0<br />
creep<br />
coefficient<br />
ϕ(t ∞ ,t 0 )<br />
Exact non-linear<br />
calculation<br />
F Rd<br />
[kN]<br />
F +<br />
L/w o<br />
Rd,c s<br />
FRd<br />
Simplified method acc. to<br />
Eurocode 4-1-1 with equivalent<br />
imperfections w o acc. to chapter 6<br />
F Rd<br />
[kN]<br />
0 5912 5679<br />
0.97 360<br />
0.25x 1.34 5722<br />
5555<br />
0 2112 2037<br />
0.98 440<br />
0.25x 1.34 2077<br />
1941<br />
0 7425 7437<br />
0.97 360<br />
0.25x 0.873 7224<br />
7324<br />
0 2869 2842<br />
0.98 440<br />
0.25x 0.873 2844<br />
2724<br />
F Rd,c + s<br />
FRd<br />
0.98<br />
0.95<br />
0.98<br />
0.96<br />
6 PROPOSALS FOR A SIMPLIFIED DESIGN METHOD BASED ON EUROCODE 4<br />
The use <strong>of</strong> the general <strong>design</strong> method in Eurocode 4 based on a geometric and physical<br />
nonlinear calculation can not be recommended for practical <strong>design</strong> because <strong>of</strong> an enormous<br />
calculation effort. In the following a simplified method is presented which is based on the<br />
simplified <strong>design</strong> method in Eurocode 4-1-1 and shown in Figure 12. Internal forces have to be<br />
determined by second order linear elastic analysis with an effective flexural stiffness (EI) eff,II .<br />
This stiffness accounts for the cracking <strong>of</strong> <strong>concrete</strong> and the yield zones in the structural steel<br />
section (factors K o and K e,II in Fig. 12). The influence <strong>of</strong> geometrical and structural imperfections<br />
is taken into account by equivalent geometrical bow imperfections, which depend on the type <strong>of</strong><br />
cross-section. In case <strong>of</strong> axial compression and bending it has to be verified that in the critical<br />
cross-section the <strong>design</strong> value <strong>of</strong> the second order bending moment M Ed does not exceed the<br />
<strong>design</strong> value <strong>of</strong> bending resistance M Rd <strong>of</strong> the cross-section. The bending resistance results<br />
from the plastic M-N interaction curve <strong>of</strong> the cross-section and an additional correction factor α M<br />
which takes into account the difference between the plastic and the non-linear bending<br />
resistance with strain limitations.
N pl,Rd<br />
N<br />
Non-linear resistance<br />
with strain limitation<br />
F Ed<br />
=N Ed<br />
μ M pl,Rd<br />
plastic<br />
interaction curve<br />
N Ed<br />
μα M<br />
M pl,Rd<br />
L<br />
w o<br />
M<br />
plastic distribution <strong>of</strong> stresses<br />
M pl,Rd<br />
f yd,R<br />
f yd,K f cd<br />
M pl,Rd,N<br />
-<br />
-<br />
-<br />
+<br />
N Ed<br />
stresses in case <strong>of</strong> strain limitation in <strong>concrete</strong><br />
(EJ) eff<br />
Effective flexural stiffness<br />
( EJ) eff = Ko<br />
(EaJa<br />
+ Ke,II<br />
Ecm<br />
Jc<br />
)<br />
Verification<br />
ε<br />
f yd,R<br />
f yd,K σ c<br />
-<br />
-<br />
-<br />
α M<br />
M pl,Rd,N<br />
N Ed<br />
αM<br />
MEd<br />
μ Mpl,Rd<br />
≤ 1,0<br />
Fig. 12 - Simplified <strong>design</strong> method according to Eurocode 4-1-1<br />
1,0<br />
0,8<br />
0,6<br />
0,4<br />
N<br />
N pl,Rd<br />
N pl,Rd tube 406,4x8,8 S235<br />
tube 406,4x8,8 S235 1,0<br />
core d k<br />
= 200 mm S235<br />
Concrete C30/37 0,8<br />
Concrete C30/37<br />
0,6<br />
0,4<br />
N<br />
0,2<br />
1,0<br />
0,8<br />
0,6<br />
0,2<br />
M<br />
M<br />
0,2 0,4 0,6 0,8 1,0 1,2 M pl,Rd 0,2 0,4 0,6 0,8 1,0 1,2 M pl,Rd<br />
N<br />
N<br />
N pl,Rd<br />
N pl,Rd tube 406,4x8,8 S460<br />
tube 406,4x8,8 S460 1,0<br />
core d k<br />
= 200 mm S460<br />
Concrete C100/115 0,8<br />
Concrete C100/115<br />
0,6<br />
0,4<br />
0,2<br />
with strain<br />
limitation<br />
plastic<br />
0,2 0,4 0,6 0,8 1,0 1,2<br />
M<br />
M pl,Rd<br />
0,4<br />
0,2<br />
M<br />
M<br />
0,2 0,4 0,6 0,8 1,0 1,2 pl,Rd<br />
Fig.13 – Plastic and non-linear M-N-interaction curve for two typical cross sections<br />
For high strength materials and <strong>concrete</strong> filled steel tubes with additional inner massive steel<br />
cores the interaction curve depends strongly on the strength <strong>of</strong> the used materials. The<br />
proportion between the plastic interaction curve and the interaction curve with strain limitation<br />
for the <strong>concrete</strong> can differ significantly. Figure 13 shows this for typical cross-sections.<br />
Therefore the constant values for the correction factor α M in Eurocode 4 can not be used for<br />
<strong>columns</strong> with high strength <strong>concrete</strong>. The analysis <strong>of</strong> various cross-sections leads to the<br />
following approximation for the correction factor α M .
N<br />
α<br />
Ed<br />
M = αMo<br />
− αN<br />
(1)<br />
Npl,Rd<br />
where the values α Mo and α N are given in table 3, N Ed is the <strong>design</strong> value <strong>of</strong> the normal force<br />
and N pl,Rd the plastic resistance to compression. Interim values can be determined by linear<br />
interpolation.<br />
Table 3 – values α Mo and α N<br />
steel grade f yd,core <strong>concrete</strong> f cd d K /d= 0 d K /d= 0,75<br />
<strong>of</strong> the core section [N/mm²] grade [N/mm²] α Mo α N α M0 α N<br />
C30/37 20 0,90 0,10 0,85 0,15<br />
S235 218 C 60/75 40 0,90 0,25 0,80 0,15<br />
C100/115 60 0,90 0,40 0,75 0,15<br />
C30/37 20 0,85 0,25 0,70 0,20<br />
S460 418 C 60/75 40 0,85 0,35 0,60 0,20<br />
C100/115 60 0,85 0,45 0,50 0,20<br />
Based on the correction factor α M the equivalent bow imperfection can be determined by<br />
comparison <strong>of</strong> the ultimate loads <strong>of</strong> the simplified method with the ultimate loads determined by<br />
an exact non-linear calculation taking into account a geometrical imperfection <strong>of</strong> L/1000 and<br />
structural imperfections according to chapter 4. The equivalent imperfections depend on the<br />
cross section geometry and on the slenderness as well as on the effective flexural stiffness /4,<br />
5/. The analysis <strong>of</strong> several <strong>columns</strong> covering different material strengths, buckling lengths,<br />
eccentricities and cross-sections gave the following equation (2) for the maximum value <strong>of</strong><br />
equivalent bow imperfection w o where the factors k i are given in Table 4. The factor k 1 takes into<br />
account the influence <strong>of</strong> the steel grade, the factor k 2 the influence <strong>of</strong> the diameter d k <strong>of</strong> the<br />
inner core cross-section and the factor k 3 the influence <strong>of</strong> the related slenderness.<br />
L<br />
= 400 ⋅ k1<br />
⋅ k 2 ⋅ k3<br />
(2)<br />
w 0<br />
For two typical <strong>columns</strong> Figure 9 shows a comparison <strong>of</strong> ultimate loads determined with the<br />
general <strong>design</strong> method according to Eurocode 4-1-1 and the ultimate loads determined with the<br />
simplified <strong>design</strong> method according to Eurocode 4-1-1 but using the correction factor α M<br />
according to equation (1) and the equivalent bow imperfection acc. to equation (2). The<br />
comparison demonstrates that the proposed <strong>design</strong> method gives an excellent agreement with<br />
the exact general <strong>design</strong> method.<br />
Table 4 – Geometrical bow imperfection for <strong>concrete</strong> filled tubes with additional<br />
inner core pr<strong>of</strong>iles<br />
cr<br />
steel grade<br />
d k<br />
d diameter d k <strong>of</strong> core<br />
Npl,k<br />
λ K =<br />
related slenderness<br />
N<br />
S355 k 1 = 1<br />
S460 k 1 = 1,25<br />
≤ 200 mm<br />
d [mm]<br />
k 2 = 1+<br />
K<br />
400<br />
> 200 mm<br />
d [mm]<br />
k 2 = 2 − K<br />
400<br />
λ 0,5 k 3 = 0,8<br />
K ≤<br />
λ K > 0,5 k 3 = 0,7<br />
+ 0,2 λK
N Rd<br />
[MN]<br />
N Rd<br />
[MN]<br />
simplified <strong>design</strong> method<br />
80,0<br />
60,0<br />
40,0<br />
20,0<br />
tube 660x7,1<br />
d k<br />
= 200 and 400 mm<br />
S355 und S460<br />
C60/75<br />
40,0<br />
30,0<br />
20,0<br />
10,0<br />
tube 406,4x8,8<br />
d k<br />
= 90,110 and 300 mm<br />
S355 und S460<br />
C60/75<br />
N Rd,A<br />
[MN]<br />
20,0 40,0 60,0 80,0<br />
10,0 20,0 30,0<br />
N Rd,A<br />
[MN]<br />
.<br />
general <strong>design</strong> method<br />
Fig. 9 – Comparison <strong>of</strong> the ultimate loads determined with the general <strong>design</strong> method and the<br />
simplified <strong>design</strong> method acc. to Eurocode 4-1-1<br />
40,0<br />
7 REFERENCES<br />
[1] EN 1994-1-1: Eurocode 4: Design <strong>of</strong> <strong>composite</strong> steel and <strong>concrete</strong> structures<br />
Part 1-1: General rules and rules for buildings (2004)<br />
[2] EN 1990: Eurocode - Basis <strong>of</strong> structural <strong>design</strong> (2002)<br />
[3] Porsch, M: Modellierung von Schädigungsmechanismen zur Beurteilung der<br />
Lebensdauer von Verbundkonstruktionen aus Stahl und Beton, Dissertation,<br />
Fachbereich Bauingenieurwesen, Institut für Konstruktiven Ingenieurbau, Lehrstuhl für<br />
Stahlbau und Verbundkonstruktionen, Bergische Universität Wuppertal (2008)<br />
[4] Hanswille G.: Die Bemessung von Stahlverbundstützen nach nationalen und EU-Regeln,<br />
Der Prüfingenieur 22, (2003)<br />
[5] Bergmann, R.: Hanswille, G.: New <strong>design</strong> method for <strong>composite</strong> <strong>columns</strong> including High<br />
strength steel , ASCE, Proceedings <strong>of</strong> the 5th international conference Composite<br />
Construction in Steel and Concrete V, South Africa, 2004<br />
[6] Roik, K., Schaumann, P.: Tragverhalten von Vollpr<strong>of</strong>ilstützen – Fließgrenzenverteilung<br />
an Vollpr<strong>of</strong>ilquerschnitten, Institut für Konstruktiven Ingenieurbau, Ruhr-Universität<br />
Bochum, Juli 1980<br />
[7] EN 1993-1-2:2005: Eurocode 3: Design <strong>of</strong> steel structures, Part 1-2: General rules,<br />
Structural fire <strong>design</strong> (2005)<br />
[8] EN 1992 -1-1: Eurocode 2: Design <strong>of</strong> <strong>concrete</strong> structures, Part 1-1: General rules and<br />
rules for Buildings (2004)<br />
[9] Ichinose, L.H., Watanabe, E, Nakai, H.: An experimental study on creep <strong>of</strong> <strong>concrete</strong><br />
filled steel pipes, Journal <strong>of</strong> Constructional Steel Research 57 (2001), S. 453 – 466