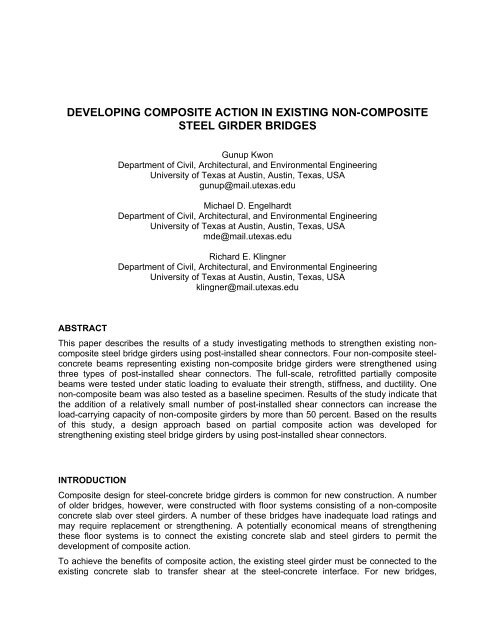
developing composite action in existing non-composite steel girder ...
developing composite action in existing non-composite steel girder ...
developing composite action in existing non-composite steel girder ...

You also want an ePaper? Increase the reach of your titles
YUMPU automatically turns print PDFs into web optimized ePapers that Google loves.
connectors. All specimens were an 11.6-m long simply supported beam, with a concentratedload applied at midspan. For all specimens, the <strong>steel</strong> beam was a W30x99 section of ASTMA922 <strong>steel</strong>. The re<strong>in</strong>forced concrete slab was 2130-mm wide and 178-mm thick, with a specifiedconcrete compressive strength of 20.7 MPa. Details are shown <strong>in</strong> Fig. 3.Figure 4 shows the computed load-carry<strong>in</strong>g capacity of the test specimens with respect to theshear connection ratio from simple plastic analysis. These beam strength values werecalculated us<strong>in</strong>g the m<strong>in</strong>imum specified concrete strength ( f 'c= 20.7 MPa) and the m<strong>in</strong>imumspecified yield stress of the <strong>steel</strong> ( Fy= 345 MPa). The contribution of the longitud<strong>in</strong>alre<strong>in</strong>forc<strong>in</strong>g bars was neglected <strong>in</strong> the strength calculation. The m<strong>in</strong>imum specified tensilestrength of ASTM 193 B7 threaded rod for the DBLNB and HASSAA connectors and ASTMA325 high-strength bolt for the HTFGB connectors is 862 MPa and 827 MPa, respectively.Based on these calculations, the <strong>non</strong>-<strong>composite</strong> beam has a capacity of 609 kN. As shown <strong>in</strong>Fig. 4, add<strong>in</strong>g shear connectors significantly <strong>in</strong>creases the computed load capacity of this beam,even with low values of shear connection ratio. Based on this analysis, it was decided to designthe four partially <strong>composite</strong> beam specimens with a 30-percent shear connection ratio, result<strong>in</strong>g<strong>in</strong> a predicted <strong>in</strong>crease of 48 percent <strong>in</strong> load-carry<strong>in</strong>g capacity compared to the <strong>non</strong>-<strong>composite</strong>beam. To achieve a 30-percent shear connection ratio requires 16 shear connectors for eachshear span (a total of 32 shear connectors for a beam). The shear connectors were 22 mm (7/8<strong>in</strong>.) <strong>in</strong> diameter, and their static strength was predicted us<strong>in</strong>g Eq. 3.The specimen designations used below beg<strong>in</strong> with the connection method, followed by theshear connection ratio <strong>in</strong> percentage. “BS” stands for Beam Static test.1782134305 #5 & #4 @152#4@305Load (kips)12001000800901 kN1048 kNW30x99Unit: mm600609 kN 30%0 0.2 0.4 0.6 0.8 1Shear connection ratio (N/N f )Figure 3 – Details of specimen cross sectionFigure 4 – Predicted load capacity of testspecimens versus shear connectionMaterial propertiesMechanical properties of structural components used <strong>in</strong> the test specimens are shown <strong>in</strong> Table1. Concrete for the specimens was delivered by ready-mix truck. The specified compressivestrength was 20.7 MPa with 19-mm river aggregate. Five Star ® Highway Patch, a fast-sett<strong>in</strong>ghigh-strength grout, was used to fill the hole <strong>in</strong> the concrete slab after <strong>in</strong>stallation of the DBLNBand HTFGB connectors. Hilti HY 150 adhesive was used for the HASAA connectors.The <strong>steel</strong> beams used for the full-scale beam tests were of ASTM A992, which has a m<strong>in</strong>imumspecified yield stress of 345 MPa. Steel coupons were taken from both the beam web and theflange. The Grade 60, #4 longitud<strong>in</strong>al re<strong>in</strong>forc<strong>in</strong>g bars used <strong>in</strong> the specimens were also tested <strong>in</strong>tension to evaluate mechanical properties. The ultimate tensile strength of the ASTM A193 B7
threaded rod for the DBLNB and the HASAA connectors and of the ASTM A325 high-strengthbolt for the HTFGB connector was determ<strong>in</strong>ed from tension tests.Table 1: Measured material properties ( MPa)SpecimenFlangeBeam*WebConcrete**Connector**Grout**Re<strong>in</strong>forc<strong>in</strong>gbar*NON-00BS 392.6 (533.4) 419.8 (542.2) 43.12 - - 424.9 (713.8)DBLNB-30BS 392.6 (533.4) 419.8 (542.2) 25.38 1014 52.21 424.9 (713.8)HTFGB-30BS 379.1 (520.6) 408.8 (536.7) 28.02 1024 62.91 435.0 (707.1)HASAA-30BS 392.6 (533.4) 419.8 (542.2) 24.90 1014 - 397.2 (683.6)HASAA-30BS1 379.1 (520.6) 408.8 (536.7) 22.21 1014 - 435.0 (707.1)* Yield strength, () ultimate strength, ** ultimate strengthInstallation of shear connectorsThe shear connectors <strong>in</strong> the laboratory specimens were <strong>in</strong>stalled us<strong>in</strong>g the proceduresdescribed below, which were developed to be realistic for field <strong>in</strong>stallation. The DBLNB andHTFGB connectors require access from both the top and the bottom of the slab. The HASAAconnection method, however, requires access only from the bottom of the slab.(a) Cor<strong>in</strong>g concrete slab (b) drill<strong>in</strong>g beam flange (c) Drill<strong>in</strong>g and cor<strong>in</strong>g from the bottomFigure 5 – Installation of shear connectorsDouble-Nut-Bolt (DBLNB): Installation of the DBLNB connectors requires access from both thetop and the bottom of the slab. First, a 60-mm diameter hole was drilled through the top of theconcrete slab us<strong>in</strong>g a concrete cor<strong>in</strong>g mach<strong>in</strong>e as shown <strong>in</strong> Fig 5(a). Second, a 24-mm diameterhole was drilled through the <strong>steel</strong> beam flange from the top side of the slab us<strong>in</strong>g a portablemagnetic drill. A hollow round bar was placed <strong>in</strong>side of the cored hole <strong>in</strong> the concrete to guidethe <strong>steel</strong> drill bit and to keep the <strong>in</strong>side surface of the concrete clean of cutt<strong>in</strong>g oil. Next, a 190-mm long ASTM A193 B7 threaded rod was placed from the top to provide a 130-mmembedment length, and the connector was tightened to a pretension of 170 kN us<strong>in</strong>g an impactwrench. F<strong>in</strong>ally, the hole was filled with grout.High-Tension Friction-Grip Bolt (HTFGB): Installation of the HTFGB connectors requires moresteps than the DBLNB connectors. First, a 70-mm deep and 50-mm diameter hole was drilled<strong>in</strong>to the concrete from the top us<strong>in</strong>g a rotary hammer drill. Next, a 25-mm diameter hole,concentric with the 50-mm diameter hole was drilled through the concrete slab from the top
The Hognestad (1951) stress-stra<strong>in</strong> relationship was used to model the concrete stress-stra<strong>in</strong>curve for compression. A smeared crack<strong>in</strong>g model was used to model concrete behavior <strong>in</strong>tension (ABAQUS 2007). In this model, crack<strong>in</strong>g is assumed to occur when the stress reachesa failure surface. The concrete model does not track <strong>in</strong>dividual macro cracks. Instead, thepresence of cracks affects the stress and material stiffness of the correspond<strong>in</strong>g <strong>in</strong>tegrationpo<strong>in</strong>ts (ABAQUS 2007). To model stress-stra<strong>in</strong> response of the <strong>steel</strong> beams and re<strong>in</strong>forc<strong>in</strong>gbars, an elastic-perfectly plastic stress-stra<strong>in</strong> relationship was used. Stra<strong>in</strong> harden<strong>in</strong>g was not<strong>in</strong>cluded <strong>in</strong> the material model. The load-slip relationship proposed by Ollgaard et al. (1971) wasadopted for shear connector behavior. The equation by Ollgaard et al. (1971) was developed forconventional welded shear studs, not for post-<strong>in</strong>stalled shear studs. However, it was decided touse this equation due to limited static test data for <strong>in</strong>dividual post-<strong>in</strong>stalled shear connectors.Load (kN)120010008006004002000max: 1029 kNmax: 1142 kNmax: 1065 kNmax: 726 kNNON-00BSDBLNB-30BSHTFGB-30BSHASAA-30BS0 50 100 150 200 250 300Deflection (mm)Figure 7 – Load-deflection relations Figure 8 – Deflected specimen after typical testTEST RESULTSStructural behavior of test specimensDur<strong>in</strong>g each test, <strong>in</strong> addition to electronically record<strong>in</strong>g data, the specimens were visuallyexam<strong>in</strong>ed for cracks <strong>in</strong> the concrete slab, yield<strong>in</strong>g and buckl<strong>in</strong>g <strong>in</strong> the <strong>steel</strong> beam and failure ofthe post-<strong>in</strong>stalled shear connectors. Figure 7 shows the measured load versus midspandeflection response for <strong>non</strong>-<strong>composite</strong> Specimen NON-00BS, as well as for the partially<strong>composite</strong> Specimens DBLNB-30BS, HTFGB-30BS, and HASAA-30BS. These partially<strong>composite</strong> beam specimens were provided with post-<strong>in</strong>stalled shear connectors that wereuniformly distributed along the span at a spac<strong>in</strong>g of 725 mm. All partially <strong>composite</strong> beamspecimens showed significantly higher stiffness and strength than the otherwise identical <strong>non</strong><strong>composite</strong>beam even with a low shear connection ratio of 30 percent.For Specimens DBLNB-30BS and HASAA-30BS, a sudden strength drop was observed ataround 120-mm deflection due to the nearly simultaneous failure of multiple shear connectors.Specimen HTFGB-30BS showed better deformation capacity than the other two partially<strong>composite</strong> beams. It is believed that the oversized hole <strong>in</strong> the concrete associated with theHTFGB connectors gave them a large slip capacity, result<strong>in</strong>g <strong>in</strong> a large deformation capacity forSpecimen HTFGB-30BS. It is, however, noteworthy that 120-mm deflection before shearconnector failure for Specimens DBLNB-30BS and HASAA-30BS is significant and thespecimens resisted significant load even after shear connector failure. Figure 8 shows thedeflected test specimen at the end of the test for Specimen NON-00BS.
End Slip (mm)50403020100NON-00BSDBLNB-30BSHTFGB-30BSHASAA-30BS0 50 100 150 200 250 300Deflection (mm)Neutral axis height (mm)7006005004003002001000NON-00BSDBLNB-30BSPlastic neutral axis forpartially <strong>composite</strong> beamNeutral axis for<strong>non</strong>-<strong>composite</strong> beam0 50 100 150 200 250 300Deflection (mm)Figure 9 – Load-End slip relationships Figure 10 – Neutral axis locations of test specimensEnd slip and neutral axis locationsAll of the test specimens showed an <strong>in</strong>crease <strong>in</strong> slip at the <strong>in</strong>terface between the concrete slaband the <strong>steel</strong> beam as the deflection <strong>in</strong>creased. Figure 9 shows the <strong>in</strong>terface slip at the ends ofpartially <strong>composite</strong> beams with uniformly distributed shear connectors along with the <strong>non</strong><strong>composite</strong>beam specimen. The partially <strong>composite</strong> beams showed much less slip before anyshear connector failure. Behaviors of Specimens DBLNB-30BS and HASAA-30BS were similarto that of Specimen NON-00BS after the multiple shear connector failures.Specimens DBLNB-30BS and HASAA-30BS showed beam end slip values, at the po<strong>in</strong>t ofconnector failure and sudden strength loss, of 5.8 mm and 6.9 mm, respectively. For SpecimenHTFGB-30BS, the first shear connector failure occurred at an end slip of 11.4 mm, much largerthan for the other two partially <strong>composite</strong> beam test specimens.Composite <strong>action</strong> <strong>in</strong> the retrofitted partially <strong>composite</strong> beams can be further evaluated bylocat<strong>in</strong>g the neutral axis dur<strong>in</strong>g the tests. Figure 10 shows the measured neutral axis location atmid-span of the <strong>girder</strong> throughout the tests. Neutral axis locations were obta<strong>in</strong>ed by<strong>in</strong>terpolat<strong>in</strong>g stra<strong>in</strong> data read from the stra<strong>in</strong> gages on the beam section. For Specimen NON-00BS, the neutral axis was located near mid-height of the <strong>steel</strong> section at most load levels, asexpected. At very low load levels at the start of the test, the neutral axis was located higher up<strong>in</strong> the cross-section, suggest<strong>in</strong>g some degree of <strong>in</strong>itial <strong>composite</strong> <strong>action</strong>, probably due to bondand/or friction between the <strong>steel</strong> and concrete. As <strong>in</strong>dicated <strong>in</strong> Fig. 10, however, this <strong>composite</strong><strong>action</strong> occurred only at very low load levels. Once the load exceeded about 10% of the <strong>girder</strong>’sfull capacity, the <strong>girder</strong> subsequently behaved <strong>in</strong> an almost purely <strong>non</strong>-<strong>composite</strong> manner. ForSpecimen DBLNB-30BS, the neutral axis stayed above mid-height of the <strong>steel</strong> section at all loadlevels. All of the partially <strong>composite</strong> beam specimens showed almost full <strong>composite</strong> <strong>action</strong> <strong>in</strong> theearly stages of load<strong>in</strong>g, likely due to friction at the <strong>steel</strong>-concrete <strong>in</strong>terface. However, theneutral axis moved down as the load <strong>in</strong>creased, <strong>in</strong>dicat<strong>in</strong>g partial <strong>composite</strong> <strong>in</strong>ter<strong>action</strong> betweenthe <strong>steel</strong> beam and the concrete slab.DEVELOPING INCREASED DEFORMATION CAPACITYAnalytical approachThe <strong>non</strong>-<strong>composite</strong> Specimen NON-00BS exhibited very high deformation capacity, as<strong>in</strong>dicated <strong>in</strong> Fig. 7. Specimens DBLNB-30BS and HASAA-30BS showed less deformationcapacity due to the limited slip capacity of the high-strength connectors and also due to the lowshear connection ratio. Specimen HTFGB-30BS showed significantly higher deformation
capacity <strong>in</strong> its overall load-deformation response due to the higher slip capacity of thisconnector. It is believed that high slip capacity of the HTFGB connectors enabled the shearconnectors at the <strong>steel</strong>-concrete <strong>in</strong>terface to redistribute <strong>in</strong>terface shear among the connectors.However, the HTFGB connectors are more difficult and time-consum<strong>in</strong>g to <strong>in</strong>stall than theHASAA and DBLNB connectors. Because of the easier <strong>in</strong>stallation characteristics of the HASAAand DBLNB connectors, an approach was developed to <strong>in</strong>crease the deformation capacity ofbeams retrofitted with these connectors.Oehlers and Sved (1995) <strong>in</strong>dicate that concentrat<strong>in</strong>g shear connectors near zero momentregions, result<strong>in</strong>g <strong>in</strong> the <strong>in</strong>crease of Ash<strong>in</strong> Eq. 2, can reduce slip at the <strong>steel</strong>-concrete <strong>in</strong>terfacewhen the beam reaches its full capacity. This suggests that simply supported beams with shearconnectors concentrated near the supports can likely show higher deformation capacity thanbeams with uniformly distributed shear connectors along the span.F<strong>in</strong>ite element analysis was used to evaluate the effect of mov<strong>in</strong>g shear connectors near thezero moment regions. First, the full-scale beam test specimens were modeled with ABAQUS.Figure 11 shows load-deflection relations for Specimen HASAA-30BS from the test along withthe f<strong>in</strong>ite element analysis results. As shown <strong>in</strong> the analysis result of Specimen HASAA-30BS,the model used <strong>in</strong> this research could not simulate the behavior after shear connector failure.However, the model is considered useful for predict<strong>in</strong>g the behavior before shear connectorfailure and the failure of the shear connectors. Figure 12 shows the longitud<strong>in</strong>al stressdistribution of Specimens HASAA-30BS from the FE analysis. As shown <strong>in</strong> the figure, neutralaxis of the beam moved toward the beam top flange due to <strong>composite</strong> <strong>action</strong> between the twostructural components.Figure 11 also shows the analysis results of a partially <strong>composite</strong> beam with shear connectorsconcentrated near the supports. In the FE model, shear connectors were moved near thesupports and were located at a 300-mm spac<strong>in</strong>g. The total number of shear connectors was notchanged <strong>in</strong> the model. The analysis model with concentrated shear connectors was same withthe analysis model of Specimen HASAA-30BS except the shear connector locations. ForSpecimen HASAA-30BS, the connectors were uniformly distributed along the length of thebeam, at a spac<strong>in</strong>g of 725 mm. Compared to Specimen HASAA-30BS, the deformation capacityof the partially <strong>composite</strong> beam with shear connectors relocated near the supports was<strong>in</strong>creased significantly. The <strong>in</strong>crease of its deformation capacity can be attributed to thedecrease <strong>in</strong> slip at the <strong>steel</strong>-concrete <strong>in</strong>terface as shown <strong>in</strong> Fig. 13. The partially <strong>composite</strong>specimen with concentrated shear connectors near the support shows much less slip than thespecimen with uniformly distributed shear connectors <strong>in</strong> ABAQUS.Load (kN)120010008006004002000HASAA-30BS (Test)HASAA-30BS (ABAQUS)Specimen with 300mmconnector spac<strong>in</strong>g (ABAQUS)0 50 100 150 200 250 300Deflection (mm)Figure 11 – Test vs. FE Analysis resultsFigure 12 – Longitud<strong>in</strong>al stressdistribution of a <strong>composite</strong> beam
End Slip (mm)302520151050HASAA-30BS (ABAQUS)HASAA-30BS1 (ABAQUS)HASAA-30BS (Test)0 50 100 150 200Deflection (mm)Load (kN)120010008006004002000max: 1042 kNmax: 1065 kNmax: 726 kNNON-00BSHASAA-30BS1HASAA-30BS0 50 100 150 200 250 300Deflection (mm)Figure 13 – Load-End slip relationships Figure 14 – Load-deflection curves for test specimensTest Results for Partially Composite Beam with Concentrated Shear ConnectorsSpecimen HASAA-30BS1 was tested to verify the FE analysis results and evaluate the globalbehavior of partially <strong>composite</strong> beams with post-<strong>in</strong>stalled shear connectors concentrated nearzero moment regions. Specimen HASAA-30BS1 had the same number of shear connectors asSpecimen HASAA-30BS. For Specimen HASAA-30SB1, the shear connectors were movedtowards the ends of the beam, and were spaced at 300 mm.Figure 14 compares test results for Specimens HASAA-30BS1 and HASAA-30BS. Thedeformation capacity of Specimen HASAA-30BS1 (concentrated connectors) is much greaterthan that of Specimen HASAA-30BS (uniform connectors), and is comparable to that ofSpecimen NON-00BS. Specimen HASAA-30BS1 showed first shear connector failure at a 170-mm deflection, after which the applied load <strong>in</strong>creased slightly before another shear connectorfailure at 210 mm. The maximum load was 1043 kN at 197-mm deflection. It appears thatconcentrat<strong>in</strong>g shear connectors near the supports not only decreases slip at the <strong>steel</strong>-concrete<strong>in</strong>terface, but also helps redistribute loads among shear connectors.Test results from Specimen HASAA-30BS1 <strong>in</strong>dicate that the stiffness and strength of <strong>non</strong><strong>composite</strong>beams can be improved significantly by us<strong>in</strong>g relatively small number of post<strong>in</strong>stalledshear connectors without sacrific<strong>in</strong>g deformation capacity.SUMMARYThe study reported here<strong>in</strong> was the f<strong>in</strong>al phase of a research project to develop methods forstrengthen<strong>in</strong>g exist<strong>in</strong>g <strong>non</strong>-<strong>composite</strong> bridge <strong>girder</strong>s us<strong>in</strong>g post-<strong>in</strong>stalled shear connectors.Previous phases of this study identified possible post-<strong>in</strong>stalled shear connectors and evaluatestatic and fatigue performance of those shear connectors. Based on this earlier works, threetypes of post-<strong>in</strong>stalled shear connectors were selected for full-scale beam tests.The number of post-<strong>in</strong>stalled shear connectors needed to strengthen an exist<strong>in</strong>g bridge <strong>girder</strong> isdeterm<strong>in</strong>ed based on the concept of partial <strong>composite</strong> design. Partial <strong>composite</strong> design is notnormally used for new <strong>composite</strong> bridge <strong>girder</strong>s, because fatigue typically controls the requirednumber of shear connectors. Because of the superior fatigue characteristics of the post-<strong>in</strong>stalledshear connectors tested <strong>in</strong> this study, however, fatigue is not likely to control the requirednumber of shear connectors, and partial <strong>composite</strong> design is therefore possible.With partial <strong>composite</strong> design, 50 to 70 percent of the shear connectors normally needed for full<strong>composite</strong> design can be elim<strong>in</strong>ated, while still achiev<strong>in</strong>g a 40- to 50-percent <strong>in</strong>crease <strong>in</strong> loadcarry<strong>in</strong>gcapacity <strong>in</strong> positive-moment regions of a <strong>girder</strong>. Based on the test data from s<strong>in</strong>gleshear connector tests, overall performance of <strong>girder</strong>s retrofitted with post-<strong>in</strong>stalled shear
connectors was evaluated with a series of large-scale beam tests, supplemented with f<strong>in</strong>iteelement analysis. The results of this study suggest that strengthen<strong>in</strong>g exist<strong>in</strong>g <strong>non</strong>-<strong>composite</strong>bridge <strong>girder</strong>s us<strong>in</strong>g post-<strong>in</strong>stalled shear connectors may be an effective and economicalalternative to replacement of exist<strong>in</strong>g bridges.ACKNOWLEDGEMENTSThe authors gratefully acknowledge the f<strong>in</strong>ancial support provided for this study by the TexasDepartment of Transportation. The authors extend a special thanks to Jon Kilgore and ClaraCarbajal of the Texas Department of Transportation for their support, assistance and advicethroughout the entire course of this project. The authors also gratefully acknowledge thecontributions of Brad Schaap, Brent Hungerford, and Hulya Kayir <strong>in</strong> the earlier phases of thisresearch study. The experiments described here<strong>in</strong> were conducted at the Phil M. FergusonStructural Eng<strong>in</strong>eer<strong>in</strong>g Laboratory at the University of Texas at Aust<strong>in</strong>.REFERENCESAASHTO (2007). “LRFD Bridge Design Specifications Interim Customary U.S. Units, 4thEdition.” American Association of State Highway and Transportation Officials, Wash<strong>in</strong>gton, DC.ABAQUS (2007). “ABAQUS Analysis User’s Manual (Ver. 6.7).” ABAQUS, Inc, Pawtucket, RI.ACI (2005). “Build<strong>in</strong>g Code Requirements for Structural Concrete (ACI 318-05) andCommentary (ACI 318R-05).” American Concrete Institute, Farm<strong>in</strong>gton Hills, Michigan, 2005.Hognestad, E (1951). “A Study of Comb<strong>in</strong>ed Bend<strong>in</strong>g and Axial Load <strong>in</strong> Re<strong>in</strong>forced ConcreteMembers.” University of Ill<strong>in</strong>ois Eng<strong>in</strong>eer<strong>in</strong>g Experimental Station, Bullet<strong>in</strong> Series No. 399.Hungerford, B.E. (2004). “Methods to Develop Composite Action <strong>in</strong> Non-Composite Bridge FloorSystems: Part II.” MS Thesis, Department of Civil, Architectural and Environmental Eng<strong>in</strong>eer<strong>in</strong>g,The University of Texas at Aust<strong>in</strong>.Kayir, H. (2006). “Methods to Develop Composite Action <strong>in</strong> Non-Composite Bridge FloorSystems: Fatigue Behavior of Post-Installed Shear Connectors.” MS Thesis, Department ofCivil, Architectural and Environmental Eng<strong>in</strong>eer<strong>in</strong>g, The University of Texas at Aust<strong>in</strong>.Kwon, G. (2008). “Strengthen<strong>in</strong>g Exist<strong>in</strong>g Steel Girder Bridges by the use of Post-InstalledShear Connectors.” PhD Dissertation, Department of Civil, Architectural and EnvironmentalEng<strong>in</strong>eer<strong>in</strong>g, The University of Texas at Aust<strong>in</strong> (expected completion <strong>in</strong> August 2008).Lehman, H.G., Lew, H.S., and Toprac, A.A. (1965). “Fatigue Strength of 3/4 <strong>in</strong>. Studs <strong>in</strong>Lightweight Concrete.” Center for Highway Research, The University of Texas at Aust<strong>in</strong>.Oehlers, D.J., and Sved, G. (1995) “Composite Beams with Limited-Slip-Capacity ShearConnectors.” Journal of Structural Eng<strong>in</strong>eer<strong>in</strong>g, 121(6), 932-938.Ollgaard, J.G., Slutter, R.G., and Fisher, J.W. (1971). “Shear Strength of Stud ShearConnectors <strong>in</strong> Lightweight and Normal-Weight Concrete.” AISC Eng<strong>in</strong>eer<strong>in</strong>g Journal, 8, 55-64.Schaap, B. A. (2004). “Methods to Develop Composite Action <strong>in</strong> Non-Composite Bridge FloorSystems: Part I.” MS Thesis, Department of Civil, Architectural and Environmental Eng<strong>in</strong>eer<strong>in</strong>g,The University of Texas at Aust<strong>in</strong>.Slutter, R.G., and Fisher, J.W. (1966). “Fatigue Strength of Shear Connectors.” HighwayResearch Record 147, 65-88.Viest, I.M. et al. (1997). “Composite Construction: Design for Build<strong>in</strong>gs.” McGraw--Hill, NewYork, NY.