Behavior of Columns in Composite CES Structural System
Behavior of Columns in Composite CES Structural System
Behavior of Columns in Composite CES Structural System

You also want an ePaper? Increase the reach of your titles
YUMPU automatically turns print PDFs into web optimized ePapers that Google loves.
<strong>Behavior</strong> <strong>of</strong> <strong>Columns</strong> <strong>in</strong> <strong>Composite</strong> <strong>CES</strong> <strong>Structural</strong> <strong>System</strong><br />
Hiroshi Kuramoto<br />
Department <strong>of</strong> Architectural Eng<strong>in</strong>eer<strong>in</strong>g, Graduate School <strong>of</strong> Eng<strong>in</strong>eer<strong>in</strong>g<br />
Osaka University<br />
Suita, Japan<br />
kuramoto@arch.eng.osaka-u.ac.jp<br />
ABSTRACT<br />
New composite structural systems consist<strong>in</strong>g <strong>of</strong> only steel and concrete, the concrete encased<br />
steel (<strong>CES</strong>) structures, have been proposed by the author <strong>in</strong> order to realize simplification and<br />
cost reduction <strong>in</strong> construction works for SRC structures. Experimental studies on <strong>CES</strong> columns<br />
us<strong>in</strong>g fiber re<strong>in</strong>forced concrete (FRC) have been carried out to <strong>in</strong>vestigate the seismic<br />
performance, <strong>in</strong> which the ma<strong>in</strong> test parameters were the section shape <strong>of</strong> encased steels, the<br />
type and content <strong>of</strong> fibers used for FRC and the applied axial load levels. The experimental<br />
results showed that <strong>CES</strong> columns had excellent seismic performance with a stable sp<strong>in</strong>dleshape<br />
hysteresis characteristic and less damage. This paper <strong>in</strong>troduces the summary <strong>of</strong> the<br />
experimental studies carried out <strong>in</strong> past about eight years with the advantage <strong>of</strong> <strong>CES</strong> structure.<br />
INTRODUCTION<br />
Re<strong>in</strong>forced concrete encased steel structures referred to as SRC structures are typical<br />
composite structural systems consist<strong>in</strong>g <strong>of</strong> steel and re<strong>in</strong>forced concrete (RC) and possess an<br />
excellent earthquake resistance with high capacities and deformability. However, SRC<br />
structures have a weak po<strong>in</strong>t <strong>in</strong> the construction due to complex works <strong>of</strong> both steel and RC. In<br />
order to realize simplification and cost reduction <strong>in</strong> construction works for SRC structures,<br />
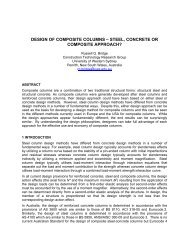
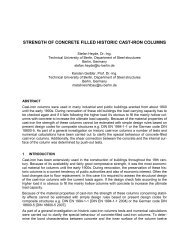
concrete encased steel structures consist<strong>in</strong>g <strong>of</strong> only steel and concrete (see Figure 1),<br />
hereafter referred to as <strong>CES</strong> structures, have been proposed by the author (Kuramoto et al.<br />
2000). In the feasibility study to exam<strong>in</strong>e the structural performance <strong>of</strong> <strong>CES</strong> columns, it was<br />
conformed that damages <strong>of</strong> the columns with an <strong>in</strong>crease <strong>of</strong> lateral deformation such as<br />
crack<strong>in</strong>g and crush<strong>in</strong>g <strong>in</strong> concrete can be reduced by us<strong>in</strong>g high performance fiber re<strong>in</strong>forced<br />
cementitious composites (HPFRCC) <strong>in</strong>stead <strong>of</strong> normal concrete. Moreover, the hysteretic<br />
characteristics <strong>of</strong> the <strong>CES</strong> columns were almost the same as those <strong>of</strong> SRC columns. However,<br />
significant reduction <strong>of</strong> the <strong>in</strong>itial stiffness <strong>in</strong> the shear versus story drift responses and the<br />
development <strong>of</strong> dry<strong>in</strong>g shr<strong>in</strong>kage <strong>in</strong> the cover concrete were observed <strong>in</strong> the <strong>CES</strong> columns due<br />
to use <strong>of</strong> HPERCC without aggregates. In addition, the production and cast<strong>in</strong>g <strong>of</strong> HPFRCC were<br />
very difficult due to less workability.<br />
In order to solve these problems <strong>in</strong> the columns us<strong>in</strong>g HPFRCC, use <strong>of</strong> fiber re<strong>in</strong>forced concrete<br />
(FRC) for <strong>CES</strong> members have been proposed, and the structural performance <strong>of</strong> the columns<br />
(Kuramoto et al. 2002, Adachi et al. 2003, Taguchi et al. 2006) and the beam-column jo<strong>in</strong>ts
(Matsui and Kuramoto 2007, Kuramoto et al. 2008) have been <strong>in</strong>vestigated.<br />
The experimental studies on <strong>CES</strong> columns us<strong>in</strong>g FRC are <strong>in</strong>troduced with the advantage <strong>of</strong><br />
<strong>CES</strong> structures <strong>in</strong> this paper.<br />
ADVANTAGE OF <strong>CES</strong> STRUCTURES<br />
<strong>CES</strong> structure us<strong>in</strong>g FRC is a simple composite structural system consist<strong>in</strong>g <strong>of</strong> only steel and<br />
FRC, as shown <strong>in</strong> Figure 1. This "simple structure" has excellent seismic performance and can<br />
make construction cost and time reduced. In addition, <strong>CES</strong> structure is widely used for several<br />
purposes, from low to high-rise or from small-scale to large-scale build<strong>in</strong>gs, and the pre-cast<br />
design and construction <strong>of</strong> <strong>CES</strong> structure will be easier than those <strong>of</strong> SRC structure.<br />
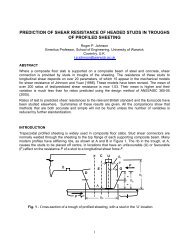
The structural advantage <strong>of</strong> <strong>CES</strong> structure can be illustrated us<strong>in</strong>g a simple example shown <strong>in</strong><br />
Figure 2. The figure shows the cross-section <strong>of</strong> a column <strong>in</strong> 1st story <strong>of</strong> 13-story SRC build<strong>in</strong>g<br />
and the cross-sections <strong>of</strong> RC and <strong>CES</strong> columns which have the same flexural strengths as the<br />
SRC column. SRC column has a cross section <strong>of</strong> 900 mm square (Fc36), 2-H-600×300×16×28<br />
(SN490), 12-D29 (SD390). If it is compared with RC column us<strong>in</strong>g the same concrete strength,<br />
24+8-D38 (SD490) re<strong>in</strong>forc<strong>in</strong>g bars are needed and the column section should be 900 mm<br />
square. For <strong>CES</strong> column, on the other hand, if built-<strong>in</strong> steel 2-H-700×450×16×28 (SN490) is<br />
used, the cross section will be 800 mm square (Fc36) which is smaller than that <strong>of</strong> SRC column.<br />
Thus, <strong>CES</strong> column can be designed with smaller section <strong>in</strong> comparison with the SRC column<br />
hav<strong>in</strong>g the ma<strong>in</strong> re<strong>in</strong>forcement <strong>in</strong> the four corners. If the re<strong>in</strong>forc<strong>in</strong>g bars <strong>in</strong> SRC column are<br />
elim<strong>in</strong>ated, the concrete cover will be smaller while the size <strong>of</strong> the steel will be larger <strong>in</strong> order to<br />
keep the same flexural strength <strong>of</strong> the column. Also, it is possible to use the wider steel flange<br />
for this purpose. Therefore, the effective utilization <strong>of</strong> steel is one ma<strong>in</strong> advantage <strong>of</strong> <strong>CES</strong><br />
structural system.<br />
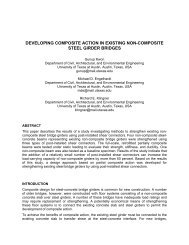
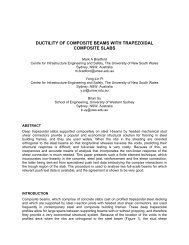
Another advantage <strong>of</strong> <strong>CES</strong> structure is that the structure can be applied for various construction<br />
types, as shown <strong>in</strong> Figure 3. Basically, <strong>CES</strong> structural system consists <strong>of</strong> <strong>CES</strong> columns and<br />
<strong>CES</strong> beams (see Figure 3(a)). In addition, the <strong>CES</strong> structural members can be designed easily<br />
with other types <strong>of</strong> structural members such as <strong>CES</strong> columns with steel-concrete composite<br />
(SC) beams or steel beams, as shown <strong>in</strong> Figure 3(b). Also, it is possible to use RC and SRC<br />
beams if it is considered the method to fix the ma<strong>in</strong> re<strong>in</strong>forcement <strong>of</strong> beams with <strong>CES</strong> columns.<br />
Furthermore, it is also possible to use <strong>CES</strong> beams <strong>in</strong> steel structures, SRC structures and CFT<br />
structures (see Figure 3(c)).<br />
In real structure, <strong>CES</strong> structure can be applied not only for the whole build<strong>in</strong>g but also for a part<br />
<strong>of</strong> build<strong>in</strong>g (see Figure 3(d)). In addition, not only the pure <strong>CES</strong> frame can be constructed, but<br />
many types <strong>of</strong> earthquake-pro<strong>of</strong> elements can be also <strong>in</strong>stalled easily to <strong>CES</strong> structure such as<br />
steel brace, shear wall, damper, etc, as shown <strong>in</strong> Figure 3(e).<br />
SRC <strong>CES</strong> (a) SRC (b) RC (c) <strong>CES</strong><br />
Figure 1 – Image <strong>of</strong> Concrete Encased Steel Figure 2 – Comparison <strong>of</strong> column section
(a) <strong>CES</strong> Column+<strong>CES</strong> Beam (b) <strong>CES</strong> Column+SC or S Beam (c) SRC or CFT Column+<strong>CES</strong> Beam<br />
(d) Lower <strong>CES</strong> Structure+Upper S Structure (e) <strong>CES</strong> Structure+Braces, etc.<br />
Figure 3 – Examples <strong>of</strong> construction with <strong>CES</strong> structural members<br />
STRUCURAL CHARACTERISTICS OF <strong>CES</strong> COLUMNS<br />
Experimental Program<br />
(1) Specimens and material used<br />
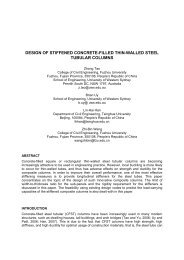
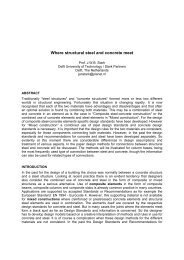
A total <strong>of</strong> n<strong>in</strong>e composite columns <strong>in</strong>clud<strong>in</strong>g seven <strong>CES</strong> columns us<strong>in</strong>g FRC, one <strong>CES</strong> column<br />
us<strong>in</strong>g normal concrete and one SRC column were tested to <strong>in</strong>vestigate the structural<br />
performance <strong>of</strong> the columns (Kuramoto et al. 2000, Kuramoto et al. 2002, Adachi et al. 2003,<br />
Taguchi et al. 2006). The dimension and detail <strong>of</strong> specimens are shown <strong>in</strong> Figure 4 and Table 1.<br />
The tests are divided <strong>in</strong>to three phases. The first phase test was for Specimens SRC, SC, VF1,<br />
VF2 and SF2 <strong>in</strong> which the behavior <strong>of</strong> <strong>CES</strong> columns us<strong>in</strong>g normal concrete and FRC with<br />
different fiber was compared with that <strong>of</strong> SRC column. The second phase test was conducted<br />
to <strong>in</strong>vestigate the effect <strong>of</strong> applied axial force us<strong>in</strong>g Specimens VF2N3, VF2N5 and VF2NV. The<br />
third phase was to <strong>in</strong>vestigate the behavior <strong>of</strong> <strong>CES</strong> column us<strong>in</strong>g s<strong>in</strong>gle H-section steel for<br />
Specimen <strong>CES</strong>U.<br />
In the first phase test, Specimens SC, VF1, VF2 and SF2 which are <strong>CES</strong> columns had the same<br />
dimension and steel details. The different was only the concrete used. For Specimen SC, a<br />
normal concrete was used while FRC with Poly-v<strong>in</strong>yl Alcohol fiber (PVA fiber: RF4000) <strong>of</strong> 1.0%<br />
and 2.0% <strong>in</strong> the volume content ratios were used for Specimens VF1 and VF2, respectively. For<br />
Specimens SF2, on the other hand, FRC with sta<strong>in</strong>less steel fiber (SS fiber: F430D) <strong>of</strong> 2.0%<br />
was used. All specimens had columns with a 400mm square section and 1,600mm height, and
the height-depth ratio was 4.0. Steels encased <strong>in</strong> each column had a cross shape section<br />
comb<strong>in</strong><strong>in</strong>g two H-section steels (i.e., double-H section steel) <strong>of</strong> 300x150x6.5x9 mm. In<br />
Specimen SRC, the cross section was similar with the other 4 above specimens, however, the<br />
smaller size <strong>of</strong> H-section steel, 250×125×6×9 mm, was used due to the present <strong>of</strong> re<strong>in</strong>forc<strong>in</strong>g<br />
bars.<br />
Specimens VF2N3, VF2N5 and VF2NV which were used <strong>in</strong> the second phase test had the<br />
same cross section, while axial forces with different load<strong>in</strong>g pattern were applied. Due to less<br />
Column Height: 1,600<br />
Cross Section<br />
400 x 400<br />
Column Height: 1,600<br />
Cross Section<br />
400 x 400<br />
Column Height: 1,320<br />
Cross Section<br />
330 x 330<br />
SRC SC, VF1, VF2, SF2 VF2N3, VF2N5, VF2NV <strong>CES</strong>U<br />
Re<strong>in</strong>forcement fiber<br />
Column<br />
Section<br />
Concrete<br />
Figure 4 – Test specimens<br />
Table 1 – Test program<br />
Column Height: 1,600<br />
Cross Section<br />
400 x 400<br />
Specimen SRC SC VF1 VF2 SF2 VF2N3 VF2N5 VF2NV <strong>CES</strong>U<br />
Type -<br />
Volume<br />
content<br />
PVA fiber<br />
(RF4000)<br />
SS fiber<br />
(F430D)<br />
PVA fiber<br />
(RF4000)<br />
- 1.00% 2.00% 2.00% 2.00% 1.50%<br />
Width b(mm) 400 330 400<br />
Depth D(mm) 400 330 400<br />
Comp.<br />
Strength σB(MPa) 35.5 37.3 52.3 55.5 65.3 46 38 33.5<br />
Young<br />
Modulus<br />
Ec(GPa) 24.1 26.1 26.2 26.3 26.5 29.8 27.4 -<br />
Column height h(mm) 1600 1320 1600<br />
Shear-span ratio a/D 2<br />
Shape Double H section (+ shaped) H section<br />
250×125<br />
×6×9<br />
300×220<br />
×10×15<br />
Section size<br />
300×150×6.5×9 250×125×6×9<br />
Flange Yield<br />
Strength σfy(MPa)<br />
Built-<strong>in</strong><br />
Steel<br />
300 323 337 335 289<br />
Web Yield<br />
Strength σwy(MPa) 347 412 364 393 299<br />
Applied Axial Force<br />
Load<strong>in</strong>g<br />
N(kN) 1100<br />
Constant<br />
1500 2380<br />
Vary<strong>in</strong>g<br />
2380 -910<br />
Constant<br />
1600<br />
Axial yield<br />
bDσB(kN)<br />
No(kN)*<br />
5680<br />
7186<br />
5968<br />
8125<br />
8368<br />
9994<br />
8880<br />
10414<br />
10448<br />
11699<br />
5009<br />
6670<br />
4138<br />
5959<br />
5360<br />
6906<br />
Axial force ratio<br />
N/bDσB<br />
N/No<br />
0.19<br />
0.15<br />
0.18<br />
0.14<br />
0.13<br />
0.11<br />
0.12<br />
0.11<br />
0.11<br />
0.09<br />
0.30<br />
0.22<br />
0.58<br />
0.40<br />
0.58<br />
0.40<br />
-0.22<br />
-0.15<br />
0.30<br />
0.17<br />
*:N o= cN cu+ sN cu= cr u・σ B・ cA+ sσ y・ sA
axial load<strong>in</strong>g capacity <strong>of</strong> the load<strong>in</strong>g apparatus used, the cross section <strong>of</strong> these three specimens<br />
had become smaller, 330mm square, compared with previous specimens with a 400 mm square<br />
section. The column height <strong>of</strong> 1,320 mm was planned to be the height-depth ratio <strong>of</strong> 4.0. FRC<br />
with PVA fiber <strong>of</strong> 2.0% <strong>in</strong> the volume content ratios and double-H section steel <strong>of</strong> 250×125×6×9<br />
mm were used for all specimens.<br />
On the other hand, Specimen <strong>CES</strong>U <strong>in</strong> the third phase test had the same cross section and<br />
column height as specimens <strong>in</strong> the first phase test, while FRC with PVA fiber <strong>of</strong> 1.5% and s<strong>in</strong>gle<br />
H-section steel <strong>of</strong> 300×220×10×15 mm were used.<br />
(2) Test set-up and load<strong>in</strong>g procedures<br />
In the first phase test, the specimens were loaded lateral cyclic shear forces by us<strong>in</strong>g two<br />
horizontal hydraulic jacks, which were <strong>in</strong>stalled <strong>in</strong> parallel each other for one direction, and a<br />
constant axial compression <strong>of</strong> 1,100kN by us<strong>in</strong>g four vertical actuators, as shown <strong>in</strong> Photo 1.<br />
The axial compression ratios, N ( b ⋅ D ⋅σ<br />
B ) , were 0.19 for Specimen SRC, 0.18 for Specimen<br />
SC, 0.13 for Specimen VF1, 0.12 for Specimen VF2 and 0.11 for Specimen SF2, respectively.<br />
The loads were applied through a steel frame attached at the top <strong>of</strong> a column that was fixed to<br />
the base. The four vertical actuators to apply the constant axial compression were also used to<br />
keep the column top beam parallel to the bottom beam, so that the column would be subjected<br />
to anti-symmetric moments.<br />
In the second phase test, the load<strong>in</strong>g apparatus used was the same as <strong>in</strong> the first phase test.<br />
Specimens VF2N3 and VF2N5 were subjected to constant axial load <strong>of</strong> 1,500 kN and 2,380 kN<br />
( N ( b ⋅ D ⋅σ<br />
B ) =0.3 and 0.58), respectively. On the other hand, Specimen VF2NV was subjected<br />
to vary<strong>in</strong>g axial load <strong>of</strong> rang<strong>in</strong>g from -910 kN to 2,380 kN ( N ( b ⋅ D ⋅σ<br />
B ) =-0.22 to 0.58). This<br />
specimen represented an external column <strong>in</strong> the lower story <strong>of</strong> 20-story frame build<strong>in</strong>g. The<br />
applied vary<strong>in</strong>g axial force was given by N = 0.<br />
1 ⋅ Ni<br />
± Q , where N i = Initial axial force and Q =<br />
applied shear force.<br />
Specimens <strong>CES</strong>U <strong>in</strong> the third phase test was tested by us<strong>in</strong>g new load<strong>in</strong>g apparatus shown <strong>in</strong><br />
Photo 2, which was almost the same function and performance as the apparatus used <strong>in</strong> the<br />
first and second phases. Constant axial load <strong>of</strong> 1,600 kN ( N ( b ⋅ D ⋅σ<br />
B ) =0.3) was applied to the<br />
specimen.<br />
Photo 1 – Test set-up for Phases 1 and 2 Photo 2 – Test set-up for Phase 3
The same load<strong>in</strong>g pattern was employed <strong>in</strong> all tests. The <strong>in</strong>cremental load<strong>in</strong>g cycles were<br />
controlled by drift angles, R, def<strong>in</strong>ed as the ratio <strong>of</strong> lateral displacements to column height, δ/h.<br />
The lateral load<strong>in</strong>g sequence consisted <strong>of</strong> two cycle to R =0.005, 0.01, 0.015, 0.02, 0.03, 0.04<br />
rad. and half cycle to R=0.05 rad., then the test was term<strong>in</strong>ated.<br />
STRUCTURAL PERFORMANCE OF <strong>CES</strong> COLUMNS USING FRC<br />
Failure Mode and Shear-Drift Response<br />
The yield and maximum strengths and the correspond<strong>in</strong>g drift angles <strong>in</strong> the positive load<strong>in</strong>gs for<br />
each specimen are listed <strong>in</strong> Table 2. The yield<strong>in</strong>g <strong>of</strong> each specimen was assumed when the first<br />
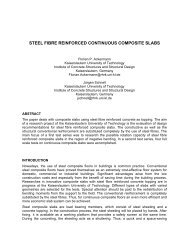
yield<strong>in</strong>g <strong>of</strong> steel flange was observed. The shear versus drift angle responses and crack<br />
patterns after load<strong>in</strong>gs for each specimen were compared <strong>in</strong> Figure 5 and Photo 3, respectively.<br />
In the Figure 5, dotted l<strong>in</strong>es express the flexural strengths, Qfcal, calculated by the strength<br />
superposition method (AIJ 2001) <strong>in</strong> which the flexural strengths contributed by FRC and steel<br />
are cumulatively <strong>in</strong>creased. The dotted l<strong>in</strong>es are drawn by consider<strong>in</strong>g the P-δ effect due to the<br />
load<strong>in</strong>g system employed.<br />
In the first phase test, Specimen SRC showed relatively stable behavior with sp<strong>in</strong>dle shaped<br />
hysteresis loops which is a marked characteristic <strong>of</strong> composite column although a little<br />
deterioration <strong>in</strong> load carry<strong>in</strong>g capacity after atta<strong>in</strong><strong>in</strong>g to the maximum strength was observed.<br />
Buck<strong>in</strong>g <strong>of</strong> re<strong>in</strong>forc<strong>in</strong>g bars at the both column ends was also observed <strong>in</strong> the load<strong>in</strong>g cycle <strong>of</strong> R<br />
<strong>of</strong> 0.04 rad. due to spall<strong>in</strong>g <strong>of</strong> cover concrete caused by compressive failure <strong>in</strong> critical h<strong>in</strong>ge<br />
regions, as shown <strong>in</strong> Photo 3.<br />
Table 2 – Yield and maximum strengths and the correspond<strong>in</strong>g drift angles <strong>in</strong> positive load<strong>in</strong>g<br />
Specimen SRC SC VF1 VF2 SF2 VF2N3 VF2N5 VF2NV <strong>CES</strong>U<br />
at Ry (rad./100) 1.3 1.0 1.1 1.0 1.1 1.0 1.0 1.4 0.6<br />
Yield<strong>in</strong>g<br />
Qy (kN) 620 527 612 608 643 425 415 448 592<br />
at Max.<br />
Rmax (rad./100) 1.5 1.0 1.5 1.5 2.0 1.5 1.2 1.5 1.3<br />
Capacity<br />
Qmax (kN) 638 527 689 703 738 481 439 454 734<br />
SRC SC VF1 VF2 SF2 VF2N3 VF2N5 VF2NV <strong>CES</strong>U<br />
Photo 3 – Crack modes <strong>of</strong> specimens after load<strong>in</strong>g
Shear (kN)<br />
Shear (kN)<br />
Shear (kN)<br />
800<br />
600<br />
400<br />
200<br />
0<br />
-200<br />
-400<br />
-600<br />
-800<br />
800<br />
600<br />
400<br />
200<br />
0<br />
-200<br />
-400<br />
-600<br />
-800<br />
600<br />
400<br />
200<br />
0<br />
-200<br />
-400<br />
-600<br />
-4<br />
-4<br />
-4<br />
SRC<br />
VF1<br />
-3<br />
-3<br />
VF2N3<br />
-3<br />
-2 -1 0 1 2 3<br />
Drift Angle (x10 -2 rad.)<br />
-2 -1 0 1 2 3<br />
Drift Angle (x10 -2 rad.)<br />
-2 -1 0 1 2 3<br />
Drift Angle (x10 -2 rad.)<br />
: Q fcal<br />
4<br />
: Q fcal<br />
4<br />
: Q fcal<br />
4<br />
5<br />
5<br />
5<br />
Shear (kN)<br />
Shear (kN)<br />
Shear (kN)<br />
800<br />
600<br />
400<br />
200<br />
0<br />
-200<br />
-400<br />
-600<br />
-800<br />
800<br />
600<br />
400<br />
200<br />
0<br />
-200<br />
-400<br />
-600<br />
-800<br />
600<br />
400<br />
200<br />
0<br />
-200<br />
-400<br />
-600<br />
-4<br />
-4<br />
-4<br />
SC<br />
VF2<br />
-3<br />
-3<br />
VF2N5<br />
-3<br />
-2 -1 0 1 2 3<br />
Drift Angle (x10 -2 rad.)<br />
-2 -1 0 1 2 3<br />
Drift Angle (x10 -2 rad.)<br />
-2 -1 0 1 2 3<br />
Drift Angle (x10 -2 rad.)<br />
In Specimen SC which is a <strong>CES</strong> column with normal concrete, shear cracks occurred <strong>in</strong> the<br />
central part <strong>of</strong> the column at an early stage, R <strong>of</strong> 0.005 rad., due to no transverse re<strong>in</strong>forcement.<br />
Then, after atta<strong>in</strong><strong>in</strong>g to the maximum strength with yield<strong>in</strong>g <strong>of</strong> steel flange <strong>in</strong> the both end <strong>of</strong> the<br />
column at R <strong>of</strong> 0.01 rad., significant propagation <strong>of</strong> the shear cracks, the spall<strong>in</strong>g <strong>of</strong> cover<br />
concrete and a little deterioration <strong>in</strong> load carry<strong>in</strong>g capacity were observed with an <strong>in</strong>crease <strong>of</strong><br />
drift angles. As shown <strong>in</strong> Figure 5, however, the column showed relatively stable behavior with<br />
sp<strong>in</strong>dle shaped hysteresis loops as well as Specimen SRC although the maximum strengths <strong>in</strong><br />
both positive and negative load<strong>in</strong>gs were somewhat less than the calculated flexural strength.<br />
In <strong>CES</strong> column specimens with FRC, on the other hand, crack modes <strong>of</strong> concrete were quite<br />
different from those <strong>in</strong> Specimens SRC and SC.<br />
In Specimen VF1 with PVA fiber <strong>of</strong> 1.0% <strong>in</strong> the volume content ratio, flexural cracks occurred<br />
first at R <strong>of</strong> about 0.003 rad. at both top and bottom <strong>of</strong> the column. With an <strong>in</strong>crease <strong>of</strong> drift<br />
angles, the flexural cracks propagated and th<strong>in</strong> shear cracks dispersed all over the column. The<br />
specimen showed stable and sp<strong>in</strong>dle shaped hysteresis loops with a little deterioration <strong>in</strong> load<br />
carry<strong>in</strong>g capacity after atta<strong>in</strong><strong>in</strong>g to the maximum capacity at R <strong>of</strong> 0.015 rad. Specimen VF2 with<br />
PVA fiber <strong>of</strong> 2.0% showed slightly better hysteresis loops without dist<strong>in</strong>ct deterioration <strong>in</strong> load<br />
carry<strong>in</strong>g capacity than those <strong>of</strong> Specimen VF1. Specimen VF2 also showed better propagation<br />
<strong>of</strong> cracks <strong>in</strong> cover concrete that means better performance <strong>in</strong> the damage limitation than<br />
Specimen VF1. Specimen SF2 with SS fiber <strong>of</strong> 2.0% showed high structural performance with<br />
the highest maximum capacity among the tested specimens. As shown <strong>in</strong> Photo 3, the spall<strong>in</strong>g<br />
<strong>of</strong> cover concrete due to the propagation <strong>of</strong> cracks, crush<strong>in</strong>g <strong>in</strong> concrete and so on was not<br />
observed until R <strong>of</strong> 0.05 rad. <strong>in</strong> these three specimens.<br />
: Q fcal<br />
4<br />
: Q fcal<br />
4<br />
: Q fcal<br />
Figure 5 – Shear versus drift angle responses<br />
4<br />
5<br />
5<br />
5<br />
Shear (kN)<br />
Shear (kN)<br />
Shear (kN)<br />
800<br />
600<br />
400<br />
200<br />
0<br />
-200<br />
-400<br />
-600<br />
-800<br />
800<br />
600<br />
400<br />
200<br />
0<br />
-200<br />
-400<br />
-600<br />
-800<br />
600<br />
400<br />
200<br />
0<br />
-200<br />
-400<br />
-600<br />
-4<br />
-4<br />
-4<br />
<strong>CES</strong>U<br />
SF2<br />
-3<br />
-3<br />
VF2NV<br />
-3<br />
-2 -1 0 1 2 3<br />
Drift Angle (x10 -2 rad.)<br />
-2 -1 0 1 2 3<br />
Drift Angle (x10 -2 rad.)<br />
-2 -1 0 1 2 3<br />
Drift Angle (x10 -2 rad.)<br />
: Q fcal<br />
4<br />
: Q fcal<br />
4<br />
: Q fcal<br />
4<br />
5<br />
5<br />
5
In the second phase test, the compressive failure and fall down <strong>of</strong> concrete cover did not<br />
occurred for all specimens, Specimens VF2N3, VF2N5 and VF2NV, as seen <strong>in</strong> Photo 3. In all<br />
specimens, moreover, there was concrete unfilled part near the bottom <strong>of</strong> the column after<br />
concrete cast<strong>in</strong>g which was repaired by concrete mortar, and it is observed that most <strong>of</strong> flexural<br />
deformation concentrated with the development <strong>of</strong> significant flexural cracks on the repaired<br />
part. In Specimen VF2N5 subjected to high constant axial force, the significant vertical cracks,<br />
which are compressive cracks, occurred. On the other hand, for Specimen VF2NV which is<br />
subjected to vary<strong>in</strong>g axial force, many small shear cracks dispersedly occurred.<br />
Specimen VF2N3 had the highest maximum strength compared with other two specimens. It is<br />
considered as one <strong>of</strong> the reasons that the concrete strength <strong>of</strong> this specimen was higher than<br />
that <strong>of</strong> other two specimens, even though the lowest axial force ratio ( N ( b D ⋅σ<br />
)<br />
⋅ =0.32) was<br />
applied among these 3 specimens. In this specimen, the maximum strength <strong>of</strong> 481kN was<br />
reached at R <strong>of</strong> 0.015 rad. After atta<strong>in</strong><strong>in</strong>g to the maximum strength, the load carry<strong>in</strong>g capacity<br />
decreased slightly. However, if the P-δ effect due to the behavior <strong>of</strong> the load<strong>in</strong>g apparatus is<br />
considered, it is seen that there is almost no decrease <strong>of</strong> the strength. After R <strong>of</strong> 0.03 rad. at the<br />
second cycle, the shape <strong>of</strong> hysteresis curve was changed to be the p<strong>in</strong>ch<strong>in</strong>g shape gradually.<br />
Specimen VF2N5 showed larger sp<strong>in</strong>dle shaped hysteresis loops than those <strong>of</strong> Specimen<br />
VF2N3. In this specimen, the maximum strength <strong>of</strong> 439 kN was reached at R <strong>of</strong> 0.012 rad. Also,<br />
if the P-δ effect due to the load<strong>in</strong>g system, there was little strength degradation after atta<strong>in</strong><strong>in</strong>g to<br />
the maximum strength, which is almost similar with Specimen VF2N3 show<strong>in</strong>g a stable behavior.<br />
However, the axial deformation reached to 10mm at R <strong>of</strong> 0.04 rad. The elastic behavior <strong>of</strong> axial<br />
deformation was observed until R <strong>of</strong> 0.01 rad., then, the compression deformation <strong>in</strong>creased<br />
rapidly. It was observed that the development <strong>of</strong> axial deformation <strong>in</strong> this specimen was the<br />
highest among these three specimens tested.<br />
In Specimen VF2NV which is subjected to vary<strong>in</strong>g axial force, the column had the maximum<br />
strength <strong>of</strong> 453.5kN at R <strong>of</strong> 0.0151rad. When tensile axial force was applied, moreover, the<br />
maximum strength <strong>of</strong> 349 kN was reached at R <strong>of</strong> -0.04rad. On tensile axial force side, the<br />
sp<strong>in</strong>dle shaped hysteresis loops was observed, while the curves showed a p<strong>in</strong>ch<strong>in</strong>g shape on<br />
compressive axial force side. For axial deformation, tensile deformation <strong>in</strong>creased with the<br />
<strong>in</strong>crease <strong>of</strong> drift angles on tensile axial force side, but, on compressive axial force side, the peak<br />
axial deformation <strong>of</strong> 1.3 mm was reached at R <strong>of</strong> 0.015rad. and then, the deformations tended<br />
to be constant. The axial deformation versus drift angle response <strong>of</strong> Specimen VF2NV is shown<br />
<strong>in</strong> Figure 9(b) with the analytical results.<br />
As mentioned earlier, there was a repaired part near the bottom <strong>of</strong> the column for each<br />
specimen where the flexural-shear and axial deformations were <strong>in</strong>tensive <strong>in</strong> this portion.<br />
However, the shear versus drift angle responses showed a stable behavior.<br />
In Specimen <strong>CES</strong>-U, cracks occurred <strong>in</strong> the connections between the column and load<strong>in</strong>g stubs<br />
at R <strong>of</strong> 0.005 rad. <strong>in</strong> the tension side <strong>of</strong> the top and bottom <strong>of</strong> the column, and simultaneously<br />
flexural cracks occurred <strong>in</strong> the tensile region <strong>of</strong> the top and bottom <strong>of</strong> the column due to bend<strong>in</strong>g<br />
moments. These flexural cracks propagated and then, shear cracks appeared on the top and<br />
bottom <strong>of</strong> the column at R <strong>of</strong> 0.01rad. Cracks due to compression were also observed <strong>in</strong> this<br />
stage. Moreover, flexural and shear cracks <strong>in</strong>creased with an <strong>in</strong>crease <strong>of</strong> drift angles, and the<br />
<strong>in</strong>crease <strong>of</strong> compression cracks was observed significantly. The specimen showed almost<br />
elastic behavior until the yield<strong>in</strong>g <strong>of</strong> steel at R <strong>of</strong> 0.013 rad. <strong>in</strong> positive load<strong>in</strong>g and -0.014 rad. <strong>in</strong><br />
negative load<strong>in</strong>g. After atta<strong>in</strong><strong>in</strong>g to the maximum strength, little deterioration <strong>in</strong> load carry<strong>in</strong>g<br />
capacity was observed until R <strong>of</strong> ±0.04 rad. At R <strong>of</strong> 0.05 rad., however, the strength degradation<br />
was somewhat observed.<br />
B
Simulat<strong>in</strong>g <strong>Behavior</strong> <strong>of</strong> <strong>CES</strong> Column<br />
The analytical method used for simulat<strong>in</strong>g the behavior <strong>of</strong> <strong>CES</strong> columns is a common fiber<br />
idealization that explicitly models the column by divid<strong>in</strong>g its cross section <strong>in</strong>to a number <strong>of</strong> small<br />
areas or filaments, as shown <strong>in</strong> Figure 6. Each fiber is assumed to be uniaxially stressed and to<br />
behave accord<strong>in</strong>g to assumed hysteresis stress-stra<strong>in</strong> characteristics <strong>of</strong> its constitut<strong>in</strong>g<br />
materials, as expla<strong>in</strong>ed below. For this analysis, the cross section <strong>of</strong> column was divided <strong>in</strong>to 40<br />
elements to obta<strong>in</strong> a higher accuracy. This method assumes that the plane sections to rema<strong>in</strong><br />
plane, thus imply<strong>in</strong>g full compatibility between the steel and FRC components <strong>of</strong> a composite<br />
cross section.<br />
The analysis is controlled through a series <strong>of</strong> small steps by curvature or displacement history <strong>in</strong><br />
terms <strong>of</strong> X-axis. With the axial stra<strong>in</strong> at the center <strong>of</strong> the cross section, Δε0 and the curvatures<br />
along <strong>in</strong> terms <strong>of</strong> X-axis, Δφx, the axial stra<strong>in</strong> at the fiber element <strong>of</strong> i, Δεi is found accord<strong>in</strong>g to<br />
Δεi =Δε0 + yi Δφx, where yi is the distance from the X-axis to the i-th fiber element on the section.<br />
Consider<strong>in</strong>g the equilibrium <strong>of</strong> the section, axial force ΔN and bend<strong>in</strong>g moment ΔM are written<br />
as {ΔN, ΔM} T = [K] {Δε0, Δφx} T , where [K] is stiffness matrix. In this analysis, ΔN, ΔM and Δε0<br />
were calculated by consider<strong>in</strong>g the mechanical properties <strong>of</strong> steel and FRC, as Δφx was the<br />
<strong>in</strong>put data.<br />
In this section, analytical results for Specimen VF2NV subjected to vary<strong>in</strong>g axial forces are<br />
shown as an example.<br />
The hysteretic model used for the steel was the tri-l<strong>in</strong>ear model proposed by Shibata (1982), as<br />
shown <strong>in</strong> Figure 7. Yield strengths <strong>in</strong> both compression and tension are assumed to be equal.<br />
Post yield stiffness ES3 and reduced stiffness due to the Bausch<strong>in</strong>ger effect ES2 are taken as<br />
1/200 and 1/5 <strong>of</strong> the elastic stiffness ES1, respectively. The <strong>in</strong>cl<strong>in</strong>e <strong>of</strong> stiffness chang<strong>in</strong>g l<strong>in</strong>e C is<br />
taken as -1/200 <strong>of</strong> ES1.<br />
The hysteretic models <strong>of</strong> concrete adopted were the divided l<strong>in</strong>ear models shown <strong>in</strong> Figure 8 for<br />
both cover and core concrete. For cover concrete, an <strong>in</strong>itial l<strong>in</strong>ear stiffness up to 40 percent <strong>of</strong><br />
concrete strength EC1, a reduced l<strong>in</strong>ear stiffness until peak stress has reached EC2, and the<br />
slope <strong>of</strong> fail<strong>in</strong>g l<strong>in</strong>ear branch EC3, were given as 1.6σB/εc0, EC1/3 and EC1/5, respectively,<br />
accord<strong>in</strong>g to the results <strong>of</strong> concrete cyl<strong>in</strong>der tests, where σB is the concrete cyl<strong>in</strong>der strength<br />
and εc0 is the compressive stra<strong>in</strong> at the stress peak, which was taken as -0.003. For core<br />
concrete, on the other hand, the same values <strong>of</strong> EC1 and EC2 were adopted as the cover<br />
concrete although EC3 was taken as EC1/80 for Specimens VF2NV. Furthermore, a magnification<br />
factor <strong>of</strong> concrete strength K for conf<strong>in</strong>ed core concrete was considered as 1.25 for the<br />
specimen. L<strong>in</strong>er stiffness at unload<strong>in</strong>g EC4 for both cover and core concrete was taken as σE/(εE<br />
–εR), where σE and εE were the stress and stra<strong>in</strong> at an unload<strong>in</strong>g po<strong>in</strong>t on the envelope curve,<br />
and εR was the residual stra<strong>in</strong> (εR =5εE 1.5 and |εR| ≤ 4|εE|/ 5).<br />
Figure 6 – Fiber model Figure 7 – Steel model Figure 8 – Concrete model
Shear (kN)<br />
600<br />
400<br />
200<br />
0<br />
-200<br />
-400<br />
-600<br />
-4<br />
VF2NV<br />
-3<br />
-2<br />
-1<br />
0<br />
1<br />
2<br />
Drift Angle (x10 -2 rad.)<br />
: Analyzed<br />
: Tested<br />
3<br />
4<br />
5<br />
The shear versus drift response for the columns were obta<strong>in</strong>ed assum<strong>in</strong>g an antisymmetric<br />
distribution <strong>of</strong> bend<strong>in</strong>g moments along the column height, with the <strong>in</strong>flection po<strong>in</strong>t at mid-height.<br />
Consider<strong>in</strong>g the experimental results for curvature distribution along the column height, the<br />
relation between curvature and drift angles, φ and R, was assumed as φ = 3.3 R/L for<br />
Specimens VF2NV, although <strong>in</strong> elastic assumption the relation is def<strong>in</strong>ed as φ = 6 R/L, where L<br />
is the column height. Moreover, the axial deformation, δv, was calculated by assum<strong>in</strong>g as δv<br />
=ε0*L/2.<br />
Figure 9 shows the analytical results <strong>of</strong> the shear versus drift angles response and the axial<br />
deformation versus drift angle response. As can be seen <strong>in</strong> both responses, the analytical<br />
results showed a satisfactory agreement with the experimental results. Thus, the hysteresis<br />
behavior <strong>of</strong> <strong>CES</strong> columns can be simulated precisely by a common fiber analysis because the<br />
columns are simple composite structural members consist<strong>in</strong>g <strong>of</strong> only steel and FRC.<br />
CONCLUSIONS<br />
Experimental studies on <strong>CES</strong> columns us<strong>in</strong>g FRC conducted by the authors <strong>in</strong> past about eight<br />
years were <strong>in</strong>troduced with the advantage <strong>of</strong> <strong>CES</strong> structures. The pr<strong>in</strong>ciple conclusions<br />
obta<strong>in</strong>ed from the studies can be drawn as follows.<br />
1) <strong>CES</strong> structure is a simple composite structural system consist<strong>in</strong>g <strong>of</strong> only steel and FRC,<br />
which can make construction cost and time reduced. <strong>CES</strong> structure can be widely used for<br />
various scaled build<strong>in</strong>gs from low to high-rise or from small to large-scale. And also the precast<br />
design and construction <strong>of</strong> <strong>CES</strong> structure will be easier than those <strong>of</strong> SRC structure.<br />
2) <strong>CES</strong> structural system can be applied for not only <strong>CES</strong> frame build<strong>in</strong>gs but also various<br />
mixed build<strong>in</strong>g types such as consist<strong>in</strong>g <strong>of</strong> <strong>CES</strong> columns with other structural type <strong>of</strong> beams,<br />
CFT columns with <strong>CES</strong> beams, <strong>CES</strong> frame with braces or shear walls, etc.<br />
3) <strong>CES</strong> columns us<strong>in</strong>g FRC have almost the same structural performance as SRC columns<br />
which possess an excellent earthquake resistance with high capacities and deformability.<br />
4) Use <strong>of</strong> FRC makes the easy restoration <strong>of</strong> <strong>CES</strong> columns possible because the damages <strong>in</strong><br />
cover concrete <strong>of</strong> the columns due to flexural and shear cracks are relatively light even at the<br />
large story drifts.<br />
5) The hysteresis behavior <strong>of</strong> <strong>CES</strong> columns can be simulated precisely by a common fiber<br />
analysis because the columns are simple composite structural members consist<strong>in</strong>g <strong>of</strong> only<br />
steel and FRC.<br />
Axial Deformation (mm)<br />
10<br />
9<br />
8<br />
7<br />
6<br />
5<br />
4<br />
3<br />
2<br />
1<br />
0<br />
-1<br />
-2<br />
-4<br />
-3<br />
-2 -1 0 1 2<br />
Drift Angle (x10 -2 rad.)<br />
3<br />
VF2NV<br />
: Analyzed<br />
: Tested<br />
Figure 9 – Comparison between analytical and experimental results for Specimen VF2NV<br />
4<br />
5
REFEREN<strong>CES</strong><br />
Adachi. T., Kuramoto, H., Kawasaki, K. and Shibayama, Y. (2003). “Study on <strong>Structural</strong><br />
Performance <strong>of</strong> <strong>Composite</strong> <strong>CES</strong> <strong>Columns</strong> Us<strong>in</strong>g FRC Subjected to High Axial Compression”,<br />
Proceed<strong>in</strong>gs <strong>of</strong> Japan Concrete Institute, Vol. 25, No. 2, pp. 289-294. (<strong>in</strong> Japanese)<br />
AIJ (2001). “Standard for <strong>Structural</strong> Calculation <strong>of</strong> Steel Re<strong>in</strong>forced Concrete Structures”,<br />
Architectural Institute <strong>of</strong> Japan.<br />
Kuramoto H., Kabeyasawa T. and Shen F-H. (1995).” Influence <strong>of</strong> axial deformation on ductility<br />
<strong>of</strong> high-strength re<strong>in</strong>forced concrete columns under vary<strong>in</strong>g triaxial forces.” ACI <strong>Structural</strong><br />
Journal, Vol. 92, No. 5, pp. 610-618.<br />
Kuramoto, H., Takahashi H. and Maeda M. (2000), “Feasibility Study on <strong>Structural</strong> Performance<br />
<strong>of</strong> Concrete Encased Steel <strong>Columns</strong> us<strong>in</strong>g High Performance Fiber Re<strong>in</strong>forced Cementitious<br />
<strong>Composite</strong>s”. Summaries <strong>of</strong> Technical Papers <strong>of</strong> Annual Meet<strong>in</strong>g, AIJ, Vol. C-1, pp.1085-<br />
1088. (<strong>in</strong> Japanese)<br />
Kuramoto, H., Adachi, T. and Kawasaki, K. (2002). “<strong>Behavior</strong> <strong>of</strong> Concrete Encased Steel<br />
<strong>Composite</strong> <strong>Columns</strong> Us<strong>in</strong>g FRC.” Proceed<strong>in</strong>gs <strong>of</strong> Workshop on Smart <strong>Structural</strong> <strong>System</strong>s<br />
Organized for US-Japan Cooperative Research Programs on Smart <strong>Structural</strong> <strong>System</strong>s<br />
(Auto-Adaptive Media) and Urban Earthquake Disaster Mitigation, Tsukuba, Japan, pp.13-26.<br />
Kuramoto, H., Matsui, M., Nagata, S. and Fujimoto, T. (2008). “<strong>Structural</strong> Performance <strong>of</strong><br />
Exterior Beam-Column Jo<strong>in</strong>ts for <strong>Composite</strong> <strong>CES</strong> <strong>Structural</strong> <strong>System</strong>s”, Journal <strong>of</strong> <strong>Structural</strong><br />
and Construction Eng<strong>in</strong>eer<strong>in</strong>g (Trans. <strong>of</strong> AIJ), No.624, pp.235-242. (<strong>in</strong> Japanese)<br />
Matsui, T. and Kuramoto, H. (2007), “Three Dimensional Non-L<strong>in</strong>ear FEM Analysis <strong>of</strong> <strong>CES</strong><br />
Beam-Column Jo<strong>in</strong>ts”, Proceed<strong>in</strong>gs <strong>of</strong> 8th Pacific Conference on Earthquake Eng<strong>in</strong>eer<strong>in</strong>g,<br />
S<strong>in</strong>gapore, Paper No. 4A127 (CD-ROM).<br />
Shibata M. (1982),” Analysis <strong>of</strong> Elastic-Plastic <strong>Behavior</strong> <strong>of</strong> Steel Brace Subjected to Repeated<br />
Axial force.” International Journal <strong>of</strong> Solids and Structures, Vol. 8, No. 3, pp. 217-228.<br />
Taguch. T., Nagata, S., Matsui, T. and Kuramoto, H. (2006). “<strong>Structural</strong> Performance <strong>of</strong> <strong>CES</strong><br />
<strong>Columns</strong> Us<strong>in</strong>g S<strong>in</strong>gle H-shaped Steel”, Proceed<strong>in</strong>gs <strong>of</strong> Japan Concrete Institute, Vol. 28, No.<br />
2, pp.1273-1278. (<strong>in</strong> Japanese)