developing composite action in existing non-composite steel girder ...
developing composite action in existing non-composite steel girder ...
developing composite action in existing non-composite steel girder ...

Create successful ePaper yourself
Turn your PDF publications into a flip-book with our unique Google optimized e-Paper software.
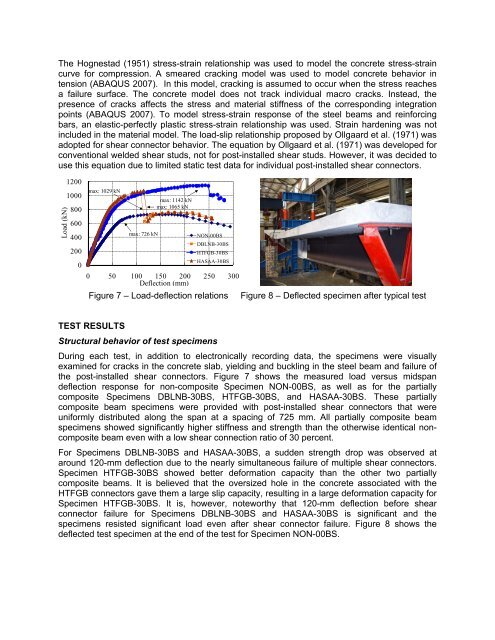
The Hognestad (1951) stress-stra<strong>in</strong> relationship was used to model the concrete stress-stra<strong>in</strong>curve for compression. A smeared crack<strong>in</strong>g model was used to model concrete behavior <strong>in</strong>tension (ABAQUS 2007). In this model, crack<strong>in</strong>g is assumed to occur when the stress reachesa failure surface. The concrete model does not track <strong>in</strong>dividual macro cracks. Instead, thepresence of cracks affects the stress and material stiffness of the correspond<strong>in</strong>g <strong>in</strong>tegrationpo<strong>in</strong>ts (ABAQUS 2007). To model stress-stra<strong>in</strong> response of the <strong>steel</strong> beams and re<strong>in</strong>forc<strong>in</strong>gbars, an elastic-perfectly plastic stress-stra<strong>in</strong> relationship was used. Stra<strong>in</strong> harden<strong>in</strong>g was not<strong>in</strong>cluded <strong>in</strong> the material model. The load-slip relationship proposed by Ollgaard et al. (1971) wasadopted for shear connector behavior. The equation by Ollgaard et al. (1971) was developed forconventional welded shear studs, not for post-<strong>in</strong>stalled shear studs. However, it was decided touse this equation due to limited static test data for <strong>in</strong>dividual post-<strong>in</strong>stalled shear connectors.Load (kN)120010008006004002000max: 1029 kNmax: 1142 kNmax: 1065 kNmax: 726 kNNON-00BSDBLNB-30BSHTFGB-30BSHASAA-30BS0 50 100 150 200 250 300Deflection (mm)Figure 7 – Load-deflection relations Figure 8 – Deflected specimen after typical testTEST RESULTSStructural behavior of test specimensDur<strong>in</strong>g each test, <strong>in</strong> addition to electronically record<strong>in</strong>g data, the specimens were visuallyexam<strong>in</strong>ed for cracks <strong>in</strong> the concrete slab, yield<strong>in</strong>g and buckl<strong>in</strong>g <strong>in</strong> the <strong>steel</strong> beam and failure ofthe post-<strong>in</strong>stalled shear connectors. Figure 7 shows the measured load versus midspandeflection response for <strong>non</strong>-<strong>composite</strong> Specimen NON-00BS, as well as for the partially<strong>composite</strong> Specimens DBLNB-30BS, HTFGB-30BS, and HASAA-30BS. These partially<strong>composite</strong> beam specimens were provided with post-<strong>in</strong>stalled shear connectors that wereuniformly distributed along the span at a spac<strong>in</strong>g of 725 mm. All partially <strong>composite</strong> beamspecimens showed significantly higher stiffness and strength than the otherwise identical <strong>non</strong><strong>composite</strong>beam even with a low shear connection ratio of 30 percent.For Specimens DBLNB-30BS and HASAA-30BS, a sudden strength drop was observed ataround 120-mm deflection due to the nearly simultaneous failure of multiple shear connectors.Specimen HTFGB-30BS showed better deformation capacity than the other two partially<strong>composite</strong> beams. It is believed that the oversized hole <strong>in</strong> the concrete associated with theHTFGB connectors gave them a large slip capacity, result<strong>in</strong>g <strong>in</strong> a large deformation capacity forSpecimen HTFGB-30BS. It is, however, noteworthy that 120-mm deflection before shearconnector failure for Specimens DBLNB-30BS and HASAA-30BS is significant and thespecimens resisted significant load even after shear connector failure. Figure 8 shows thedeflected test specimen at the end of the test for Specimen NON-00BS.