PDF 2.27 MB - Barrick Gold Corporation
PDF 2.27 MB - Barrick Gold Corporation
PDF 2.27 MB - Barrick Gold Corporation

You also want an ePaper? Increase the reach of your titles
YUMPU automatically turns print PDFs into web optimized ePapers that Google loves.
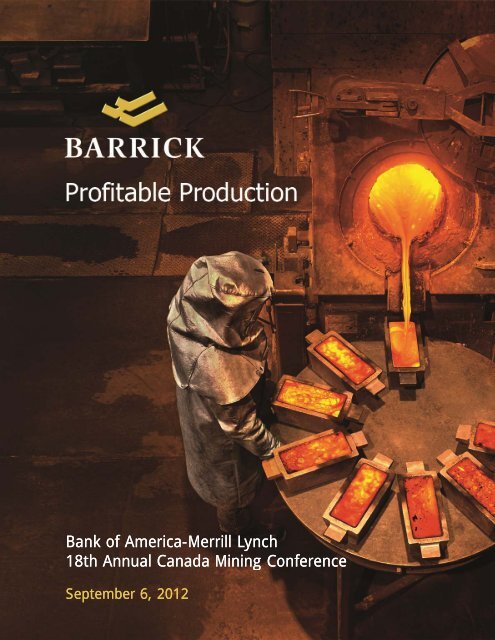
Bank of America-Merrill Lynch<br />
18th Annual Canada Mining Conference<br />
September 6, 2012
CAUTIONARY STATEMENT ON FORWARD-LOOKING INFORMATION<br />
Certain information contained or incorporated by reference in this presentation, including any information as to our strategy,<br />
project plans or future financial or operating performance, constitutes "forward-looking statements". All statements, other<br />
than statements of historical fact, are forward-looking statements. The words "believe", "expect", "anticipate",<br />
"contemplate", "target", "plan", "intend", "continue", "budget", "estimate", "may", "will", "schedule" and similar expressions<br />
identify forward-looking statements. Forward-looking statements are necessarily based upon a number of estimates and<br />
assumptions that, while considered reasonable by the company, are inherently subject to significant business, economic and<br />
competitive uncertainties and contingencies. Known and unknown factors could cause actual results to differ materially from<br />
those projected in the forward-looking statements. Such factors include, but are not limited to: fluctuations in the market<br />
and forward price of gold and copper or certain other commodities (such as silver, diesel fuel and electricity); the impact of<br />
global liquidity and credit availability on the timing of cash flows and the values of assets and liabilities based on projected<br />
future cash flows; fluctuations in the currency markets (such as Canadian and Australian dollars, Chilean and Argentinean<br />
peso, British pound, Peruvian sol, Zambian kwacha and Papua New Guinean kina versus US dollar); changes in US dollar<br />
interest rates that could impact the mark-to-market value of outstanding derivative instruments and ongoing<br />
payments/receipts p under interest rate swaps and variable rate debt obligations; risks arising from holding derivative<br />
instruments (such as credit risk, market liquidity risk and mark-to-market risk); changes in national and local government<br />
legislation, taxation, controls, regulations and political or economic developments in Canada, the United States, Dominican<br />
Republic, Australia, Papua New Guinea, Chile, Peru, Argentina, Tanzania, Zambia, Saudi Arabia, United Kingdom, Pakistan or<br />
Barbados or other countries in which we do or may carry on business in the future; acts of war, terrorism, sabotage and civil<br />
disturbances; business opportunities that may be presented to, or pursued by, the company; our ability to successfully<br />
integrate acquisitions; operating or technical difficulties in connection with mining or development activities; employee<br />
relations; availability and increased costs associated with mining inputs; increased costs and technical challenges associated<br />
with the construction of capital projects; inflation; litigation; the speculative nature of exploration and development, including<br />
the risks of obtaining necessary licenses and permits; diminishing quantities or reserve grades; adverse changes in our credit<br />
rating; contests over title to properties, particularly title to undeveloped properties; and the organization of our previously<br />
held African gold operations and properties under a separate listed company. In addition, there are risks and hazards<br />
associated with the business of exploration, development and mining, including environmental hazards, industrial accidents,<br />
unusual or unexpected formations, pressures, cave-ins, flooding and gold bullion or copper cathode losses (and the risk of<br />
inadequate insurance, or inability to obtain insurance, to cover these risks). Many of these uncertainties and contingencies<br />
can affect our actual results and could cause actual results to differ materially from those expressed or implied in any<br />
forward-looking statements made by, or on behalf of, us. Readers are cautioned that forward-looking statements are not<br />
guarantees of future performance. All of the forward-looking statements made in this presentation are qualified by these<br />
cautionary statements. Specific reference is made to the most recent Form 40-F/Annual Information Form on file with the<br />
SEC and Canadian provincial i securities regulatory authorities for a discussioni of some of the factors underlying forwardlooking<br />
statements.<br />
The company disclaims any intention or obligation to update or revise any forward-looking statements whether as a result of<br />
new information, future events or otherwise, except to the extent required by applicable law.
<strong>Gold</strong> Industry Leader<br />
• World’s largest gold company<br />
• Exceptional gold and copper leverage<br />
• Lowest cost senior<br />
• Strong financial and dividend performance<br />
• Disciplined capital allocation<br />
• Profitable, high quality production<br />
• Committed to socially responsible mining<br />
1<br />
Global Portfolio<br />
2012E Production<br />
Australia<br />
Pacific<br />
25%<br />
North America<br />
46%<br />
South<br />
America<br />
22%<br />
Africa 7%<br />
North<br />
America<br />
South<br />
America<br />
2011 P&P Reserves<br />
Australia<br />
Pacific<br />
11%<br />
North America<br />
42%<br />
South<br />
America<br />
38%<br />
Africa 9%<br />
Africa<br />
Australia<br />
Pacific<br />
Mine<br />
Project<br />
2
Industry Leading Production/Reserves<br />
2011 <strong>Gold</strong> Production (1)<br />
(Moz)<br />
7.7<br />
ABX<br />
2011 <strong>Gold</strong> Reserves (1,2)<br />
(P&P - Moz)<br />
139.9<br />
ABX<br />
5.2<br />
NEM<br />
4.3<br />
98.8<br />
NEM<br />
80.0 77.6 75.6<br />
64.7 62.6<br />
AU<br />
3.5<br />
GFI<br />
2.7<br />
NCM<br />
2.6<br />
KGC<br />
2.5<br />
GG<br />
NCM GFI AU<br />
GG<br />
KGC<br />
(1) Source: Company reports. (2) See final slide #5<br />
3<br />
Exceptional Leverage to <strong>Gold</strong><br />
<strong>Barrick</strong> EPS & CFPS vs <strong>Gold</strong> (1)<br />
Returns (US$)<br />
( = adjusted)<br />
900%<br />
800%<br />
700%<br />
600%<br />
500%<br />
400%<br />
• Sensitivity of<br />
~$500 million or<br />
~50¢ per share<br />
to $100/oz change<br />
in gold price<br />
versus peer average<br />
of 32¢ per share (2)<br />
300%<br />
200%<br />
100%<br />
0%<br />
2004 2005 2006 2007 2008 2009 2010 2011<br />
(1) All EPS figures are adjusted except 2004 is US GAAP basis and all CFPS are on a US GAAP basis except 2009-2011 are adjusted and 2010<br />
and 2011 are on an IFRS basis. (2) Based on 2011 actuals. Peers include Newmont, <strong>Gold</strong>corp, Kinross and Newcrest. See final slide #8.<br />
4
Lowest Cost Senior<br />
Global <strong>Gold</strong> Industry Total Cash Cost Curve (1)<br />
$2,000<br />
$1,500<br />
US$/oz<br />
$1,000<br />
$500<br />
Peer Group 2012E Average (2) ~$740<br />
<strong>Barrick</strong> 2012E $550-$575 (3) 5<br />
$0<br />
Pueblo Viejo $300 to $350 (3)<br />
Pascua-Lama $0 to -$150 (3) 23% 23%<br />
̶ $500<br />
0% 25% 50% 75% 100%<br />
Cumulative Production<br />
(1) Source: GFMS (Q2 2012 data); reported total cash costs/oz (2) Peers include Newmont, <strong>Gold</strong>corp, Kinross, Anglo<strong>Gold</strong> and <strong>Gold</strong> Fields<br />
(3) See final slide #1 and #2<br />
<strong>Barrick</strong> Has Outperformed (5-Year CAGR)<br />
10%<br />
ABX<br />
13%<br />
KGC<br />
15% 15%<br />
NEM<br />
NCM<br />
17%<br />
GG<br />
NCM<br />
GG<br />
27% 27%<br />
KGC<br />
NEM<br />
34%<br />
ABX<br />
EBITDA (1)<br />
(per share)<br />
18%<br />
KGC<br />
12%<br />
GG<br />
19%<br />
NCM<br />
20%<br />
NEM<br />
22%<br />
ABX<br />
Total Cash Costs (1) Total Cash Margins (1) ABX<br />
Total <strong>Gold</strong> Inventory (2)<br />
(per share)<br />
3%<br />
NCM<br />
NEM GG<br />
2%<br />
KGC<br />
0%<br />
NCM<br />
GG<br />
NEM<br />
4%<br />
ABX ABX<br />
KGC<br />
-3%<br />
(1) Refer to final slide #1 (2) Refer to final slide #5. Includes proven and probable reserves, and measured, indicated and inferred resources.<br />
6
Returning Capital<br />
Annualized Dividend (1)<br />
US cents per share<br />
80<br />
60<br />
48<br />
40 40<br />
30<br />
22<br />
2006 2007 2008 2009 2010 2011 2012<br />
(1) Calculation based on annualizing the last dividend paid in the respective year (2) See final slide #6<br />
7<br />
H1 2012 Financial & Operating Results<br />
(Millions)<br />
Adjusted net earnings (1) $1,870<br />
Net earnings $1,779<br />
EBITDA (1) $3,511<br />
Operating cash flow $2,035<br />
<strong>Gold</strong> production (M oz) 3.62<br />
Total cash costs/oz (1) $580<br />
Ttl Total cash margins/oz (1) $1,071<br />
Copper production (M lbs) 226<br />
C1 cash costs/lb (1) $2.18<br />
C1 cash margins/lb (1) $1.44<br />
(1) See final slide #1<br />
8
2012 Operating Outlook<br />
<strong>Gold</strong><br />
Production (Moz) 7.3-7.8<br />
Total Cash Costs (US$/oz) 550-575<br />
Net Cash Costs (US$/oz) 460-500 (1)<br />
Copper<br />
Production (Mlbs) ~450<br />
C1 Cash Costs (US$/lb) 2.10-2.30<br />
(1) Net cash costs based on assumed realized copper price of $3.50/lb for the balance of 2012. See final slide #1<br />
9<br />
Disciplined Capital Allocation<br />
Framework focused on two key metrics:<br />
1. Free cash flow<br />
2. Risk ikadjusted dreturn<br />
• Economic environment and capital size<br />
considerations<br />
• Portfolio management approach<br />
Returns will drive production;<br />
production will not drive returns<br />
10
Disciplined Capital Allocation<br />
Cost<br />
Reductions<br />
Debt<br />
Reduction<br />
Return Capital<br />
to Shareholders<br />
Key<br />
Areas of<br />
Focus<br />
Attractive<br />
Return<br />
Investments<br />
Portfolio<br />
Review and<br />
Optimization<br />
11<br />
Profitable Production<br />
• <strong>Gold</strong> production of<br />
~8 Moz by 2015<br />
• Copper production of<br />
~600 Mlbs by 2015 (1)<br />
• High-quality, profitable<br />
production from which to<br />
expand further<br />
(1) 2013 production expected to be 500-550 Mlbs<br />
12
World Class Operations and Projects<br />
Total Global <strong>Gold</strong> Mines by Size<br />
(2011 gold production)<br />
6 mines<br />
>1 Moz<br />
<strong>Barrick</strong> Mines<br />
Other Mines<br />
21 mines<br />
>500 Koz<br />
8 mines<br />
>800 Koz<br />
3<br />
2<br />
<strong>Gold</strong>strike<br />
Cortez<br />
156 mines<br />
>100 Koz<br />
19<br />
6<br />
1 Project ~800 Koz<br />
Pascua-Lama<br />
~1,000 Koz<br />
Pueblo Viejo (1)<br />
Sources: Metals Economics Group and <strong>Barrick</strong><br />
(1) 100% basis at full capacity<br />
13<br />
Key <strong>Gold</strong> Assets<br />
H1 2012 Total 2011<br />
Production Cash Costs Reserves (1)<br />
(Koz) (US$/oz) (P&P-Moz)<br />
Cortez 794 297 14.5<br />
<strong>Gold</strong>strike 494 588 12.4<br />
Veladero 372 444 10.6<br />
Lagunas Norte 346 320 6.2<br />
2,006 400 43.7<br />
Total/Average 3,623 580 139.9<br />
(1) See final slide #5<br />
14
Pueblo Viejo - ramp up underway<br />
• Completed on schedule<br />
and within capital<br />
guidance<br />
• First gold poured in<br />
August<br />
• 100-125K equity oz of<br />
production in 2012<br />
• $400-$500/oz total cash<br />
costs in 2012 (1)<br />
Autoclave<br />
Operating Deck<br />
Conveyor from Crusher<br />
All figures are <strong>Barrick</strong>’s 60% share<br />
(1) See final slide #3<br />
SAG and Ball Mills<br />
15<br />
Pueblo Viejo - long life, low cost<br />
• 625-675K equity oz of average annual production<br />
in first full five years (1)<br />
• $300-$350/oz total cash costs (1)<br />
• 15.2 M oz of gold reserves (2)<br />
• 25+ year mine life<br />
All figures are <strong>Barrick</strong>’s 60% share (1) See final slide #2 (2) See final slide #5<br />
16
Pascua-Lama - in construction<br />
One of the world’s largest, lowest cost gold mines<br />
• 800-850 Koz of average annual gold production (1)<br />
• 35 Moz of average annual silver production<br />
(1)<br />
• $0 to negative $150/oz total cash costs (1)<br />
• ~18 Moz of gold reserves and ~676 Moz of silver in<br />
gold reserves (2)<br />
• 25 year mine life<br />
(1) See final slide #2 (2) See final slide #5<br />
17<br />
Pascua-Lama - progress review<br />
Capital cost and schedule review<br />
• Progress update to be provided with Q3 results<br />
• Preliminary results indicate first gold expected in<br />
mid-2014 at capital cost of $7.5-$8.0B<br />
Actions underway<br />
• Strengthen project management structure<br />
• Leading EPCM organization to provide<br />
independent assessment of project status<br />
• Mitigation of specific cost pressures<br />
18
Pascua-Lama<br />
Covered Stockpile and<br />
Grinding Building<br />
Process Plant – CIL Leaching Area<br />
19<br />
Jabal Sayid<br />
• Expected to be within capex<br />
guidance of ~$400 M (1)<br />
• 100-130 Mlbs of average<br />
annual copper production in<br />
first full five years (2)<br />
• C1 cash costs of $1.50-<br />
$1.70/lb (2)<br />
• Currently working toward<br />
achieving safety and<br />
security compliance to<br />
enable production<br />
(1) See final slide #2 (2) See final slide #2 and #4<br />
Crusher<br />
Operational<br />
Process Circuit<br />
20
Lumwana - Chimi expansion<br />
Large, long life asset<br />
• Substantially improved production of ~250 Mlbs at<br />
lower C1 cash costs expected in 2013<br />
• Expansion into Chimiwungo is on schedule<br />
– crusher and conveyor system commissioning<br />
completed in July<br />
– ore processed in August<br />
– ~1 1Mtonnes of ore stockpiled to date<br />
• ~75% increase in copper reserves and resources at<br />
the end of 2011<br />
21<br />
Lumwana - positioned for 2013<br />
Actions underway to improve performance:<br />
• Address waste stripping deficit<br />
• Migration to owner maintenance<br />
• Infrastructure improvements<br />
• Key leadership changes at site<br />
22
2012 Exploration Program (1)<br />
North America<br />
North America<br />
45%<br />
Mine<br />
Project<br />
(1) See final slide #7<br />
Australia<br />
Pacific<br />
Australia<br />
Pacific<br />
20%<br />
South<br />
America<br />
10%<br />
Africa 5%<br />
Africa<br />
Copper<br />
20%<br />
South<br />
America<br />
Africa<br />
• 2012 exploration budget of $450-$490M<br />
reflecting 2011 success<br />
Exploration Top 3<br />
Main Exploration Areas<br />
23<br />
Disciplined, Profitable Production<br />
• Industry’s largest production<br />
• Lowest total cash costs among seniors<br />
• World class assets, lower risk global portfolio<br />
• Disciplined capital allocation<br />
• Recalibrated production<br />
• Sharp focus on cost management<br />
• Two large low-cost projects contributing ~1.5 Moz<br />
• No major project capital committed beyond<br />
Pascua-Lama development<br />
• Greater potential to increase dividends, repay debt,<br />
upgrade portfolio by investing at attractive returns<br />
24
Bank of America-Merrill Lynch<br />
18th Annual Canada Mining Conference<br />
September 6, 2012<br />
25<br />
Footnotes<br />
1. Adjusted net earnings, EBITDA, adjusted operating cash flow, gold total and net cash costs per ounce, gold total cash margins per ounce, C1 copper cash<br />
costs per pound and C1 copper cash margins per pound are non-GAAP financial measures. See pages 44-48 of <strong>Barrick</strong>’s Second Quarter Report 2012.<br />
2. All references to total/C1 cash costs and production are based on expected first full 5 year average, except where noted, and total/C1 cash costs do not include<br />
escalation for future inflation. Pueblo Viejo total cash costs and capital cost estimates based on gold and WTI oil price assumptions of $1,300/oz and $90/bbl,<br />
respectively and do not include escalation for future inflation. Pascua-Lama total cash costs based on gold, silver and WTI oil price assumptions of $1,300/oz,<br />
$25/oz and $90/bbl, respectively, and a Chilean Peso assumption of 475:1. Inflation escalation assumptions are as of Q2 2012, and do not include escalation<br />
for future inflation. Jabal Sayid capital cost estimate includes approximately $125 million in incurred costs prior to <strong>Barrick</strong>’s acquisition of Equinox Minerals in<br />
2011.<br />
3. Based on a WTI oil price assumption of $90/bbl. The 2012 total cash cost estimate is dependent on the rate at which production ramps up after commercial<br />
levels of production are achieved. A change in the efficiency of the ramp up could have a significant impact on this estimate.<br />
4. Does not include escalation for future inflation.<br />
5. Calculated in accordance with National Instrument 43-101 as required by Canadian securities regulatory authorities. For United States reporting purposes,<br />
Industry Guide 7 (under the Securities Exchange Act of 1934), as interpreted by the Staff of the SEC, applies different standards in order to classify<br />
mineralization as a reserve. Accordingly, for U.S. reporting purposes, approximately 2.15 million ounces of reserves at Pueblo Viejo (<strong>Barrick</strong>’s 60% interest) is<br />
classified as mineralized material. For a breakdown of reserves and resources by category and additional information relating to reserves and resources, see<br />
pages 161-166 of <strong>Barrick</strong>’s 2011 Year-End Report.<br />
6. The declaration and payment of dividends remains at the discretion of the Board of Directors and will depend on the Company’s financial results, cash<br />
requirements, future prospects and other factors deemed relevant by the Board. Dividends in 2006 were paid semi-annually and were $0.11 per share; a<br />
quarterly equivalent is assumed for comparative purposes with the current dividend. In July 2010, <strong>Barrick</strong> moved from semi-annual to quarterly dividends.<br />
7. <strong>Barrick</strong>’s exploration programs are designed and conducted under the supervision of Robert Krcmarov, Senior Vice President, Global Exploration of <strong>Barrick</strong>. For<br />
information on the geology, exploration activities generally, and drilling and analysis procedures on <strong>Barrick</strong>’s material properties, see <strong>Barrick</strong>’s most recent<br />
Annual Information Form/Form 40-F on file with Canadian provincial securities regulatory authorities and the U.S. Securities and Exchange Commission.<br />
8. Based on 2011 gold production, weighted average shares outstanding and effective tax rates for <strong>Barrick</strong>, Newmont, <strong>Gold</strong>corp, Kinross and Newcrest.<br />
26