Mixed populations of Trypanosoma brucei in wild Glossina palpalis ...
Mixed populations of Trypanosoma brucei in wild Glossina palpalis ...
Mixed populations of Trypanosoma brucei in wild Glossina palpalis ...

You also want an ePaper? Increase the reach of your titles
YUMPU automatically turns print PDFs into web optimized ePapers that Google loves.
314 Trop. Med. Parasitol. 45(1994) J. R. Stevens, E Mathieu-Daudé, J. J. McNamara et al.<br />
-<br />
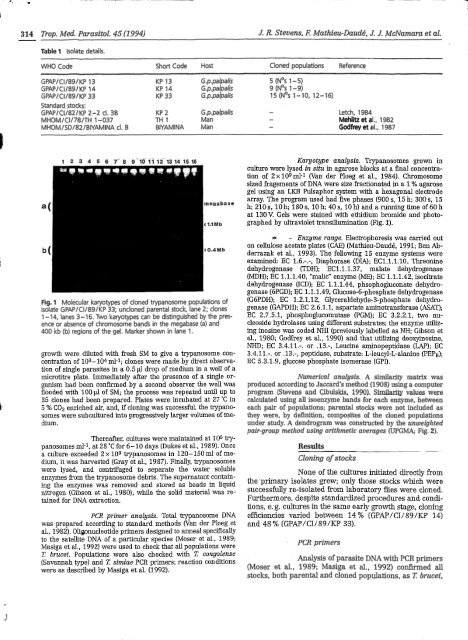
Table 1 Isolate details.<br />
WHO Code Short Code Host Cloned <strong>populations</strong> Reference<br />
GPAP/C1/89/KP 13 KP 13 G.p.<strong>palpalis</strong> 5 (Nos 1-5)<br />
GPAP/ CI /89 / KP 14 KP 14 C.p.<strong>palpalis</strong> 9 (NOS 1 -9)<br />
GPAP/C1/89/KP 33 KP 33 G.p.<strong>palpalis</strong> 15 (NOS 1-10, 12-16)<br />
Standard stocks:<br />
GPAPICII82IKP 2-2 CI. 38 KP 2 G. p. <strong>palpalis</strong> Letch, 1984<br />
MHOM/C1/78/TH 1-037 TH 1 Man -<br />
Mehlitz et al., 1982<br />
MHOM/SD/82/BIYAMINA CI. B BlYAMlNA Man -<br />
Godfrey et al., 1987<br />
b<br />
1 2 3 4 5 6 7-8 9~18111213141516<br />
megaba<br />
:l.IMb<br />
:0.4Mb<br />
Fig. 1 Molecular karyotypes <strong>of</strong> cloned trypanosome <strong>populations</strong> <strong>of</strong><br />
isolate GPAP/C1/89/KP 33; uncloned parental stock, lane 2; clones<br />
1-14, lanes 3-16. Two karyotypes can be dist<strong>in</strong>guished by the presence<br />
or absence <strong>of</strong> chromosome bands <strong>in</strong> the megabase (a) and<br />
400 kb (b) regions <strong>of</strong> the gel. Marker shown <strong>in</strong> lane 1.<br />
growth were diluted with fresh SM to give a trypanosome concentration<br />
<strong>of</strong> 103-104ml-1; clones were made by direct observation<br />
<strong>of</strong> s<strong>in</strong>gle parasites <strong>in</strong> a 0.5 J drop <strong>of</strong> medium <strong>in</strong> a well <strong>of</strong> a<br />
microtitre plate. Immediately after the presence <strong>of</strong> a s<strong>in</strong>gle organism<br />
had been confirmed by a second observer the well was<br />
flooded with 100 pl <strong>of</strong> SM; the process was repeated until up to<br />
35 clones had been prepared. Plates were <strong>in</strong>cubated at 27 ‘C <strong>in</strong><br />
5 % CO2 enriched air, and, if clon<strong>in</strong>g was successful, the trypanosomes<br />
were subcultured <strong>in</strong>to progressively larger volumes <strong>of</strong> medium.<br />
Thereafter, cultures were ma<strong>in</strong>ta<strong>in</strong>ed at 106 trypanosomes<br />
ml-1, at 28 ‘C for 6-10 days (Dukes et al., 1989). Once<br />
a culture exceeded 2 x 10⁹ trypanosomes <strong>in</strong> 120-15Oml <strong>of</strong> medium,<br />
it was harvested (Gray et al., 1987). F<strong>in</strong>ally, trypanosomes<br />
were lysed, and centrifuged to separate the water soluble<br />
enzymes from the trypanosome debris. The supernatant conta<strong>in</strong><strong>in</strong>g<br />
the enzymes was removed and stored as beads <strong>in</strong> liquid<br />
nitrogen (Gibson et al., 1980), while the solid material was reta<strong>in</strong>ed<br />
for DNA extraction.<br />
PCR primer analysis. Total trypanosome DNA<br />
was prepared accord<strong>in</strong>g to standard methods (Van der Ploeg et<br />
al., 1982). Oligonucleotide primers designed to anneal specifically<br />
to the satellite DNA <strong>of</strong> a particular species (Moser et al., 1989;<br />
Masiga et al., 1992) were used to check that all <strong>populations</strong> were<br />
i“. <strong>brucei</strong>. Populations were also checked with I: congolense<br />
(Savannah type) and I: simiae PCR primers; reaction conditions<br />
were as described by Masiga et al. (1992).<br />
Karyotype analysis. Trypanosomes grown <strong>in</strong><br />
culture were lysed <strong>in</strong> situ <strong>in</strong> agarose blocks at a Enal concentration<br />
<strong>of</strong> 2xlOgml-1 (Van der Ploeg et al., 1984). Chromosome<br />
sized fragements <strong>of</strong> DNA were size fractionated <strong>in</strong> a 1 % agarose<br />
gel us<strong>in</strong>g an LKB Pulsaphor system with a hexagonal electrode<br />
array. The program used had five phases (900 s, 15 h; 300 s, 15<br />
h; 210 s, 10 h; 180 s, 10 h; 40 s, 10 h) and a runn<strong>in</strong>g time <strong>of</strong> 60 h<br />
at 130V. Gels were sta<strong>in</strong>ed with ethidium bromide and photographed<br />
by ultraviolet transillum<strong>in</strong>ation (Fig. 1).<br />
* ,. Enzyme range. Electrophoresis was carried out<br />
on cellulose acetate plates (CAE) (Mathieu-Daudé, 1991; Ben Abderrazak<br />
et al., 1993). The follow<strong>in</strong>g 15 enzyme systems were<br />
exam<strong>in</strong>ed: EC 1.6.-.-, Diaphorase (DIA); EC1.l.l.lO, Threon<strong>in</strong>e<br />
dehydrogenase (TDH); EC1.1.1.37, malate dehydrogenase<br />
(MDH); EC 1.1.1.40, “malic” enzyme (ME); EC 1.1.1.42, isocitrate<br />
dehydrogenase OCD); EC 1.1.1.44, phsophogluconate dehydrogenase<br />
(6PGD); EC 1.1.1.49, Glucose-6-phosphate dehydrogenase<br />
(G6PDH); EC 1.2.1.12, Glyceraldehyde-3-phosphate dehydrogenase<br />
(GAPDH); EC 2.6.1.1, aspartate am<strong>in</strong>otransferase (MAT);<br />
EC 2.7.5.1, phosphoglucomutase (PGM); EC 3.2.2.1, two nucleoside<br />
hydrolases us<strong>in</strong>g different substrates; the enzyme utiliz<strong>in</strong>g<br />
<strong>in</strong>os<strong>in</strong>e was coded NHI (previously labelled as NH; Gibson et<br />
al., 1980; Godfrey et al., 1990) and that utiliz<strong>in</strong>g deoxy<strong>in</strong>os<strong>in</strong>e,<br />
NHD; EC 3.4.11.-. or .13.-, Leuc<strong>in</strong>e am<strong>in</strong>opeptidase (LAP); EC<br />
3.4.11.-. or .13.-, peptidase, substrate: L-leucyl-L-alan<strong>in</strong>e (PEP,);<br />
EC 5.3.1.9, glucose phosphate isomerase (GPI).<br />
Numerical analysis. A similarity matrix was<br />
produced accord<strong>in</strong>g to Jaccard’s method (1908) us<strong>in</strong>g a computer<br />
program (Stevens and Cibulskis, 1990). Similarity values were<br />
calculated us<strong>in</strong>g all isoenzyme bands for each enzyme, between<br />
each pair <strong>of</strong> <strong>populations</strong>; parental stocks were not <strong>in</strong>cluded as<br />
they were, by def<strong>in</strong>ition, composites <strong>of</strong> the cloned <strong>populations</strong><br />
under study. A dendrogram was constructed by the unweighted<br />
pair-group method us<strong>in</strong>g arithmetic averages (UPGMA; Fig. 2).<br />
Results<br />
Clon<strong>in</strong>g <strong>of</strong> stocks<br />
None <strong>of</strong> the cultures <strong>in</strong>itiated directly from<br />
the’primary isolates grew; only those stocks which were<br />
successfully re-isolated from laboratory flies were cloned.<br />
Furthermore, despite standardized procedures and conditions,<br />
e. g. cultures <strong>in</strong> the same early growth stage, clon<strong>in</strong>g<br />
efficiencies varied between 14 % (GPAP/CI/89/KP 14)<br />
and 48 % (GPAP/CI/89/KP 33).<br />
. PCR primers<br />
Analysis <strong>of</strong> parasite DNA with PCR primers<br />
(Moser et al., 1989; Masiga et al., 1992) confirmed all<br />
stocks, both parental and cloned <strong>populations</strong>, as I: <strong>brucei</strong>,