Genetic and Morphometric Evidence for Population Isolation of ... - IRD
Genetic and Morphometric Evidence for Population Isolation of ... - IRD
Genetic and Morphometric Evidence for Population Isolation of ... - IRD

You also want an ePaper? Increase the reach of your titles
YUMPU automatically turns print PDFs into web optimized ePapers that Google loves.
POPULATION BIOLOGY/GENETICS<br />
<strong>Genetic</strong> <strong>and</strong> <strong>Morphometric</strong> <strong>Evidence</strong> <strong>for</strong> <strong>Population</strong> <strong>Isolation</strong> <strong>of</strong><br />
Glossina palpalis gambiensis (Diptera: Glossinidae) on the<br />
Loos Isl<strong>and</strong>s, Guinea<br />
MAMADOU CAMARA, 1 HARLING CARO-RIAÑO, 2 SOPHIE RAVEL, 3 JEAN-PIERRE DUJARDIN, 2<br />
JEAN-PIERRE HERVOUET, 4 THIERRY DE MEEÜS, 2 MOISE S. KAGBADOUNO, 1<br />
JEREMY BOUYER, 5 AND PHILIPPE SOLANO 6<br />
J. Med. Entomol. 43(5): 853Ð860 (2006)<br />
ABSTRACT Allele frequencies at four microsatellite loci, <strong>and</strong> morphometric features based on 11<br />
wing l<strong>and</strong>marks, were compared among three populations <strong>of</strong> Glossina palpalis gambiensis (Diptera:<br />
Glossinidae) in Guinea. One population originated from the Loos isl<strong>and</strong>s separated from the capital<br />
Conakry by 5 km <strong>of</strong> sea, <strong>and</strong> the two others originated from the continental mangrove area close to<br />
Dubreka, these two groups being separated by 30 km. Microsatellites <strong>and</strong> wing geometry data both<br />
converged to the idea <strong>of</strong> a separation <strong>of</strong> the Loos isl<strong>and</strong> population from those <strong>of</strong> the mangrove area.<br />
Although occasional contacts cannot be excluded, our results support the hypothesis <strong>of</strong> the Loos<br />
population <strong>of</strong> tsetse ßies being a completely isolated population. This situation will favor a sequenced<br />
intervention against human African trypanosomosis <strong>and</strong> the possibility <strong>of</strong> an elimination <strong>of</strong> tsetse from<br />
this isl<strong>and</strong>.<br />
KEY WORDS<br />
Glossina palpalis, microsatellite DNA, geometric morphometrics, wings, Guinea<br />
Human African trypanosomosis (HAT, or sleeping<br />
sickness) is showing some signs <strong>of</strong> declining due to<br />
recent ef<strong>for</strong>ts on case detection <strong>and</strong> treatment, notably<br />
in Central Africa (Jannin 2005). However the<br />
situation in West Africa is much less clear, <strong>and</strong> Guinea<br />
<strong>and</strong> Côte dÕIvoire are thought to be the two countries<br />
most affected by this disease (Camara et al. 2005, Kaba<br />
et al. 2006). Guinea has a long history <strong>of</strong> sleeping<br />
sickness, which was particularly prevalent in the years<br />
1930Ð1940 (Brengues et al. 1964). Current data show<br />
prevalences up to 2Ð5% in villages <strong>of</strong> the coastal mangrove<br />
area (Dubreka focus) (Camara et al. 2005). The<br />
Loos isl<strong>and</strong>s are completely separated from this mangrove<br />
area <strong>of</strong> the mainl<strong>and</strong>. The situation <strong>of</strong> HAT in<br />
these isl<strong>and</strong>s is not currently known, but there are<br />
historical reports <strong>of</strong> the disease: in 1942, a medical<br />
survey conducted by Med. Cap. Héricord detected 30<br />
patients. In 1944, out <strong>of</strong> 1,924 inhabitants who were<br />
registered from the isl<strong>and</strong>s, 1,627 were visited, <strong>and</strong> 16<br />
cases were detected (15 on Kassa isl<strong>and</strong> <strong>and</strong> one on<br />
Fotoba isl<strong>and</strong>). After that, little in<strong>for</strong>mation has been<br />
1<br />
PNLTHA Conakry, BP 851 Guinée.<br />
2<br />
GEMI, UMR CNRS <strong>IRD</strong> 2724, centre <strong>IRD</strong> Montpellier, 911 avenue<br />
Agropolis, BP 64501, 34394 Montpellier cedex 5, France.<br />
3<br />
<strong>IRD</strong> UR 177, Laboratoire de Recherche et de Coordination sur les<br />
Trypanosomoses <strong>IRD</strong>/CIRAD, Campus de Baillarguet, 34398 Montpellier<br />
Cedex 5, France.<br />
4<br />
<strong>IRD</strong>/IRSAM, UPPA, 64000 Pau, France.<br />
5<br />
C<strong>IRD</strong>ES/CIRAD-EMVT, Bobo-Dioulasso, 01 BP 454 Burkina<br />
Faso.<br />
6<br />
C<strong>IRD</strong>ES/<strong>IRD</strong> UR 177, Bobo-Dioulasso, 01 BP 171, Burkina Faso.<br />
Corresponding author, e-mail: solano@mpl.ird.fr.<br />
available except <strong>for</strong> seven cases originating from these<br />
isl<strong>and</strong>s between 1971 <strong>and</strong> 1987; these cases were passively<br />
detected <strong>and</strong> treated in Dubreka. It is not known<br />
whether the disease was autochtonous or was imported<br />
from other localities.<br />
In West Africa, HAT is mainly transmitted by the<br />
tsetse ßy species Glossina palpalis Van der Planck<br />
(Diptera: Glossinidae). Control <strong>of</strong> tsetse can be<br />
achieved through a variety <strong>of</strong> techniques, including<br />
traps, insecticide impregnated targets, live-baits, sequential<br />
aerial spraying, <strong>and</strong> sterile male release (Cuisance<br />
et al. 1980). Generally, however, the tsetse populations<br />
then tend to recover, due to either ßies<br />
surviving the initial interventions, migrant ßies coming<br />
from untreated regions, or both. To achieve <strong>and</strong><br />
sustain local elimination <strong>of</strong> a target ßy population, it is<br />
there<strong>for</strong>e preferable to deÞne the area <strong>of</strong> intervention<br />
to include an entire panmictic ßy population, such that<br />
natural immigration from neighboring localities is <strong>of</strong><br />
low likelihood. This end is most readily achieved <strong>for</strong><br />
isolated isl<strong>and</strong> populations, as shown by the elimination<br />
<strong>of</strong> Glossina pallidipes Austin from the Isl<strong>and</strong> <strong>of</strong><br />
Principe in 1914 (Da Costa et al. 1916), <strong>and</strong> the elimination<br />
<strong>of</strong> Glossina austeni Newstead from Unguja Isl<strong>and</strong><br />
<strong>of</strong> Zanzibar in 1997 (Vreysen et al. 2000). But <strong>for</strong><br />
most mainl<strong>and</strong> populations <strong>of</strong> tsetse, the geographical<br />
limits <strong>of</strong> target tsetse populations are less easily de-<br />
Þnable. Application <strong>of</strong> population genetics techniques<br />
can reveal the existing level <strong>of</strong> population differentiation<br />
in tsetse, providing guidance on the distribution<br />
<strong>of</strong> genetically deÞned subpopulations. In essence, the<br />
0022-2585/06/0853Ð0860$04.00/0 2006 Entomological Society <strong>of</strong> America
854 JOURNAL OF MEDICAL ENTOMOLOGY Vol. 43, no. 5<br />
population genetics models are used to estimate rates<br />
<strong>of</strong> gene ßow between populations, which are taken as<br />
a surrogate <strong>for</strong> the rate <strong>of</strong> migration <strong>of</strong> individuals<br />
(Patterson <strong>and</strong> SchoÞeld 2005). Initial studies already<br />
showed evidence <strong>of</strong> strong structuring <strong>of</strong> G. palpalis<br />
populations in fragmented l<strong>and</strong>scapes (Solano et al.<br />
2000). With more detailed study, it should there<strong>for</strong>e<br />
be possible to determine key areas where tsetse control<br />
interventions can proceed with relatively low risk<br />
<strong>of</strong> reinvasion from neighboring areas.<br />
To examine the population structure <strong>of</strong> G. palpalis,<br />
we used two approaches in the current study, one<br />
approach based on genetic variation at microsatellite<br />
DNA loci <strong>and</strong> the other approach based on phenetic<br />
variation as described by the geometry <strong>of</strong> the wings.<br />
The main objective was to assess whether the tsetse<br />
population from Loos isl<strong>and</strong>s was isolated from two<br />
other populations <strong>of</strong> the mangrove area <strong>of</strong> the HAT<br />
focus <strong>of</strong> Dubreka.<br />
Materials <strong>and</strong> Methods<br />
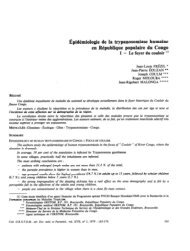
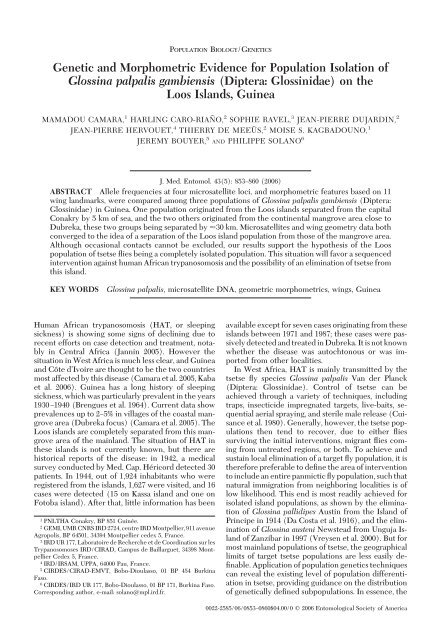
Study Area. The HAT focus <strong>of</strong> Dubreka is located<br />
45 km from Conakry, the capital <strong>of</strong> Guinea. HAT has<br />
shown incidences up to 5% in some <strong>of</strong> the visited<br />
villages from 1997 to 2005. The area is situated among<br />
the coastal mangrove, with anthropic Guinean savannah,<br />
<strong>and</strong> permanent or temporary inundated areas.<br />
Near the town <strong>of</strong> Dubreka (25,000 inhabitants), people<br />
live in villages <strong>of</strong> between 300 <strong>and</strong> 2,000 inhabitants,<br />
fragmented in many smaller localities. Main activities<br />
include Þshing, salt extraction, <strong>and</strong> agriculture<br />
(“vergers” <strong>of</strong> Elaeis guineensis, mangoes, rice, <strong>and</strong> food<br />
crops). Loos isl<strong>and</strong>s are separated from the mainl<strong>and</strong>,<br />
by 5 km <strong>of</strong> sea at the shortest distance. But the Þrst<br />
mangrove area where tsetse occur are at 20 km from<br />
these isl<strong>and</strong>s (Fig. 1).<br />
Entomological Surveys. In May 2005, six Vavoua<br />
traps (Laveissière <strong>and</strong> Grébaut 1990) were placed on<br />
Fotoba isl<strong>and</strong> (Loos isl<strong>and</strong>s), <strong>and</strong> 23 traps were placed<br />
in two mainl<strong>and</strong> localities <strong>of</strong> the littoral (Magnokhoun)<br />
<strong>and</strong> mangrove (Touguissoury) areas. These<br />
two mainl<strong>and</strong> localities are separated by 15 km, <strong>and</strong><br />
the shortest distance between them <strong>and</strong> Loos isl<strong>and</strong>s<br />
is 30 km. Cages were changed daily during 2 to 4 days,<br />
<strong>and</strong> tsetse were counted <strong>and</strong> separated by sex. From<br />
each dissected tsetse, the wings were removed <strong>and</strong> put<br />
in individual, labeled, dry Eppendorf tubes, <strong>and</strong> three<br />
legs were removed <strong>and</strong> put in individual, labeled, dry<br />
Eppendorf tubes.<br />
Microsatellite Loci. In total, 71 individuals were<br />
used <strong>for</strong> the genetic analyses at microsatellite loci: 23<br />
in Loos isl<strong>and</strong>s (14 males [M], nine females [F]), 28<br />
in Magnokhoun (14 M, 14 F), <strong>and</strong> 21 in Touguissoury<br />
(10 M, 10 F).<br />
Four microsatellite loci were analyzed: Gpg55,3<br />
(Solano et al. 1997); pgp11<strong>and</strong> pgp1 (Luna et al. 2001),<br />
<strong>and</strong> B104 (kindly provided by A. S. Robinson, IAEA,<br />
Vienna, Austria). Locus Gpg55,3 has been reported to<br />
be located on the X chromosome (Solano et al. 1997,<br />
Gooding et al. 2004), <strong>and</strong> given an absence <strong>of</strong> heterozygotes<br />
on a subsample <strong>of</strong> males (data not shown),<br />
B104 <strong>and</strong> pgp11 also were interpreted to be located on<br />
the X chromosome.<br />
To each tube containing the legs <strong>of</strong> the tsetse, 200<br />
l <strong>of</strong> 5% Chelex chelating resin was added (Walsh et<br />
al. 1991, Solano et al. 2000). After incubation at 56C<br />
<strong>for</strong> 1 h, DNA was denatured at 95C <strong>for</strong> 30 min. The<br />
tubes were then centrifuged at 12,000 g <strong>for</strong> 2 min<br />
<strong>and</strong> frozen <strong>for</strong> later analysis.<br />
The polymerase chain reaction (PCR) reactions<br />
were carried out in a thermocycler (MJ Research,<br />
Cambridge, United Kingdom) in 10-l Þnal volume,<br />
by using 1 l <strong>of</strong> the supernatant from the extraction<br />
step. After PCR ampliÞcation, allele b<strong>and</strong>s were routinely<br />
resolved on a 4,300 DNA Analysis System from<br />
LI-COR (Lincoln, NE) after migration in 96-lane reloadable<br />
(3) 6.5% denaturing polyacrylamide gels.<br />
This method allows a multiplex by the use <strong>of</strong> two<br />
infrared dyes (<strong>IRD</strong>ye), separated by 100 nm (700 <strong>and</strong><br />
800 nm), <strong>and</strong> read by a two-channel detection system<br />
that uses two separate lasers <strong>and</strong> detectors to eliminate<br />
errors due to ßuorescence overlap. To determine the<br />
different allele sizes, a large panel <strong>of</strong> 30 size markers<br />
was used. These size markers had been previously<br />
generated by cloning alleles from individual tsetse ßies<br />
into pGEM-T Easy Vector (Promega, Madison, WI).<br />
Three clones <strong>of</strong> each allele were sequenced using the<br />
T7 primer <strong>and</strong> the Big Dye Terminator Cycle Sequencing<br />
Ready Reaction kit (Applied Biosystems,<br />
Foster City, CA). Sequences were analyzed on an Applied<br />
Biosystems 310 automatic DNA sequencer, <strong>and</strong> the<br />
exact size <strong>of</strong> each cloned allele was determined. PCR<br />
products from these cloned alleles were run in the same<br />
acrylamide gel as the samples, allowing the allele size <strong>of</strong><br />
the samples to be determined accurately.<br />
Microsatellite Data Analysis. For the total sample<br />
subdivided into the three localities, WrightÕs F is<br />
(within sample heterozygote deÞciency, a measure <strong>of</strong><br />
deviation from panmixia) <strong>and</strong> F st (measure <strong>of</strong> population<br />
differentiation) were estimated using Weir <strong>and</strong><br />
CockerhamÕs unbiased estimators (f <strong>for</strong> F is , <strong>for</strong> F st )<br />
(Weir <strong>and</strong> Cockerham 1984). For r<strong>and</strong>om mating<br />
(within samples) or r<strong>and</strong>om distribution <strong>of</strong> individuals<br />
(between samples), F values are expected to be zero.<br />
When F st was measured, it was compared with F st max<br />
1 H s (Hedrick 1999, 2005).<br />
The signiÞcance <strong>of</strong> F is (deviation from panmixia) at<br />
each locus, <strong>and</strong> over all loci, also was tested separately<br />
within each sample by using 10,000 permutations <strong>of</strong><br />
alleles between individuals. Males were hemizygous at<br />
loci on the X chromosome. For these loci, measure <strong>of</strong><br />
F is <strong>and</strong> its signiÞcance were conducted only on females.<br />
The signiÞcance <strong>of</strong> F st (population differentiation)<br />
was assessed using 10,000 permutations <strong>of</strong> genotypes<br />
among samples. To evaluate signiÞcance<br />
when multiple tests were per<strong>for</strong>med, the sequential<br />
Bonferroni procedure was applied (Rice 1989).<br />
An unweighted pair-group method with arithmetic<br />
average (unweighted pair group method with arithmetic<br />
mean) dendrogram was built based on Cavalli-<br />
S<strong>for</strong>za <strong>and</strong> Edwards (1967) chord distance between<br />
the three populations. This distance is indeed the most
September 2006 CAMARA ET AL.: ISOLATION OF A TSETSE POPULATION 855<br />
Fig. 1. Geographic location <strong>of</strong> study area. The circles correspond to the three localities <strong>of</strong> the tsetse samples. L, Loos<br />
isl<strong>and</strong>s; M, Magnokhoun; <strong>and</strong> T, Touguissoury.<br />
appropriate <strong>for</strong> tree construction (Takezaki <strong>and</strong> Nei<br />
1996).<br />
<strong>Morphometric</strong>s. Out <strong>of</strong> the 71 individuals submitted<br />
to microsatellite analyses, 64 showed wings in good<br />
state <strong>for</strong> morphometric studies. Wings were drymounted<br />
between two microscope slides <strong>and</strong> scanned<br />
at 3,200 dpi. On this image, 11 l<strong>and</strong>marks deÞned by<br />
vein intersections were recorded (Fig. 2). Their coordinates<br />
were subjected to generalized Procrustes<br />
analysis (GPA) (Rohlf 1990, 1996). Centroid size<br />
(Bookstein 1991) was used to describe size changes<br />
among sexes <strong>and</strong> localities (Fig. 3).<br />
For geographic comparisons, 18 “partial warps”<br />
(PW), corresponding to 11 l<strong>and</strong>marks (Fig. 2) were<br />
computed from the right wings by using the total<br />
sample, mixing males <strong>and</strong> females: 18 individuals from<br />
Loos isl<strong>and</strong>s (10 M, 8 F), 24 from Magnokhoun (13 M,<br />
11 F), <strong>and</strong> 22 from Touguissoury (13 M, 9 F). To<br />
circumvent the problem <strong>of</strong> small sample sizes relative<br />
to the large number <strong>of</strong> variables (18 PW), the 11 Þrst<br />
“relative warps” (principal components <strong>of</strong> the PW)<br />
were used instead, representing 95% <strong>of</strong> the total<br />
shape variation. The residual allometry was estimated<br />
by multivariate regression <strong>of</strong> PW on size, on the total<br />
sample <strong>and</strong> separately in each sex, <strong>and</strong> statistical signiÞcance<br />
estimated by 1,000-runs permutation tests<br />
(Good 2000). To estimate the contribution <strong>of</strong> size<br />
variation to the geographic distinction provided by the<br />
discriminant functions, each <strong>of</strong> these was regressed on<br />
size variation (Fig. 4). The Mahalanobis distances were
856 JOURNAL OF MEDICAL ENTOMOLOGY Vol. 43, no. 5<br />
Fig. 2.<br />
Location <strong>of</strong> the 11 l<strong>and</strong>marks that were recorded <strong>for</strong> each tsetse wing.<br />
examined <strong>for</strong> signiÞcance by permutation tests (1,000<br />
runs) <strong>and</strong> used to construct an unweighted pair-group<br />
method with arithmetic average dendrogram. Based<br />
on these distances, the percentage <strong>of</strong> correctly assigned<br />
individuals was also computed <strong>for</strong> each locality.<br />
For bilateral differences, only a subset <strong>of</strong> the total<br />
sample was used (9 M, 6 F from Loos, 8 M <strong>and</strong> 5 F from<br />
Magnokhoun, <strong>and</strong> 11 M <strong>and</strong> 7 F from Touguissoury).<br />
Five l<strong>and</strong>marks could be retained (Fig. 2, see l<strong>and</strong>marks<br />
1, 3, 5, 10, <strong>and</strong> 11). To provide a better estimate<br />
<strong>of</strong> digitizing error, both wings <strong>of</strong> each individual were<br />
recorded three times (Møller <strong>and</strong> Swaddle 1997).<br />
Size asymmetry was estimated on the basis <strong>of</strong> centroid<br />
size <strong>and</strong> followed the analysis <strong>of</strong> variance<br />
(ANOVA) procedure recommended by Palmer <strong>and</strong><br />
Strobeck (1986). In the absence <strong>of</strong> signiÞcant directional<br />
asymmetry, the distribution <strong>of</strong> signed differences<br />
was examined <strong>for</strong> kurtosis to assess the existence<br />
<strong>of</strong> ßuctuating asymmetry (or reject the existence <strong>of</strong><br />
antisymmetry).<br />
S<strong>of</strong>tware. The F is <strong>and</strong> F st estimators were calculated<br />
with FSTAT version 2.9.3 s<strong>of</strong>tware (Goudet 1995).<br />
Cavalli-S<strong>for</strong>za <strong>and</strong> Edwards (1967) chord distances<br />
were computed by the GENETIX version 4 s<strong>of</strong>tware<br />
package (Laboratoire Génome et <strong>Population</strong>s, Centre<br />
National de la Recherche ScientiÞque Unité Propre de<br />
Recherche 9060, Université de Montpellier II, Montpellier,<br />
France).<br />
Collection <strong>of</strong> anatomical l<strong>and</strong>marks, GPA, multivariate<br />
analyses as well as asymmetry detection <strong>and</strong><br />
measurement were per<strong>for</strong>med using s<strong>of</strong>tware freely<br />
available at http://www.mpl.ird.fr/morphometrics<br />
(developed by J.P.D.).<br />
PHYLIP package (by J. Felsenstein, http://evolution.<br />
genetics.washington.edu/phylip.html) was used to<br />
construct the unweighted pair-group method with<br />
arithmetic average tree, <strong>and</strong> NJPLOT (http://pbil.<br />
univ-lyon1.fr) was used <strong>for</strong> tree edition (Perrière <strong>and</strong><br />
Gouy 1996).<br />
Fig. 3. Quantile plots showing in each sex the distribution <strong>of</strong> individuals along the isometric estimator <strong>of</strong> size (centroid<br />
size). Each box shows the group median separating the 25th <strong>and</strong> 75th quartiles, with the 10th <strong>and</strong> 90th quartiles shown as<br />
lines on the right <strong>and</strong> left sides <strong>of</strong> the box.
September 2006 CAMARA ET AL.: ISOLATION OF A TSETSE POPULATION 857<br />
Fig. 4. Regression <strong>of</strong> Þrst discriminant factor on centroid<br />
size. Vertical axis is the DF1, representing 84% <strong>of</strong> the total<br />
discrimination. Horizontal axis is the centroid size <strong>of</strong> the<br />
wing, in pixels. White squares, Loos (L); black squares, Magnokhoun<br />
(M); <strong>and</strong> gray squares, Touguissoury (T). Regression<br />
line is shown.<br />
Results<br />
Entomological Surveys. Of 421 tsetse (240 M, 181 F)<br />
that were trapped during the survey, all were G. p.<br />
gambiensis based on morphological characters <strong>and</strong> on<br />
geographical distribution. The apparent density (AD)<br />
averaged 4.53 tsetse per trap per day. On Loos isl<strong>and</strong>s,<br />
26 tsetse in total were caught (AD <strong>of</strong> 1.44 tsetse per<br />
trap per d), 277 were caught at Magnokhoun (AD <strong>of</strong><br />
6.15 tsetse per trap per d), <strong>and</strong> 118 at Touguissoury<br />
(AD <strong>of</strong> 4.07 tsetse per trap per d).<br />
<strong>Genetic</strong>s. From the 71 individuals analyzed, the<br />
number <strong>of</strong> alleles at each locus was 18, 13, 16, <strong>and</strong> 14<br />
<strong>for</strong> loci B104, Pgp11, Pgp1, <strong>and</strong> Gpg55,3 respectively<br />
(Table 1). The Loos sample had the lowest number <strong>of</strong><br />
alleles. Weir <strong>and</strong> Cockerham (1984) estimators indicated<br />
an overall F is <strong>of</strong> 0.15 (P 0.001) <strong>and</strong> an averaged<br />
F is per population <strong>of</strong> 0.18, 0.16, <strong>and</strong> 0.13, respectively,<br />
<strong>for</strong> Loos, Magnokhoun, <strong>and</strong> Touguissory, none <strong>of</strong><br />
these values being signiÞcant (Table 2).<br />
Overall F st averaged 0.032 (P 0.0001), indicating<br />
genetic differentiation between the three populations.<br />
When measured among the three populations taken<br />
by pairs, pairwise F st were 0.014 between Magnokhoun<br />
Table 1. Gene diversity <strong>and</strong> number <strong>of</strong> alleles sampled by locus<br />
by population<br />
Locus<br />
Gene diversity/locus/pop No. alleles sampled<br />
L M T L M T<br />
B104 0.917 0.937 0.939 8 12 12<br />
Pgp11 0.764 0.846 0.811 6 9 7<br />
Pgp1 0.918 0.926 0.833 10 12 7<br />
Gpg55,3 0.830 0.824 0.800 5 11 10<br />
L, Loos isl<strong>and</strong>s; M, Magnokhoun; <strong>and</strong> T, Touguissoury.<br />
<strong>and</strong> Touguissory, 0.032 between Loos <strong>and</strong> Magnokhoun,<br />
<strong>and</strong> 0.062 between Loos <strong>and</strong> Touguissory.<br />
Because F st between Magnokhoun <strong>and</strong> Touguissory<br />
was low <strong>and</strong> nonsigniÞcant, these two samples were<br />
mixed into one population <strong>and</strong> compared with Loos.<br />
The resulting F st was 0.057 (highly signiÞcant, P <br />
0.0001).<br />
Because H s was 0.832, F st max 1 H s was 0.168, <strong>and</strong><br />
our maximum F st value was 0.057. A st<strong>and</strong>ardized estimate<br />
<strong>of</strong> F st would thus give F st’ F st /F st max 0.34.<br />
Should this value have been close to 1, a complete lack<br />
<strong>of</strong> migrant would have been supported. The lower<br />
value (0.34) suggests that either there are migrants, or<br />
there have been migrants in the past <strong>and</strong> the separated<br />
populations did not yet reach equilibrium. If equilibrium<br />
is assumed in a two isl<strong>and</strong> model, then the corresponding<br />
number <strong>of</strong> migrants would be Nm (1 <br />
F ST )/8F ST , which would give, with our “st<strong>and</strong>ardized”<br />
measure <strong>of</strong> F ST ,Nm 0.24 migrant per generation or<br />
one migrant every four generations.<br />
<strong>Morphometric</strong>s. A strong sexual dimorphism <strong>for</strong><br />
size was disclosed in each locality, in favor <strong>of</strong> females<br />
(Fig. 3). Size variation was not signiÞcant between<br />
localities.<br />
The multivariate regression <strong>of</strong> PW on size was signiÞcant<br />
on the total sample, mixing males <strong>and</strong> females<br />
(1,000 runs, P 0.0040), but it was not signiÞcant<br />
within each sex (1,000 runs, P 0.508 in males <strong>and</strong> P <br />
0.083 in females). This suggests that allometric effects<br />
were mainly due do sexual size dimorphism.<br />
The Þrst discriminant function (DF1, 84% <strong>of</strong> the<br />
total variation) clearly separated the Loos population<br />
from the other two populations (Fig. 4), whereas these<br />
latter populations were slightly separated by the second<br />
discriminant function (DF2, 16% <strong>of</strong> the total variation).<br />
Comparing ßies from Loos isl<strong>and</strong>s with the<br />
group <strong>for</strong>med by ßies from Magnokhoun <strong>and</strong> Touguissory,<br />
the reclassiÞcation scores were 77% <strong>for</strong> Loos<br />
<strong>and</strong> 91% <strong>for</strong> mainl<strong>and</strong> group. Size contribution to the<br />
geographic separation provided by DF1 was not signiÞcant<br />
(Fig. 4; r 2 0.001, P 0.05).<br />
Bilateral differences <strong>of</strong> centroid size showed distinct<br />
patterns in males <strong>and</strong> females, varying with geography.<br />
In females, directional <strong>and</strong> nondirectional<br />
asymmetries were found to be signiÞcant <strong>for</strong> the Loos<br />
population only. This suggests that nondirectional<br />
asymmetry on the isl<strong>and</strong> was antisymmetry, although<br />
kurtosis could not be detected. In females <strong>of</strong> the continental<br />
area as well as in males from the three localities,<br />
nondirectional (but no directional) asymmetry<br />
was detected, at a slightly higher amount in males<br />
(Table 3), <strong>and</strong> no kurtosis was detected in the distri-<br />
Table 2.<br />
F is per locus per population<br />
Locus<br />
F is /locus/pop<br />
P value (0.05 level)<br />
L M T L M T<br />
B104 0.377 0.161 0.065 0.02 0.05 1.00<br />
Pgp11 0.127 0.071 0.137 0.40 0.39 0.32<br />
Pgp1 0.109 0.064 0.333 0.20 0.36 0.04<br />
Gpg55,3 0.097 0.353 0.125 0.42 0.0042 0.28<br />
Total 0.182 0.159 0.126 0.017 0.013 0.013
858 JOURNAL OF MEDICAL ENTOMOLOGY Vol. 43, no. 5<br />
Table 3.<br />
populations<br />
Left-right comparisons between the three tsetse<br />
Directional<br />
asymmetry<br />
Nondirectional<br />
asymmetry<br />
Females<br />
Loos 34** 20**<br />
Magnokhoun ns 8*<br />
Touguissoury ns 8*<br />
Males<br />
Loos ns 16**<br />
Magnokhoun ns 16**<br />
Touguissoury ns 29**<br />
Values are mean squares (MS) <strong>of</strong> an ANOVA output with individuals,<br />
side <strong>and</strong> their interaction as effects, <strong>and</strong> centroid size as dependent<br />
variable. ns, not signiÞcant (value not shown).**, P 0.00001;<br />
*, P 0.0010.<br />
bution <strong>of</strong> signed differences. These results were compatible<br />
with ßuctuating asymmetry in males <strong>and</strong> in<br />
females, although the nondirectional asymmetry in<br />
the isl<strong>and</strong> females suggest antisymmetry as the cause<br />
<strong>of</strong> their nondirectional asymmetry.<br />
Classification Trees. The Mahalanobis distances<br />
(Dm) derived from shape variation <strong>of</strong> the wings <strong>of</strong> the<br />
three populations were signiÞcant only when comparing<br />
the Loos population with Magnokhoun (Dm <br />
1.82, P 0.014) or Touguissory (Dm 2.30, P <br />
0.001), so that the resulting unweighted pair-group<br />
method with arithmetic average tree produced a pattern<br />
isolating the tsetse from the isl<strong>and</strong> <strong>and</strong> grouping<br />
the tsetse from the mangrove localities (Dm 1.09,<br />
P 0.450) (Fig. 5, left). The unweighted pair-group<br />
method with arithmetic average tree based on the<br />
Cavalli-S<strong>for</strong>za <strong>and</strong> Edwards chord distances (D cve )at<br />
microsatellite loci between the three populations gave<br />
similar branching (Fig. 5, right), <strong>and</strong> signiÞcant values<br />
were again found only when comparing the Loos population<br />
with populations <strong>of</strong> the mainl<strong>and</strong> (1,000 permutations,<br />
D cve 0.13, P 0.001 between Loos <strong>and</strong><br />
Magnokhoun; D cve 0.140, P 0.002 between Loos<br />
<strong>and</strong> Touguissory; <strong>and</strong> D cve 0.085, P 0.141 between<br />
Magnokhoun <strong>and</strong> Touguissory).<br />
Discussion<br />
This study was undertaken to explore the population<br />
structure <strong>of</strong> G. p. gambiensis, the main tsetse<br />
species found in the very active HAT focus <strong>of</strong><br />
Dubreka, Republic <strong>of</strong> Guinea. We feel that knowing<br />
the genetic structure <strong>of</strong> a vector population is useful<br />
<strong>for</strong> underst<strong>and</strong>ing an epidemic <strong>and</strong> will contribute to<br />
a rational control operation. Adapted tools are genetic<br />
markers like microsatellite DNA markers (Jarne <strong>and</strong><br />
Lagoda 1996), which have proven successful <strong>for</strong> population<br />
studies <strong>of</strong> many arthropod species, including<br />
insect vectors (Lanzaro et al. 1995, de Meeüs etal.<br />
2002) <strong>and</strong> tsetse (Solano et al. 1999, Gooding <strong>and</strong><br />
Krafsur 2005). In the current study, the use <strong>of</strong> morphometrics<br />
was explored as a complementary, lowcost<br />
tool, to get in<strong>for</strong>mation on population structure<br />
(Dujardin <strong>and</strong> Slice 2006). Thus, allele frequencies at<br />
four microsatellite loci, <strong>and</strong> morphometric features<br />
based on 11 wing l<strong>and</strong>marks, were compared among<br />
three populations <strong>of</strong> G. p. gambiensis, one originating<br />
from an isl<strong>and</strong> located 5 km from the capital Conakry,<br />
<strong>and</strong> the two others from the continent in the HAT<br />
focus <strong>of</strong> Dubreka, these two groups being separated by<br />
30 km.<br />
The number <strong>of</strong> traps (six in Loos isl<strong>and</strong>s, a total <strong>of</strong><br />
23 in the two other localities) <strong>and</strong> the time during<br />
which they were left (between 2 <strong>and</strong> 4 d) do not allow<br />
comparison <strong>of</strong> tsetse densities between localities. It<br />
may explain the limited number <strong>of</strong> individuals <strong>of</strong> sample<br />
L available <strong>for</strong> genetic <strong>and</strong> morphometric comparisons.<br />
Adapted statistics were used based on nonparametric<br />
tests.<br />
Overall, <strong>and</strong> within each <strong>of</strong> the three populations,<br />
F is values were positive, indicating within population<br />
heterozygote deÞciency. We attributed this apparent<br />
heterozygote deÞciency mainly to the occurrence <strong>of</strong><br />
null alleles, as suspected by the high variance <strong>of</strong> F is<br />
values among loci <strong>for</strong> each population, <strong>and</strong> as it has<br />
previously been reported in tsetse (S.R., unpublished<br />
data). Thus, we assume that there was r<strong>and</strong>om mating<br />
within each population.<br />
Fig. 5. Unweighted pair-group method with arithmetic average tree on genetic distances based on wing morphometry<br />
(on the left, Mahalanobis distance) <strong>and</strong> on microsatellite DNA loci (on the right, Cavalli-S<strong>for</strong>za <strong>and</strong> Edwards distance) <strong>of</strong><br />
the three tsetse populations.
September 2006 CAMARA ET AL.: ISOLATION OF A TSETSE POPULATION 859<br />
The F st value measured among the three populations<br />
was positive <strong>and</strong> signiÞcant, indicating genetic<br />
differentiation among the three populations. Pairwise<br />
Cavalli-S<strong>for</strong>za <strong>and</strong> Edwards chord distances always<br />
distinguished the sample from Loos isl<strong>and</strong>s from the<br />
two other samples, whereas this same distance was the<br />
lowest <strong>and</strong> was not signiÞcant when measured between<br />
the two samples from the mangrove. When the<br />
two mainl<strong>and</strong> populations were grouped <strong>and</strong> compared<br />
with the those from the isl<strong>and</strong>, F st value was<br />
nearly 2 times higher (0.057) than the value comparing<br />
the three populations (0.032). Taking into account<br />
the high degree <strong>of</strong> polymorphism <strong>of</strong> our microsatellite<br />
loci, <strong>and</strong> using the suggestion <strong>of</strong> Hedrick (1999, 2005)<br />
<strong>for</strong> a st<strong>and</strong>ardized estimate (F st’ F st /F st max with<br />
F st max F st /(1 H s ) provided a corrected estimate<br />
<strong>of</strong> 0.34. Despite being relatively high, this upper bound<br />
seems far from 1, suggesting that either there are some<br />
migrants (e.g., one effective migrant each four generations),<br />
or there have been migrants in the past, <strong>and</strong><br />
the separated populations did not yet reach equilibrium.<br />
According to markÐrecapture experiments on<br />
G. palpalis (Cuisance et al. 1985, Bouyer et al. 2007),<br />
ßies should be able to reach a distance <strong>of</strong> 30 km if the<br />
populations had been separated by homogeneous riverine<br />
<strong>for</strong>est. But given the geographic location <strong>of</strong> our<br />
study, it seems unlikely <strong>for</strong> them to actively disperse<br />
from the isl<strong>and</strong>s to the mangrove or vice versa. However,<br />
passive transport by the numerous boats in the<br />
area cannot be ruled out. Our working hypothesis is<br />
that tsetse from the mangrove colonized the Loos<br />
isl<strong>and</strong>s probably by passive transport, <strong>and</strong> probably at<br />
the time when the isl<strong>and</strong>s harbored important economic<br />
activities such as the bauxite exploitation, <strong>and</strong><br />
the Conakry peninsula harbored natural mangrove<br />
vegetation. The frequency <strong>of</strong> passive tsetse exchanges<br />
probably dropped with the regression <strong>of</strong> economic<br />
activities <strong>and</strong> the degradation <strong>of</strong> this vegetation. According<br />
to that hypothesis, both low migration rates<br />
<strong>and</strong> small population sizes would have contributed to<br />
the observed genetic differentiation.<br />
Metric properties are under the inßuence <strong>of</strong> both<br />
environmental <strong>and</strong> genetic factors, <strong>and</strong> as continuous<br />
traits they are among the earliest characters to change<br />
between physically separated populations (Falconer<br />
1981). Environment typically acts primarily on size<br />
(Glasgow 1961) <strong>and</strong> then on shape, frequently as an<br />
allometric effect <strong>of</strong> size change (Dujardin <strong>and</strong> Le Pont<br />
2004). The three populations were not distinct on the<br />
base <strong>of</strong> size, but they could be discriminated by shape<br />
variation. In our data, although some residual allometry<br />
was found due to sexual dimorphism typical <strong>of</strong><br />
tsetse species (Sané et al. 2000, de La Rocque et al.<br />
2002), no allometric effect was detected to explain the<br />
shape discrimination between isl<strong>and</strong> <strong>and</strong> mainl<strong>and</strong><br />
populations. Pure shape differences among conspeciÞc<br />
populations are more likely to result from adaptive<br />
or genetic causes than from environmental effects<br />
(Dujardin <strong>and</strong> Slice 2006). This interpretation <strong>of</strong> metric<br />
variation was supported by the detection <strong>of</strong> directional<br />
asymmetry (<strong>and</strong> possibly antisymmetry) only in<br />
the isl<strong>and</strong> population, although limited to the females.<br />
Directional asymmetry is a heritable trait very common<br />
in Diptera (Klingenberg et al. 1998), <strong>and</strong> the<br />
Þnding <strong>of</strong> intraspeciÞc variability in this trait also suggests<br />
genetic differences.<br />
Data from microsatellites <strong>and</strong> from wing geometry<br />
both converged to the idea <strong>of</strong> a separation <strong>of</strong> the Loos<br />
isl<strong>and</strong> population from the mainl<strong>and</strong>. The level <strong>of</strong><br />
separation in terms <strong>of</strong> number <strong>of</strong> migrants per generation<br />
seems high, which con<strong>for</strong>ms to the known dispersing<br />
behavior <strong>of</strong> the insect. Although occasional<br />
contacts cannot be excluded, our working hypothesis<br />
is that the Loos population <strong>of</strong> tsetse ßies is a completely<br />
isolated population. If true, this situation will<br />
favor control interventions, with the possibility <strong>of</strong><br />
eliminating tsetse from this isl<strong>and</strong>.<br />
Acknowledgments<br />
We acknowledge collaboration from the Ministry <strong>of</strong><br />
Health <strong>of</strong> Guinea, <strong>and</strong> thank A. S. Robinson <strong>for</strong> kindly providing<br />
G. palpalis microsatellite DNA sequences. This work<br />
was supported by the Leverhulme Trust Tsetse Research<br />
Network, Ministère des Affaires Etrangères <strong>of</strong> France, EU<br />
INCO-DEV project n031849, <strong>and</strong> Institut de Recherche<br />
pour le Développement.<br />
References Cited<br />
Bookstein, F. L. 1991. <strong>Morphometric</strong> tools <strong>for</strong> l<strong>and</strong>mark<br />
data: geometry <strong>and</strong> biology. Cambridge University Press,<br />
New York.<br />
Bouyer, J., A. Sibert, M. Desquesnes, D. Cuisance, <strong>and</strong> S. de La<br />
Rocque. 2007. A model <strong>of</strong> diffusion <strong>of</strong> Glossina palpalis<br />
gambiensis (Diptera: Glossinidae) in Burkina Faso. In M.J.B.<br />
Vreysen, A. S. Robinson, <strong>and</strong> J. Hendrichs [eds.], Area-wide<br />
Control <strong>of</strong> Insect Pests. From Research to Field Implementation.<br />
Springer, Dordrecht, The Netherl<strong>and</strong>s. (in press).<br />
Brengues, J., A. Challier, <strong>and</strong> V. K. Ouedraogo. 1964. Contribution<br />
à la connaissance de lÕépidémiologie de la<br />
trypanosomiase humaine: enquête entomologique dans<br />
les territoires kissis et limitrophes (avril-mai 1964: Sierra-<br />
Leone, Libéria, Guinée). OCCGE Eds, Bobo-Dioulasso,<br />
Burkina Faso.<br />
Camara, M., D. Kaba, M. Kagbadouno, J. R. Sanon, F. Ouendeno,<br />
<strong>and</strong> P. Solano. 2005. La Trypanosomose Humaine<br />
Africaine en zone de mangrove en Guinée: caractéristiques<br />
épidémiologiques et cliniques de deux foyers<br />
voisins. Méd. Trop. 65: 155Ð161.<br />
Cavalli-S<strong>for</strong>za, L. L., <strong>and</strong> A.W.F. Edwards. 1967. Phylogenetic<br />
analysis: model <strong>and</strong> estimation procedures. Am. J.<br />
Hum. Genet. 19: 233Ð257.<br />
Cuisance, D., H. Politzar, J. Fevrier, G. Bourdoiseau, <strong>and</strong><br />
E. Sellin. 1980. Association dÕun traitement insecticide<br />
avec la méthode du mâle stérile contre Glossina palpalis<br />
gambiensis: intérêt de la mise en Ïuvre de plusieurs<br />
méthodes. Rev. Elev. Méd. Vét. Pays Trop. 33: 127Ð133.<br />
Cuisance, D., J. Fevrier, J. Dejardin, <strong>and</strong> J. Filledier. 1985.<br />
Dispersion linéaire de Glossina palpalis gambiensis et.<br />
G. tachinoides dans une galerie <strong>for</strong>estière en zone<br />
soudano-guinéenne. Rev. Elev. Méd. Vét. Pays Trop. 38:<br />
153Ð172.<br />
Da Costa, B.F.P., J. F. Sant’anna, A. C. Santos, <strong>and</strong> M.G.A.<br />
Alvares. 1916. Sleeping sickness, a record <strong>of</strong> four years<br />
war against it in Principe, PortugueseWest Africa. Ballière,<br />
Tindall & Cox, London, United Kingdom.<br />
de La Rocque, S., B. Ge<strong>of</strong>froy, J. F. Michel, F. Borne,<br />
P. Solano, J. Y. Meunier, <strong>and</strong> D. Cuisance. 2002. Les ailes
860 JOURNAL OF MEDICAL ENTOMOLOGY Vol. 43, no. 5<br />
de glossines, une carte dÕidentité de lÕinsecte? Parasite<br />
9: 275Ð281.<br />
de Meeüs, T., L. Beati, C. Delaye, A. Aeschlimann, <strong>and</strong><br />
F. Renaud. 2002. Sex biased genetic structure in the vector<br />
<strong>of</strong> Lyme disease, Ixodes ricinus. Evolution 56: 1802Ð1807.<br />
Dujardin, J. P., <strong>and</strong> F. Le Pont. 2004. Geographic variation<br />
in Neotropical s<strong>and</strong>ßies. Infect. Genet. Evol. 4: 353Ð359.<br />
Dujardin, J. P., <strong>and</strong> D. Slice. 2006. Contributions <strong>of</strong> morphometrics<br />
to medical entomology. Chapter 24. In<br />
M. Tibayrenc [ed.], Encyclopedia <strong>of</strong> infectious diseases:<br />
modern methodologies. Wiley, New York.<br />
Falconer, D. S. 1981. Introduction to quantitative genetics.<br />
Longman, London, United Kingdom.<br />
Glasgow, J. P. 1961. Selection <strong>for</strong> size in tsetse ßies. J. Anim.<br />
Ecol. 30: 87Ð94.<br />
Good, P. 2000. Permutation tests: a practical guide to resampling<br />
methods <strong>for</strong> testing hypotheses. Springer, New York.<br />
Gooding, R. H., P. Solano, <strong>and</strong> S. Ravel. 2004. X chromosome<br />
mapping experiments suggest occurrence <strong>of</strong><br />
cryptic species in the tsetse ßy, Glossina palpalis palpalis<br />
(Diptera: Glossinidae). Can. J. Zool. 82: 1902Ð1909.<br />
Gooding, R. H., <strong>and</strong> E. S. Krafsur. 2005. Tsetse genetics:<br />
contributions to biology, systematics, <strong>and</strong> control <strong>of</strong><br />
tsetse ßies. Annu. Rev. Entomol. 50: 101Ð123.<br />
Hedrick, P. W. 1999. Perspective: highly variable loci <strong>and</strong><br />
their interpretation in evolution <strong>and</strong> conservation. Evolution<br />
53: 313Ð318.<br />
Hedrick, P. W. 2005. A st<strong>and</strong>ardized genetic differentiation<br />
measure. Evolution 59: 1633Ð1638.<br />
Goudet, J. 1995. FSTAT (version 1.2): a computer program<br />
to calculate F-statistics. J. Hered. 86: 485Ð486.<br />
Jannin, J. G. 2005. Sleeping sickness-a growing problem? Br.<br />
Med. J. 331: 1242.<br />
Jarne, P., <strong>and</strong> P.J.J. Lagoda. 1996. Microsatellites, from molecules<br />
to populations <strong>and</strong> back. Trends Ecol. Evol. 11:<br />
424Ð429.<br />
Kaba, D., N. N. Dje, F. Courtin, E. Oke, M. K<strong>of</strong>fi, A. Garcia,<br />
V. Jamonneau, <strong>and</strong> P. Solano. 2006. LÕimpact de la<br />
guerre sur lÕévolution de la THA dans le Centre-Ouest de<br />
la Côte dÕIvoire. Trop. Med. Int. Health 11: 136Ð143.<br />
Lanzaro, G., L. Zheng, Y. Toure, S. F. Traore, F. C. Kafatos,<br />
<strong>and</strong> K. D. Vernick. 1995. Microsatellite DNA <strong>and</strong><br />
isozyme variability in a West African population <strong>of</strong><br />
Anopheles gambiae. Insect Mol. Biol. 4: 105Ð112.<br />
Laveissière, C., <strong>and</strong> P. Grébaut. 1990. Recherches sur les<br />
pièges à glossines. Mise au point dÕun modèle économique:<br />
le piège “Vavoua”. Trop. Med. Parasitol. 41: 185Ð192.<br />
Luna, C., M. Bonizzoni, Q. Cheng, S. Aksoy, <strong>and</strong> L. Zheng.<br />
2001. Microsatellite polymorphism in the tsetse ßies<br />
(Diptera: Glossinidae). J. Med. Entomol. 38: 376Ð381.<br />
Møller A. P., <strong>and</strong> J. P. Swaddle. 1997. Asymmetry, developmental<br />
stability, <strong>and</strong> evolution. Ox<strong>for</strong>d University Press,<br />
New York.<br />
Klingenberg, C. P., G. S. McIntyre, <strong>and</strong> S. D. Zaklan. 1998.<br />
Left-right asymmetry <strong>of</strong> ßy wings <strong>and</strong> the evolution <strong>of</strong><br />
body axes. Proc. R. Soc. Lond. B 265: 1255Ð1259.<br />
Palmer, A. R., <strong>and</strong> C. Strobeck. 1986. Fluctuating asymmetry:<br />
measurement, analysis, patterns. Annu. Rev. Ecol.<br />
Syst. 17: 391Ð421.<br />
Patterson, J. S., <strong>and</strong> C. J. Sch<strong>of</strong>ield. 2005. Preliminary study<br />
<strong>of</strong> wing morphometry in relation to tsetse population<br />
genetics. South Afr. J. Sci. 101: 1Ð3.<br />
Perrière, G., <strong>and</strong> M. Gouy. 1996. www-query: an on-line<br />
retrieval system <strong>for</strong> biological sequence banks. Biochimie<br />
78: 364Ð369.<br />
Rice, W. R. 1989. Analyzing tables <strong>of</strong> statistical tests. Evolution<br />
43: 223Ð225.<br />
Rohlf, F. J. 1990. Rotational Þt (Procrustes) methods,<br />
pp. 227Ð236. In F. J. Rohlf <strong>and</strong> F. L. Bookstein [eds.],<br />
Proceedings <strong>of</strong> the Michigan <strong>Morphometric</strong>s Workshop.<br />
University <strong>of</strong> Michigan Museums, Ann Arbor, MI.<br />
Rohlf, F. J. 1996. <strong>Morphometric</strong> spaces, shape components<br />
<strong>and</strong> the effects <strong>of</strong> linear trans<strong>for</strong>mations, pp. 117Ð129. In<br />
L. F. Marcus, M. Corti, A. Loy, G.J.P. Naylor, <strong>and</strong> D. Slice<br />
[eds.], Advances in morphometrics. Proceedings <strong>of</strong> the<br />
1993 NATO-ASI on <strong>Morphometric</strong>s NATO ASI, Series A,<br />
Life Sciences. Plenum, New York.<br />
Sané, B., P. Solano, A. Garcia, F. Fournet, <strong>and</strong> C. Laveissière.<br />
2000. Variations intraspéciÞques de la taille des ailes et<br />
du thorax chez. Glossina palpalis palpalis en zone <strong>for</strong>estière<br />
de Côte dÕIvoire. Rev. Elev. Méd. Vét. Pays Trop. 53:<br />
245Ð248.<br />
Solano, P., G. Duvallet, V. Dumas, D. Cuisance, <strong>and</strong> G. Cuny.<br />
1997. Microsatellite markers <strong>for</strong> genetic population studies<br />
in Glossina palpalis (Diptera: Glossinidae). Acta Trop.<br />
65: 175Ð180.<br />
Solano, P., S. de La Rocque, D. Cuisance, B. Ge<strong>of</strong>froy, T. de<br />
Meeüs, G. Cuny, <strong>and</strong> G. Duvallet. 1999. IntraspeciÞc<br />
variability in natural populations <strong>of</strong> Glossina palpalis gambiensis<br />
from West Africa, revealed by genetic <strong>and</strong> morphometric<br />
analyses. Med. Vet. Entomol. 13: 401Ð407.<br />
Solano, P., S. de La Rocque, T. de Meeüs, G. Cuny, G.<br />
Duvallet, <strong>and</strong> D. Cuisance. 2000. Microsatellite DNA<br />
markers reveal genetic differentiation among populations<br />
<strong>of</strong> Glossina palpalis gambiensis collected in the agropastoral<br />
zone <strong>of</strong> Sideradougou, Burkina Faso. Insect Mol.<br />
Biol. 9: 433Ð439.<br />
Takezaki, N., <strong>and</strong> M. Nei. 1996. <strong>Genetic</strong> distances <strong>and</strong> reconstruction<br />
<strong>of</strong> phylogenetic trees from microsatellite<br />
DNA. <strong>Genetic</strong>s 144: 389Ð399.<br />
Vreysen M.J.B., K. M. Saleh, M. Y. Ali, M. A. Abdullah,<br />
Z. R. Zhu, K. G. Juma, V. A. Dyck, A. R. Masangi,<br />
P. M. Mkonyi, <strong>and</strong> H. U. Feldmann. 2000. Glossina austeni<br />
(Diptera: Glossinidae) eradicated on the Isl<strong>and</strong> <strong>of</strong><br />
Unguja, Zanzibar, using the sterile insect technique. J.<br />
Econ. Entomol. 93: 123Ð135.<br />
Walsh, P. S., D. A. Metzger, <strong>and</strong> R. Higuchi. 1991. Chelex<br />
100 as a medium <strong>for</strong> simple extraction <strong>of</strong> DNA <strong>for</strong> PCRbased<br />
typing from <strong>for</strong>ensic material. Biotechniques 10:<br />
506Ð513.<br />
Weir, B. S., <strong>and</strong> W. C. Cockerham. 1984. Estimating F-statistics<br />
<strong>for</strong> the analysis <strong>of</strong> populations structure. Evolution<br />
38: 1358Ð1370.<br />
Received 18 April 2006; accepted 29 May 2006.