Genetic and Morphometric Evidence for Population Isolation of ... - IRD
Genetic and Morphometric Evidence for Population Isolation of ... - IRD
Genetic and Morphometric Evidence for Population Isolation of ... - IRD

You also want an ePaper? Increase the reach of your titles
YUMPU automatically turns print PDFs into web optimized ePapers that Google loves.
856 JOURNAL OF MEDICAL ENTOMOLOGY Vol. 43, no. 5<br />
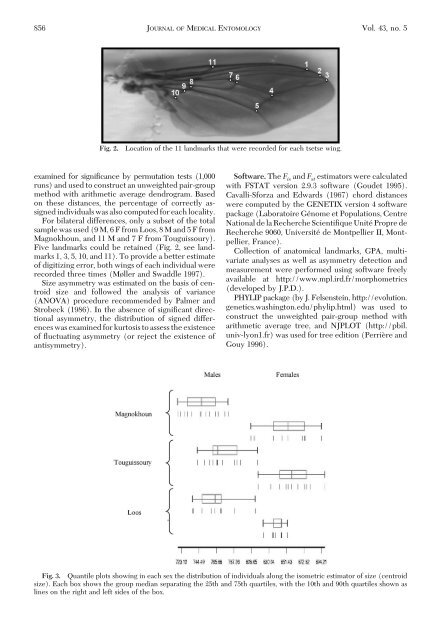
Fig. 2.<br />
Location <strong>of</strong> the 11 l<strong>and</strong>marks that were recorded <strong>for</strong> each tsetse wing.<br />
examined <strong>for</strong> signiÞcance by permutation tests (1,000<br />
runs) <strong>and</strong> used to construct an unweighted pair-group<br />
method with arithmetic average dendrogram. Based<br />
on these distances, the percentage <strong>of</strong> correctly assigned<br />
individuals was also computed <strong>for</strong> each locality.<br />
For bilateral differences, only a subset <strong>of</strong> the total<br />
sample was used (9 M, 6 F from Loos, 8 M <strong>and</strong> 5 F from<br />
Magnokhoun, <strong>and</strong> 11 M <strong>and</strong> 7 F from Touguissoury).<br />
Five l<strong>and</strong>marks could be retained (Fig. 2, see l<strong>and</strong>marks<br />
1, 3, 5, 10, <strong>and</strong> 11). To provide a better estimate<br />
<strong>of</strong> digitizing error, both wings <strong>of</strong> each individual were<br />
recorded three times (Møller <strong>and</strong> Swaddle 1997).<br />
Size asymmetry was estimated on the basis <strong>of</strong> centroid<br />
size <strong>and</strong> followed the analysis <strong>of</strong> variance<br />
(ANOVA) procedure recommended by Palmer <strong>and</strong><br />
Strobeck (1986). In the absence <strong>of</strong> signiÞcant directional<br />
asymmetry, the distribution <strong>of</strong> signed differences<br />
was examined <strong>for</strong> kurtosis to assess the existence<br />
<strong>of</strong> ßuctuating asymmetry (or reject the existence <strong>of</strong><br />
antisymmetry).<br />
S<strong>of</strong>tware. The F is <strong>and</strong> F st estimators were calculated<br />
with FSTAT version 2.9.3 s<strong>of</strong>tware (Goudet 1995).<br />
Cavalli-S<strong>for</strong>za <strong>and</strong> Edwards (1967) chord distances<br />
were computed by the GENETIX version 4 s<strong>of</strong>tware<br />
package (Laboratoire Génome et <strong>Population</strong>s, Centre<br />
National de la Recherche ScientiÞque Unité Propre de<br />
Recherche 9060, Université de Montpellier II, Montpellier,<br />
France).<br />
Collection <strong>of</strong> anatomical l<strong>and</strong>marks, GPA, multivariate<br />
analyses as well as asymmetry detection <strong>and</strong><br />
measurement were per<strong>for</strong>med using s<strong>of</strong>tware freely<br />
available at http://www.mpl.ird.fr/morphometrics<br />
(developed by J.P.D.).<br />
PHYLIP package (by J. Felsenstein, http://evolution.<br />
genetics.washington.edu/phylip.html) was used to<br />
construct the unweighted pair-group method with<br />
arithmetic average tree, <strong>and</strong> NJPLOT (http://pbil.<br />
univ-lyon1.fr) was used <strong>for</strong> tree edition (Perrière <strong>and</strong><br />
Gouy 1996).<br />
Fig. 3. Quantile plots showing in each sex the distribution <strong>of</strong> individuals along the isometric estimator <strong>of</strong> size (centroid<br />
size). Each box shows the group median separating the 25th <strong>and</strong> 75th quartiles, with the 10th <strong>and</strong> 90th quartiles shown as<br />
lines on the right <strong>and</strong> left sides <strong>of</strong> the box.