Genetic and Morphometric Evidence for Population Isolation of ... - IRD
Genetic and Morphometric Evidence for Population Isolation of ... - IRD
Genetic and Morphometric Evidence for Population Isolation of ... - IRD

You also want an ePaper? Increase the reach of your titles
YUMPU automatically turns print PDFs into web optimized ePapers that Google loves.
September 2006 CAMARA ET AL.: ISOLATION OF A TSETSE POPULATION 855<br />
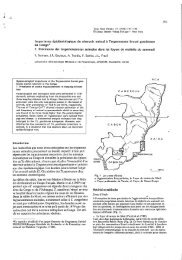
Fig. 1. Geographic location <strong>of</strong> study area. The circles correspond to the three localities <strong>of</strong> the tsetse samples. L, Loos<br />
isl<strong>and</strong>s; M, Magnokhoun; <strong>and</strong> T, Touguissoury.<br />
appropriate <strong>for</strong> tree construction (Takezaki <strong>and</strong> Nei<br />
1996).<br />
<strong>Morphometric</strong>s. Out <strong>of</strong> the 71 individuals submitted<br />
to microsatellite analyses, 64 showed wings in good<br />
state <strong>for</strong> morphometric studies. Wings were drymounted<br />
between two microscope slides <strong>and</strong> scanned<br />
at 3,200 dpi. On this image, 11 l<strong>and</strong>marks deÞned by<br />
vein intersections were recorded (Fig. 2). Their coordinates<br />
were subjected to generalized Procrustes<br />
analysis (GPA) (Rohlf 1990, 1996). Centroid size<br />
(Bookstein 1991) was used to describe size changes<br />
among sexes <strong>and</strong> localities (Fig. 3).<br />
For geographic comparisons, 18 “partial warps”<br />
(PW), corresponding to 11 l<strong>and</strong>marks (Fig. 2) were<br />
computed from the right wings by using the total<br />
sample, mixing males <strong>and</strong> females: 18 individuals from<br />
Loos isl<strong>and</strong>s (10 M, 8 F), 24 from Magnokhoun (13 M,<br />
11 F), <strong>and</strong> 22 from Touguissoury (13 M, 9 F). To<br />
circumvent the problem <strong>of</strong> small sample sizes relative<br />
to the large number <strong>of</strong> variables (18 PW), the 11 Þrst<br />
“relative warps” (principal components <strong>of</strong> the PW)<br />
were used instead, representing 95% <strong>of</strong> the total<br />
shape variation. The residual allometry was estimated<br />
by multivariate regression <strong>of</strong> PW on size, on the total<br />
sample <strong>and</strong> separately in each sex, <strong>and</strong> statistical signiÞcance<br />
estimated by 1,000-runs permutation tests<br />
(Good 2000). To estimate the contribution <strong>of</strong> size<br />
variation to the geographic distinction provided by the<br />
discriminant functions, each <strong>of</strong> these was regressed on<br />
size variation (Fig. 4). The Mahalanobis distances were