Genetic and Morphometric Evidence for Population Isolation of ... - IRD
Genetic and Morphometric Evidence for Population Isolation of ... - IRD
Genetic and Morphometric Evidence for Population Isolation of ... - IRD

Create successful ePaper yourself
Turn your PDF publications into a flip-book with our unique Google optimized e-Paper software.
854 JOURNAL OF MEDICAL ENTOMOLOGY Vol. 43, no. 5<br />
population genetics models are used to estimate rates<br />
<strong>of</strong> gene ßow between populations, which are taken as<br />
a surrogate <strong>for</strong> the rate <strong>of</strong> migration <strong>of</strong> individuals<br />
(Patterson <strong>and</strong> SchoÞeld 2005). Initial studies already<br />
showed evidence <strong>of</strong> strong structuring <strong>of</strong> G. palpalis<br />
populations in fragmented l<strong>and</strong>scapes (Solano et al.<br />
2000). With more detailed study, it should there<strong>for</strong>e<br />
be possible to determine key areas where tsetse control<br />
interventions can proceed with relatively low risk<br />
<strong>of</strong> reinvasion from neighboring areas.<br />
To examine the population structure <strong>of</strong> G. palpalis,<br />
we used two approaches in the current study, one<br />
approach based on genetic variation at microsatellite<br />
DNA loci <strong>and</strong> the other approach based on phenetic<br />
variation as described by the geometry <strong>of</strong> the wings.<br />
The main objective was to assess whether the tsetse<br />
population from Loos isl<strong>and</strong>s was isolated from two<br />
other populations <strong>of</strong> the mangrove area <strong>of</strong> the HAT<br />
focus <strong>of</strong> Dubreka.<br />
Materials <strong>and</strong> Methods<br />
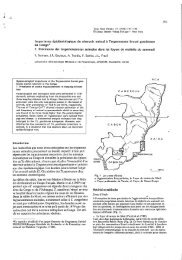
Study Area. The HAT focus <strong>of</strong> Dubreka is located<br />
45 km from Conakry, the capital <strong>of</strong> Guinea. HAT has<br />
shown incidences up to 5% in some <strong>of</strong> the visited<br />
villages from 1997 to 2005. The area is situated among<br />
the coastal mangrove, with anthropic Guinean savannah,<br />
<strong>and</strong> permanent or temporary inundated areas.<br />
Near the town <strong>of</strong> Dubreka (25,000 inhabitants), people<br />
live in villages <strong>of</strong> between 300 <strong>and</strong> 2,000 inhabitants,<br />
fragmented in many smaller localities. Main activities<br />
include Þshing, salt extraction, <strong>and</strong> agriculture<br />
(“vergers” <strong>of</strong> Elaeis guineensis, mangoes, rice, <strong>and</strong> food<br />
crops). Loos isl<strong>and</strong>s are separated from the mainl<strong>and</strong>,<br />
by 5 km <strong>of</strong> sea at the shortest distance. But the Þrst<br />
mangrove area where tsetse occur are at 20 km from<br />
these isl<strong>and</strong>s (Fig. 1).<br />
Entomological Surveys. In May 2005, six Vavoua<br />
traps (Laveissière <strong>and</strong> Grébaut 1990) were placed on<br />
Fotoba isl<strong>and</strong> (Loos isl<strong>and</strong>s), <strong>and</strong> 23 traps were placed<br />
in two mainl<strong>and</strong> localities <strong>of</strong> the littoral (Magnokhoun)<br />
<strong>and</strong> mangrove (Touguissoury) areas. These<br />
two mainl<strong>and</strong> localities are separated by 15 km, <strong>and</strong><br />
the shortest distance between them <strong>and</strong> Loos isl<strong>and</strong>s<br />
is 30 km. Cages were changed daily during 2 to 4 days,<br />
<strong>and</strong> tsetse were counted <strong>and</strong> separated by sex. From<br />
each dissected tsetse, the wings were removed <strong>and</strong> put<br />
in individual, labeled, dry Eppendorf tubes, <strong>and</strong> three<br />
legs were removed <strong>and</strong> put in individual, labeled, dry<br />
Eppendorf tubes.<br />
Microsatellite Loci. In total, 71 individuals were<br />
used <strong>for</strong> the genetic analyses at microsatellite loci: 23<br />
in Loos isl<strong>and</strong>s (14 males [M], nine females [F]), 28<br />
in Magnokhoun (14 M, 14 F), <strong>and</strong> 21 in Touguissoury<br />
(10 M, 10 F).<br />
Four microsatellite loci were analyzed: Gpg55,3<br />
(Solano et al. 1997); pgp11<strong>and</strong> pgp1 (Luna et al. 2001),<br />
<strong>and</strong> B104 (kindly provided by A. S. Robinson, IAEA,<br />
Vienna, Austria). Locus Gpg55,3 has been reported to<br />
be located on the X chromosome (Solano et al. 1997,<br />
Gooding et al. 2004), <strong>and</strong> given an absence <strong>of</strong> heterozygotes<br />
on a subsample <strong>of</strong> males (data not shown),<br />
B104 <strong>and</strong> pgp11 also were interpreted to be located on<br />
the X chromosome.<br />
To each tube containing the legs <strong>of</strong> the tsetse, 200<br />
l <strong>of</strong> 5% Chelex chelating resin was added (Walsh et<br />
al. 1991, Solano et al. 2000). After incubation at 56C<br />
<strong>for</strong> 1 h, DNA was denatured at 95C <strong>for</strong> 30 min. The<br />
tubes were then centrifuged at 12,000 g <strong>for</strong> 2 min<br />
<strong>and</strong> frozen <strong>for</strong> later analysis.<br />
The polymerase chain reaction (PCR) reactions<br />
were carried out in a thermocycler (MJ Research,<br />
Cambridge, United Kingdom) in 10-l Þnal volume,<br />
by using 1 l <strong>of</strong> the supernatant from the extraction<br />
step. After PCR ampliÞcation, allele b<strong>and</strong>s were routinely<br />
resolved on a 4,300 DNA Analysis System from<br />
LI-COR (Lincoln, NE) after migration in 96-lane reloadable<br />
(3) 6.5% denaturing polyacrylamide gels.<br />
This method allows a multiplex by the use <strong>of</strong> two<br />
infrared dyes (<strong>IRD</strong>ye), separated by 100 nm (700 <strong>and</strong><br />
800 nm), <strong>and</strong> read by a two-channel detection system<br />
that uses two separate lasers <strong>and</strong> detectors to eliminate<br />
errors due to ßuorescence overlap. To determine the<br />
different allele sizes, a large panel <strong>of</strong> 30 size markers<br />
was used. These size markers had been previously<br />
generated by cloning alleles from individual tsetse ßies<br />
into pGEM-T Easy Vector (Promega, Madison, WI).<br />
Three clones <strong>of</strong> each allele were sequenced using the<br />
T7 primer <strong>and</strong> the Big Dye Terminator Cycle Sequencing<br />
Ready Reaction kit (Applied Biosystems,<br />
Foster City, CA). Sequences were analyzed on an Applied<br />
Biosystems 310 automatic DNA sequencer, <strong>and</strong> the<br />
exact size <strong>of</strong> each cloned allele was determined. PCR<br />
products from these cloned alleles were run in the same<br />
acrylamide gel as the samples, allowing the allele size <strong>of</strong><br />
the samples to be determined accurately.<br />
Microsatellite Data Analysis. For the total sample<br />
subdivided into the three localities, WrightÕs F is<br />
(within sample heterozygote deÞciency, a measure <strong>of</strong><br />
deviation from panmixia) <strong>and</strong> F st (measure <strong>of</strong> population<br />
differentiation) were estimated using Weir <strong>and</strong><br />
CockerhamÕs unbiased estimators (f <strong>for</strong> F is , <strong>for</strong> F st )<br />
(Weir <strong>and</strong> Cockerham 1984). For r<strong>and</strong>om mating<br />
(within samples) or r<strong>and</strong>om distribution <strong>of</strong> individuals<br />
(between samples), F values are expected to be zero.<br />
When F st was measured, it was compared with F st max<br />
1 H s (Hedrick 1999, 2005).<br />
The signiÞcance <strong>of</strong> F is (deviation from panmixia) at<br />
each locus, <strong>and</strong> over all loci, also was tested separately<br />
within each sample by using 10,000 permutations <strong>of</strong><br />
alleles between individuals. Males were hemizygous at<br />
loci on the X chromosome. For these loci, measure <strong>of</strong><br />
F is <strong>and</strong> its signiÞcance were conducted only on females.<br />
The signiÞcance <strong>of</strong> F st (population differentiation)<br />
was assessed using 10,000 permutations <strong>of</strong> genotypes<br />
among samples. To evaluate signiÞcance<br />
when multiple tests were per<strong>for</strong>med, the sequential<br />
Bonferroni procedure was applied (Rice 1989).<br />
An unweighted pair-group method with arithmetic<br />
average (unweighted pair group method with arithmetic<br />
mean) dendrogram was built based on Cavalli-<br />
S<strong>for</strong>za <strong>and</strong> Edwards (1967) chord distance between<br />
the three populations. This distance is indeed the most