Saudi Ceramic Continued success - Al Rajhi Capital
Saudi Ceramic Continued success - Al Rajhi Capital
Saudi Ceramic Continued success - Al Rajhi Capital

You also want an ePaper? Increase the reach of your titles
YUMPU automatically turns print PDFs into web optimized ePapers that Google loves.
RSI10<br />
Vol<br />
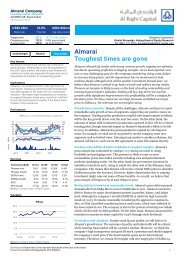
<strong>Saudi</strong> <strong>Ceramic</strong><br />
Construction and Materials –Industrial<br />
SCERCO AB: <strong>Saudi</strong> Arabia<br />
1 August 2010<br />
US$bn0.94bn 63.6% US$4.100mn<br />
Market cap Free float Avg. daily volume<br />
Target price 166.3 18.6% over current<br />
Consensus price n/a<br />
Current price 140.3 as at 31/7/2010<br />
Underweight Neutral Overweight<br />
Key themes<br />
We believe that the ceramics manufacturing industry<br />
will continue to grow. <strong>Saudi</strong> <strong>Ceramic</strong> has a very<br />
strong position in the <strong>Saudi</strong> ceramic market. It is<br />
currently the major local player. We believe that<br />
<strong>Saudi</strong> <strong>Ceramic</strong>’s strategy of increasing production<br />
capacity in the ceramic tiles and water heaters<br />
divisions will boost the company’s growth.<br />
Implications<br />
<strong>Saudi</strong> <strong>Ceramic</strong> is a quality company, which we rate<br />
as Overweight. It is performing well operationally<br />
and offers good growth in the near term at a<br />
reasonable valuation. We believe that growing<br />
dividends, coupled with high transparency will<br />
support the share price.<br />
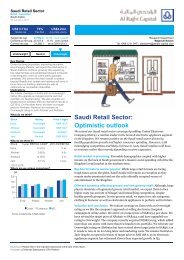
Performance<br />
140<br />
130<br />
120<br />
110<br />
100<br />
70<br />
30<br />
600 10<br />
400<br />
200<br />
Earnings<br />
Period End (SAR) 12/09A 12/10E 12/11E 12/12E<br />
Revenue (SARmn) 958 1,129 1,356 1,551<br />
Revenue Growth 11.7% 17.9% 20.1% 14.3%<br />
EBITDA (SARmn) 282 344 415 488<br />
EBITDA Growth 8.9% 21.7% 20.7% 17.6%<br />
EPS 7.89 9.45 11.17 13.41<br />
EPS Growth 10.8% 19.9% 18.1% 20.1%<br />
Source: Company data, <strong>Al</strong> <strong>Rajhi</strong> <strong>Capital</strong><br />
Valuation<br />
24<br />
22<br />
20<br />
18<br />
16<br />
14<br />
12<br />
10<br />
Price Close MAV10 MAV50 Relative to SASEIDX (RHS)<br />
08/09 10/09 01/10 05/10 07/10<br />
Source: Bloomberg<br />
P/E (x)<br />
01/07 01/08 01/09<br />
Source: Company data, <strong>Al</strong> <strong>Rajhi</strong> <strong>Capital</strong><br />
107<br />
103<br />
99<br />
95<br />
91<br />
88<br />
84<br />
80<br />
76<br />
72<br />
<strong>Saudi</strong> <strong>Ceramic</strong><br />
<strong>Continued</strong> <strong>success</strong><br />
Research Department<br />
Hashem <strong>Al</strong>-Fawaz, Investment Analyst<br />
Tel 966 1 211 9269, alfawazhi@alrajhi-capital.com<br />
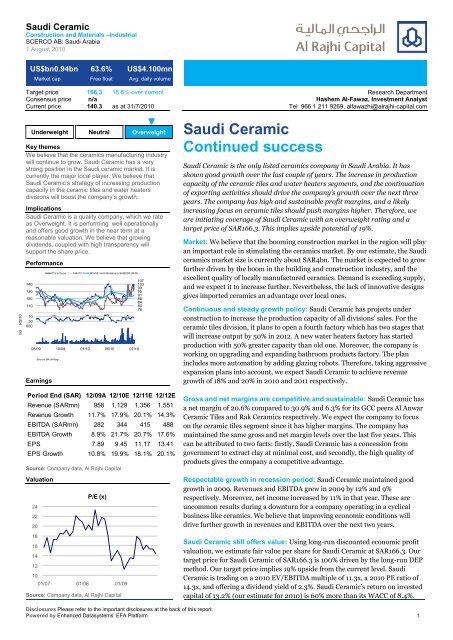
<strong>Saudi</strong> <strong>Ceramic</strong> is the only listed ceramics company in <strong>Saudi</strong> Arabia. It has<br />
shown good growth over the last couple of years. The increase in production<br />
capacity of the ceramic tiles and water heaters segments, and the continuation<br />
of exporting activities should drive the company’s growth over the next three<br />
years. The company has high and sustainable profit margins, and a likely<br />
increasing focus on ceramic tiles should push margins higher. Therefore, we<br />
are initiating coverage of <strong>Saudi</strong> <strong>Ceramic</strong> with an overweight rating and a<br />
target price of SAR166.3. This implies upside potential of 19%.<br />
Market: We believe that the booming construction market in the region will play<br />
an important role in stimulating the ceramics market. By our estimate, the <strong>Saudi</strong><br />
ceramics market size is currently about SAR4bn. The market is expected to grow<br />
further driven by the boom in the building and construction industry, and the<br />
excellent quality of locally manufactured ceramics. Demand is exceeding supply,<br />
and we expect it to increase further. Nevertheless, the lack of innovative designs<br />
gives imported ceramics an advantage over local ones.<br />
Continuous and steady growth policy: <strong>Saudi</strong> <strong>Ceramic</strong> has projects under<br />
construction to increase the production capacity of all divisions’ sales. For the<br />
ceramic tiles division, it plans to open a fourth factory which has two stages that<br />
will increase output by 50% in 2012. A new water heaters factory has started<br />
production with 50% greater capacity than old one. Moreover, the company is<br />
working on upgrading and expanding bathroom products factory. The plan<br />
includes more automation by adding glazing robots. Therefore, taking aggressive<br />
expansion plans into account, we expect <strong>Saudi</strong> <strong>Ceramic</strong> to achieve revenue<br />
growth of 18% and 20% in 2010 and 2011 respectively.<br />
Gross and net margins are competitive and sustainable: <strong>Saudi</strong> <strong>Ceramic</strong> has<br />
a net margin of 20.6% compared to 30.9% and 6.3% for its GCC peers <strong>Al</strong> Anwar<br />
<strong>Ceramic</strong> Tiles and Rak <strong>Ceramic</strong>s respectively. We expect the company to focus<br />
on the ceramic tiles segment since it has higher margins. The company has<br />
maintained the same gross and net margin levels over the last five years. This<br />
can be attributed to two facts: firstly, <strong>Saudi</strong> <strong>Ceramic</strong> has a concession from<br />
government to extract clay at minimal cost, and secondly, the high quality of<br />
products gives the company a competitive advantage.<br />
Respectable growth in recession period: <strong>Saudi</strong> <strong>Ceramic</strong> maintained good<br />
growth in 2009. Revenues and EBITDA grew in 2009 by 12% and 9%<br />
respectively. Moreover, net income increased by 11% in that year. These are<br />
uncommon results during a downturn for a company operating in a cyclical<br />
business like ceramics. We believe that improving economic conditions will<br />
drive further growth in revenues and EBITDA over the next two years.<br />
<strong>Saudi</strong> <strong>Ceramic</strong> still offers value: Using long-run discounted economic profit<br />
valuation, we estimate fair value per share for <strong>Saudi</strong> <strong>Ceramic</strong> at SAR166.3. Our<br />
target price for <strong>Saudi</strong> <strong>Ceramic</strong> of SAR166.3 is 100% driven by the long-run DEP<br />
method. Our target price implies 19% upside from the current level. <strong>Saudi</strong><br />
<strong>Ceramic</strong> is trading on a 2010 EV/EBITDA multiple of 11.3x, a 2010 PE ratio of<br />
14.3x, and offering a dividend yield of 2.3%. <strong>Saudi</strong> <strong>Ceramic</strong>’s return on invested<br />
capital of 13.2% (our estimate for 2010) is 60% more than its WACC of 8.4%.<br />
Disclosures Please refer to the important disclosures at the back of this report.<br />
Powered by Enhanced Datasystems’ EFA Platform 1
<strong>Saudi</strong> <strong>Ceramic</strong><br />
Construction & Materials –Industrial<br />
1 August 2010<br />
Page<br />
3 <strong>Saudi</strong> ceramics market: dominated by imports<br />
3 Opportunities foster optimism, few threats<br />
<strong>Ceramic</strong> products are essential parts of modern buildings. This explains the high<br />
correlation between demand for ceramics and construction markets. The demand for<br />
ceramic products is huge, and we expect it to grow further driven by the booming<br />
construction. <strong>Saudi</strong> ceramics are considered high quality but they have to develop<br />
innovative designs to compete with imported ceramics.<br />
5 <strong>Saudi</strong> <strong>Ceramic</strong>: in expansion mode<br />
5<br />
Continuous and steady growth policy<br />
<strong>Saudi</strong> <strong>Ceramic</strong>’s business contains two divisions: ceramic tiles and bathroom products,<br />
and water heaters. <strong>Al</strong>l divisions have grown strongly recently. We expect further<br />
growth since the company is increasing production capacity. Desert Mines supplies<br />
<strong>Saudi</strong> <strong>Ceramic</strong> and sells clay to local ceramic companies. <strong>Saudi</strong> <strong>Ceramic</strong> sells its<br />
products through four main channels: showrooms, dealers, institutions and exports.<br />
6<br />
<strong>Ceramic</strong> tiles and bathroom goods segment: gradual and<br />
sustainable expansion strategy<br />
<strong>Saudi</strong> <strong>Ceramic</strong> is expanding production capacity of ceramic tiles. It currently has total<br />
production capacity of 34mn m 2 of ceramic tiles, and we expect this to reach 43mn and<br />
52mn m 2 by the end of 2010 and 2011 respectively.<br />
7<br />
Water heaters segment: remarkable growth<br />
<strong>Saudi</strong> <strong>Ceramic</strong> currently has total production capacity of 1.5mn heaters per year. Water<br />
heater segment sales grew by 33% and 21% in 2008 and 2009 respectively. More than<br />
50% of this segment’s production is exported.<br />
8 Profitable business: fine record, returns set to last<br />
8<br />
Gross and net margins are competitive and sustainable<br />
<strong>Saudi</strong> <strong>Ceramic</strong> has a net margin of 20.8% compared to 30.9% and 6.3% for its regional<br />
peers <strong>Al</strong> Anwar <strong>Ceramic</strong> Tiles and Rak <strong>Ceramic</strong>s respectively. We expect the company<br />
to focus on the ceramic tiles segment since it has a higher margin.<br />
8<br />
Respectable growth in recession period<br />
Revenues and EBITDA grew in 2009 by 12% and 9% respectively. Moreover, net<br />
income increased by 11% in that year. We expect that improving economic conditions<br />
will drive further growth in revenues and EBTIDA over the next two years.<br />
10 Valuation: offers good long-term value<br />
10 High economic profit; growth in dividend payout ratio<br />
<strong>Saudi</strong> <strong>Ceramic</strong> achieves a return on invested capital (ROIC) of 12.5-12.6%. We expect<br />
the company to maintain and improve its high returns, and so two-thirds of our<br />
estimated fair enterprise value for <strong>Saudi</strong> <strong>Ceramic</strong> comes from future economic profits.<br />
We estimate fair value per share at SAR166.3, and set this as our target price.<br />
Currently, <strong>Saudi</strong> <strong>Ceramic</strong> offers a dividend yield of 2.3%. The company increased the<br />
paid dividend to 30% of paid-up capital in 2009; however, we expect it to maintain the<br />
same dividend for at least three years. Our rating on <strong>Saudi</strong> <strong>Ceramic</strong> is Overweight.<br />
13 Appendix: investments<br />
14 Financial data<br />
Disclosures Please refer to the important disclosures at the back of this report. 2
<strong>Saudi</strong> <strong>Ceramic</strong><br />
Construction & Materials –Industrial<br />
1 August 2010<br />
Corporate summary Share information Valuation<br />
<strong>Saudi</strong> <strong>Ceramic</strong> Company is one of the<br />
Market cap (SAR/US$) 3.502bn / 0.935bn<br />
oldest and leading ceramics producers<br />
52-week range 109.5 - 140.8<br />
in the Middle East. <strong>Saudi</strong> <strong>Ceramic</strong> Daily avg volume (US$)<br />
3.700mn<br />
manufactures and markets ceramic Shares outstanding<br />
25.00mn<br />
products. The company has two major Free float (est) 63.6%<br />
segments: ceramic tiles and bathroom<br />
products, which contribute 77% of Performance: 1M 3M 12M<br />
revenues, and water heaters which Absolute 7.8% -4.5% 2.1%<br />
contributes the remaining 23%.<br />
Relative to index 13.2% 5.1% -4%<br />
Incorporated in 1977 in Riyadh by a<br />
group of prominent businessmen.<br />
Major Shareholder:<br />
General Social Insurance 15.9%<br />
Saleh Abdulaziz <strong>Al</strong> <strong>Rajhi</strong> 14.3%<br />
Source: Bloomberg, <strong>Al</strong> <strong>Rajhi</strong> <strong>Capital</strong><br />
<strong>Saudi</strong> ceramics market<br />
dominated by imports<br />
Period End 12/09A 12/10E 12/11E 12/12E<br />
Revenue (SARmn) 958 1,103 1,230 1,368<br />
EBITDA (SARmn) 282 343 391 447<br />
Net Profit (SARmn) 197 230 252 295<br />
EPS (SAR) 7.89 9.20 10.09 11.78<br />
DPS (SAR) 3.00 3.00 3.00 3.00<br />
EPS Growth 10.8% 16.7% 9.6% 16.8%<br />
EV/EBITDA (x) 13.3 11.3 10.3 9.0<br />
P/E (x) 16.7 14.3 13.1 11.2<br />
P/B (x) 3.8 3.3 2.8 2.3<br />
Dividend Yield 2.3% 2.3% 2.3% 2.3%<br />
Source: Company data, <strong>Al</strong> <strong>Rajhi</strong> <strong>Capital</strong><br />
The <strong>Saudi</strong> ceramic market size<br />
is about SAR4bn<br />
70% of the market sales are<br />
imports<br />
With a size of about SAR4bn, the <strong>Saudi</strong> ceramics market is one of the biggest in the MENA<br />
region. We expect the market to grow further, driven by the current boom in the building and<br />
construction industry. The ceramic products include ceramic wall and floor tiles, bathroom<br />
goods and water heaters. The main material used in manufacturing ceramics is clay. The tiles<br />
include many kinds such as porcelain and ceramic tiles. <strong>Ceramic</strong>s are made mainly of clay,<br />
which is extracted locally, and heated in gas kilns and mixed with other exported chemicals.<br />
The porcelain is made of white clay which is imported from Ukraine and Turkey.<br />
The ceramic tiles market is dominated by imports which represent around 70% of the market.<br />
<strong>Saudi</strong> <strong>Ceramic</strong> has a 25% share, and the remaining 5% is divided between small private <strong>Saudi</strong><br />
companies such as <strong>Al</strong>fanar, Future <strong>Ceramic</strong> in Dammam and <strong>Al</strong>-Jawdah <strong>Ceramic</strong>. Many of<br />
the local companies are suffering because of the lack of innovative designs that are an<br />
important feature of modern buildings. Imports, especially from Europe and US, are<br />
characterised by innovative designs, making them more attractive to people despite their<br />
high prices.<br />
Figure 1. <strong>Saudi</strong> ceramics market : market share of ceramic tiles<br />
5%<br />
25%<br />
70%<br />
Source: Company data, <strong>Al</strong> <strong>Rajhi</strong> <strong>Capital</strong><br />
Imports <strong>Saudi</strong> ceramics others<br />
Excess demand in bathroom<br />
products market<br />
The bathroom products market is very dominated by imports, with a share of around 90%.<br />
<strong>Saudi</strong> <strong>Ceramic</strong> company has more than 7% of the bathroom products market, and the other<br />
local companies represent 3 % of the market. This market is characterised by excess demand,<br />
which provides an opportunity for local companies to expand their capacity. Regarding the<br />
water heaters markets, <strong>Saudi</strong> <strong>Ceramic</strong> has a share of about 50%. The other local companies<br />
have less than 5% market share, and imports represent the remaining 45% of the market.<br />
Disclosures Please refer to the important disclosures at the back of this report. 3
<strong>Saudi</strong> <strong>Ceramic</strong><br />
Construction & Materials –Industrial<br />
1 August 2010<br />
Opportunities foster optimism, few threats<br />
Huge government projects will<br />
boost the demand for ceramics<br />
products<br />
Imports have a competitive<br />
advantage in innovative<br />
designs<br />
Demand is expected to be more<br />
than 200mn m 2 by 2013<br />
Booming construction market<br />
<strong>Ceramic</strong> products including tiles, bathroom products and water heaters are essential parts of<br />
modern buildings. This explains the high correlation between demand for ceramics and<br />
construction markets. The <strong>Saudi</strong> government is constructing huge projects called economic<br />
cities. There are also other big construction projects for the twelve newly created government<br />
universities, and expansion projects for the existing universities. These projects are expected<br />
to increase the demand for ceramic products and support the revenue growth.<br />
Excellent quality, but lack of innovative designs<br />
<strong>Saudi</strong> ceramics are considered high quality since their raw materials, mainly red clay, are<br />
among the best in the world. However, the imported ceramics, especially the European, are<br />
preferred by customers because of the variety of design that fits different people’s needs.<br />
Some of the local companies are trying to overcome this obstacle by producing customised<br />
orders where the customer selects his preferred design. <strong>Saudi</strong> ceramics are cheaper than the<br />
European so they are attractive for low and middle class people.<br />
Demand is exceeding supply<br />
We expect demand for ceramic tiles to be more than 200mn m 2 by 2013 while the current<br />
supply level is about 136mn m 2 . The demand for bathroom products is already exceeding the<br />
quantity supplied. However, supply of water heaters exceeds demand which increases the<br />
export percentage of locally manufactured heaters. Overall, the sales growth potential of<br />
<strong>Saudi</strong> ceramic companies seems very clear.<br />
Disclosures Please refer to the important disclosures at the back of this report. 4
<strong>Saudi</strong> <strong>Ceramic</strong><br />
Construction & Materials –Industrial<br />
1 August 2010<br />
<strong>Saudi</strong> <strong>Ceramic</strong><br />
in expansion mode<br />
<strong>Ceramic</strong> tiles and bathroom<br />
products division is the biggest<br />
in <strong>Saudi</strong> <strong>Ceramic</strong><br />
Continuous and steady growth policy<br />
<strong>Saudi</strong> <strong>Ceramic</strong>’s business contains two divisions: ceramic tiles and bathroom products (this is<br />
named by the company as sanitary wares), and water heaters. The company combines<br />
ceramic tiles and bathroom products in one division since they have almost the same<br />
business line and raw materials. 40% of ceramic tiles production is customised. i.e. produced<br />
according to customers’ preferences. In Q2 2010, ceramic tiles contributed 79% of total<br />
revenues whereas water heaters contributed 21%. <strong>Al</strong>l divisions have grown strongly recently;<br />
the water heaters segment showed the greatest year-on-year growth in Q2 2010 since it grew<br />
by 15.3%. The ceramic tiles and bathroom products segment grew by 15% in Q2 2010. The<br />
company’s three year compound annual growth rate (CAGR) in revenues is 24 %.<br />
Figure 2. <strong>Saudi</strong> <strong>Ceramic</strong>: revenues breakdown in Q2 2010<br />
21%<br />
79%<br />
ceramic tiles and bathroom products<br />
water heaters<br />
Source: Company data, <strong>Al</strong> <strong>Rajhi</strong> <strong>Capital</strong><br />
<strong>Saudi</strong> <strong>Ceramic</strong> sells clay to<br />
local ceramic companies<br />
Increase in production capacity<br />
of all segments<br />
Desert Mines has a concession to extract clay<br />
Desert Mines was a department of <strong>Saudi</strong> <strong>Ceramic</strong> Company, and it is in the process of<br />
becoming a separate entity 100% owned by <strong>Saudi</strong> <strong>Ceramic</strong>. Desert Mines has a concession<br />
from the <strong>Saudi</strong> government to extract clay and it is renewed periodically. Desert Mines<br />
supplies <strong>Saudi</strong> <strong>Ceramic</strong> and sells clay to local ceramic companies and other companies that<br />
use clay in their manufacturing process such as ceramic pipes companies. The high quality of<br />
local clay gives the company an opportunity to export its products abroad.<br />
Production capacity is increasing<br />
<strong>Saudi</strong> <strong>Ceramic</strong>’s factories are located in the Second Industrial City in Riyadh. <strong>Saudi</strong> <strong>Ceramic</strong>s<br />
has three ceramic tiles factories, and a fourth is under construction. The fourth tiles factory<br />
project will increase production capacity by 50%. The first stage of the fourth factory is<br />
expected to start commercial production by the end of 2010. The second stage is expected to<br />
run by the end of 2011. The company had already expanded the capacity of the only bathroom<br />
products factory in Q1 2010. The company has two water heater factories. The second factory<br />
started commercial production in Q4 2009 and it has half of the capacity of the first one.<br />
Taking these expansion plans into account and assuming the prices will increase or stay<br />
constant, we expect <strong>Saudi</strong> <strong>Ceramic</strong> to achieve impressive revenue growth of 18% and 20% in<br />
2010 and 2011 respectively.<br />
Disclosures Please refer to the important disclosures at the back of this report. 5
<strong>Saudi</strong> <strong>Ceramic</strong><br />
Construction & Materials –Industrial<br />
1 August 2010<br />
Figure 3. <strong>Saudi</strong> <strong>Ceramic</strong>: production capacity for each segment<br />
2007 2008 2009 2010E 2011E<br />
<strong>Ceramic</strong> tiles(mn m2) 21 32 34 43 52<br />
Sanitary wares (tons) 19,200 24,000 27,600 34,500 41,000<br />
Water heaters (heater) 600,000 850,000 1,200,000 1,500,000 1,600,000<br />
Source: Company data, <strong>Al</strong> <strong>Rajhi</strong> <strong>Capital</strong><br />
55% of revenues come from<br />
local dealers<br />
Sales by distribution channels<br />
The company’s sales can be divided based on the distribution channels. The company has 25<br />
showrooms around <strong>Saudi</strong> Arabia that derive 20% of its sales. The exports represent 13% of<br />
sales. The sales of the Dubai office increased by 25% in 2009. The third channel is direct sales<br />
to institutional projects, which make up a 7% share. Most of the sales are driven by company<br />
dealers, which represent 55% of sales.<br />
Figure 4. <strong>Saudi</strong> <strong>Ceramic</strong>: revenues breakdown by distribution channels<br />
Source: Company data, <strong>Al</strong> <strong>Rajhi</strong> <strong>Capital</strong><br />
We expect an increase in<br />
capacity of ceramic tiles of 50%<br />
in 2012<br />
Increased utilisation of<br />
bathroom products factory<br />
We expect revenues to grow by<br />
18% and 22% in 2010 and<br />
2011 respectively<br />
<strong>Ceramic</strong> tiles and bathroom products segment: gradual<br />
and sustainable expansion strategy<br />
<strong>Saudi</strong> <strong>Ceramic</strong> plans to continue expanding its production of ceramic tiles. The company has<br />
replaced the old tiles line in the first tiles factory whose capacity totalled 600,000 m 2 by a<br />
new line whose annual capacity is 2mn m 2 . This project has been completed and production<br />
started on March 2009. The company also lunched a new production line at the first tile<br />
factory with an annual capacity of 1.3mn m 2 , which started production on May 2010.<br />
Moreover, work is progressing on implementation of the first stage of the fourth tile factory<br />
project with annual production capacity of 9mn m 2 . This stage is expected to be in operation<br />
by the end of 2010. The second stage of the fourth tiles factory has a capacity of 9mn m 2 , and<br />
the company expects to launch production by the end of 2011. The company currently has a<br />
total production capacity of 34mn m 2 of ceramic tiles, and we expect it to reach 43mn and<br />
52mn m 2 by the end of 2010 and 2011 respectively.<br />
The company has one factory that handles bathroom products production. The current<br />
capacity of 30,000 tons per year equals more than 2mn pieces. The company is planning to<br />
expand its capacity further since demand is huge. The company is working on upgrading and<br />
expanding the bathroom products factory. The plan includes more automation by adding<br />
glazing robots for spraying, high and low pressure casting lines, tunnel and shuttle kilns and<br />
tunnel dryers. Upgrading and expanding will result in an increase of capacity of 50% up to<br />
3mn pieces annually within tow years.<br />
The ceramic tiles and the bathroom products segment sales grew by 41% and 9% in 2008 and<br />
2009 respectively. From the fact that the company’s policy is to produce at full capacity, and<br />
based on the aggressive expansion, we expect that the company’s revenues will grow by 18%<br />
and 22% in 2010 and 2011 respectively.<br />
Disclosures Please refer to the important disclosures at the back of this report. 6
<strong>Saudi</strong> <strong>Ceramic</strong><br />
Construction & Materials –Industrial<br />
1 August 2010<br />
Figure 5. <strong>Saudi</strong> <strong>Ceramic</strong>: ceramic tiles and bathroom products segment sales forecasts<br />
1,400<br />
1,320<br />
1,200<br />
1,061<br />
1,189<br />
1,000<br />
867<br />
800<br />
672<br />
734<br />
600<br />
475<br />
400<br />
200<br />
0<br />
FY 07 FY08 FY09 FY10E FY11E FY12E FY13E<br />
sales(mn SAR)<br />
Source: Company data, <strong>Al</strong> <strong>Rajhi</strong> <strong>Capital</strong><br />
50% of water heaters are<br />
exported<br />
We expect revenues to grow by<br />
17.5% and 12% in 2010 and<br />
2011 respectively<br />
Water heaters segment: remarkable growth<br />
<strong>Saudi</strong> <strong>Ceramic</strong> produces porcelain-coated water heaters, which are stainless and safer than<br />
galvanised water heaters. The company sells water heaters under different brand names<br />
based on quality and durability, such as the <strong>Saudi</strong> <strong>Ceramic</strong> brand which is distributed mainly<br />
in the local and GCC market, and “Super Aqua Hot” which is exported to Europe. The<br />
company exports more than 50% of its commercial production of this segment.<br />
<strong>Saudi</strong> <strong>Ceramic</strong> has two water heater factories. The second factory started commercial<br />
production in the last quarter of 2009 with an annual production capacity of 500,000 water<br />
heaters (50% of the first factory capacity). The company currently has a total production<br />
capacity of 1.5mn heaters per year. Water heater segment sales grew by 33% and 21% in 2008<br />
and 2009 respectively. This was driven mainly by huge demand from local customers and<br />
foreign countries. We expect that this demand will continue further. Therefore, we expect the<br />
water heater segment to grow by 18% and 12% in 2010 and 2011 respectively.<br />
Figure 6. <strong>Saudi</strong> <strong>Ceramic</strong>: water heaters segment sales forecasts<br />
400<br />
350<br />
330<br />
366<br />
300<br />
250<br />
224<br />
263<br />
295<br />
200<br />
185<br />
150<br />
140<br />
100<br />
50<br />
0<br />
FY 07 FY08 FY09 FY10E FY11E FY12E FY13E<br />
sales(mn SAR )<br />
Source: Company data, <strong>Al</strong> <strong>Rajhi</strong> <strong>Capital</strong><br />
Disclosures Please refer to the important disclosures at the back of this report. 7
<strong>Saudi</strong> <strong>Ceramic</strong><br />
Construction & Materials –Industrial<br />
1 August 2010<br />
Profitable business<br />
good record and sustainable returns<br />
<strong>Saudi</strong> <strong>Ceramic</strong> barely suffered<br />
during the downturn of 2009<br />
Respectable growth in recession period<br />
<strong>Saudi</strong> <strong>Ceramic</strong> maintained good growth in the recessionary year of 2009. Revenues and<br />
EBITDA grew in 2009 by 12% and 9% respectively. Moreover, net income increased also by<br />
11% in that year. These are uncommon results during an economic downturn for a company<br />
operating in a cyclical business like ceramics. We are convinced that the company will<br />
perform better in economic recovery stage. We expect that the improving economic<br />
conditions and the current expansion projects will drive further growth in revenues and<br />
EBTIDA over the next two years.<br />
Figure 7. <strong>Saudi</strong> <strong>Ceramic</strong>: revenues and EBITDA growth<br />
50%<br />
45%<br />
40%<br />
35%<br />
30%<br />
25%<br />
20%<br />
15%<br />
10%<br />
5%<br />
0%<br />
FY08 FY09 FY10E FY11E FY12E<br />
revenues<br />
EBITDA<br />
Source: Company data, <strong>Al</strong> <strong>Rajhi</strong> <strong>Capital</strong><br />
As the figure above shows, we expect revenue growth of 18% in 2010 to be followed by growth<br />
of 20% in 2011 and 14% in 2012. Regarding EBITDA, we expect growth of of 22% in 2010 to<br />
be followed by growth of 21% in 2011 and 18% in 2012. We expect the EBITDA margin to<br />
expand from 30% in 2009 to 32% by 2012.<br />
<strong>Saudi</strong> <strong>Ceramic</strong>’s regional peers<br />
are <strong>Al</strong> Anwar <strong>Ceramic</strong> Tiles and<br />
Rak <strong>Ceramic</strong>s<br />
We expect the company to<br />
focus on the ceramic tiles<br />
segment since it has higher<br />
margin<br />
Gross and net margins are competitive and sustainable<br />
<strong>Saudi</strong> <strong>Ceramic</strong>’s regional peers are <strong>Al</strong> Anwar <strong>Ceramic</strong> Tiles and Ras <strong>Al</strong> Khaimah (Rak)<br />
<strong>Ceramic</strong>s. <strong>Al</strong> Anwar <strong>Ceramic</strong> Tiles is listed on the Muscat Securities Market (MSM), and Rak<br />
<strong>Ceramic</strong>s is listed on the Abu Dhabi Securities Market (ADSM). <strong>Al</strong> Anwar <strong>Ceramic</strong> Tiles<br />
enjoys higher gross and net margins than <strong>Saudi</strong> <strong>Ceramic</strong>. This is due mainly to the fact that<br />
<strong>Al</strong> Anwar <strong>Ceramic</strong> Tiles produces only ceramic tiles, which enjoy higher margins than other<br />
ceramic products such as bathroom products and water heaters. However, Rak <strong>Ceramic</strong>s is<br />
below <strong>Saudi</strong> <strong>Ceramic</strong> in terms of the gross and net margin. Rak <strong>Ceramic</strong>s is suffering because<br />
it implemented huge expansion projects in a short period. It has plants in six different<br />
countries around the world, which increased its capex and logistic costs. Moreover, Rak<br />
<strong>Ceramic</strong>s has a high financing cost that reduces its net margin.<br />
<strong>Saudi</strong> <strong>Ceramic</strong> has a net margin of 20.6% compared to 30.9% and 6.3% for <strong>Al</strong> Anwar <strong>Ceramic</strong><br />
Tiles and Rak <strong>Ceramic</strong>s respectively. We expect the company to focus on the ceramic tiles<br />
segment since it has higher margins. We believe that <strong>Saudi</strong> <strong>Ceramic</strong>’s margins are good. This<br />
can be attributed to two facts; firstly, <strong>Saudi</strong> <strong>Ceramic</strong> has a concession from <strong>Saudi</strong> government<br />
to extract clay in a minimal cost; and secondly, the high quality of products gives the<br />
company a competitive advantage and good appearance abroad.<br />
Disclosures Please refer to the important disclosures at the back of this report. 8
<strong>Saudi</strong> <strong>Ceramic</strong><br />
Construction & Materials –Industrial<br />
1 August 2010<br />
Figure 8. <strong>Saudi</strong> <strong>Ceramic</strong> versus <strong>Al</strong> Anwar <strong>Ceramic</strong> Tiles and Rak <strong>Ceramic</strong>s (gross & net<br />
margins)<br />
60.0%<br />
50.0%<br />
50.0%<br />
40.0%<br />
36.8%<br />
30.0%<br />
20.0%<br />
24.2%<br />
30.9%<br />
20.6%<br />
10.0%<br />
6.3%<br />
0.0%<br />
Gross Margin<br />
Net Margin<br />
Source: Company data, <strong>Al</strong> <strong>Rajhi</strong> <strong>Capital</strong><br />
<strong>Al</strong> Anwar <strong>Ceramic</strong> Tiles Rak <strong>Ceramic</strong>s <strong>Saudi</strong> <strong>Ceramic</strong><br />
<strong>Saudi</strong> <strong>Ceramic</strong> maintained the<br />
same gross and net margin<br />
levels over the last five years<br />
<strong>Saudi</strong> <strong>Ceramic</strong>’s gross and net margins look respectable. The company has maintained almost<br />
the same gross and net margin over the last five years. We believe it will be able to improve<br />
its margins or at least maintain the current margins levels, given that the demand is<br />
increasing. However, market risks resulting from local competitors and dumping practices by<br />
some foreign importers, which sell at low prices, may affect the margins.<br />
Disclosures Please refer to the important disclosures at the back of this report. 9
<strong>Saudi</strong> <strong>Ceramic</strong><br />
Construction & Materials –Industrial<br />
1 August 2010<br />
Valuation<br />
offers good long-term value<br />
High economic profit of 12.5-<br />
12.6%<br />
High economic profit; growth in dividend payout ratio<br />
By our estimates, over the period 2008-2009 <strong>Saudi</strong> <strong>Ceramic</strong> achieved a return on invested<br />
capital (ROIC) of 12.5-12.6%. This is 60% more than our estimate of the company’s weighted<br />
average cost of capital (WACC) of 8.4%, implying that the company achieved an economic<br />
profit spread (ROIC – WACC) of 4.2-4.3%. We expect <strong>Saudi</strong> <strong>Ceramic</strong>’s economic profit<br />
spread to increase from this year onwards driven by the expected increase in demand.<br />
Figure 9. <strong>Saudi</strong> <strong>Ceramic</strong>: economic profit spread (ROIC-WACC)<br />
7.0%<br />
6.0%<br />
5.5%<br />
6.1%<br />
6.0%<br />
5.0%<br />
4.3%<br />
4.2%<br />
4.9%<br />
4.0%<br />
3.0%<br />
2.0%<br />
1.0%<br />
0.0%<br />
2008 2009 2010 2011 2012 2013<br />
economic profit<br />
Source: Company data, <strong>Al</strong> <strong>Rajhi</strong> <strong>Capital</strong><br />
<strong>Saudi</strong> <strong>Ceramic</strong> currently offers<br />
a dividend yield of around 2.3%<br />
Our key long-run method of<br />
forecasting is discounted<br />
economic profit (DEP)<br />
The company has increased its annual paid dividends from 20% t0 25%of paid-up capital in<br />
2006. Then, it increased the paid dividend to 30% in 2009. However, we expect the company<br />
to maintain the same paid dividend for at least three years given that the company has high<br />
capex. <strong>Saudi</strong> <strong>Ceramic</strong> currently offers a dividend yield of 2.3%. The payout ratio is low in<br />
comparison to the high net margin. However, we expect the company to increase its paid<br />
dividends after 2013 assuming a reduction in capex.<br />
Valuation: summary of our approach and conclusions<br />
Our key method of valuation for <strong>Saudi</strong> <strong>Ceramic</strong> is long-run discounted economic profit<br />
(DEP), sometimes also called discounted long-run EVA (“economic value added”). This is a<br />
simple variation on discounted cash flow, and is mathematically equivalent. In our models,<br />
we make explicit forecasts for income statement, balance sheet and cash flow out to 2021. We<br />
then assume a steady fading of return on invested capital, i.e. excess return, down to the cost<br />
of capital over a period of up to 40 years from end of our period of explicit forecasting. This<br />
approach avoids a common problem in long-run modelling: namely, that the analyst stops<br />
forecasting at some arbitrary point when the company in question is still generating high<br />
returns. In terms of financial theory this is implausible, and excess returns will eventually<br />
disappear through competition, regulation or some other means.<br />
Our DEP valuations are sensitive to many factors, including assumed revenue growth,<br />
EBITDA margin and capex/sales ratio in 2021, i.e. the last year of explicit forecasting.<br />
Another important variable is the assumed duration of the period of competitive advantage,<br />
i.e. the period during which the company generates returns above weighted average cost of<br />
capital (WACC). Deciding on the length of the period of the competitive advantage is<br />
naturally a subjective exercise. We have assumed 30 years for <strong>Saudi</strong> <strong>Ceramic</strong> on the grounds<br />
that it is one of the leaders in its market and that it would take several years for rivals to<br />
challenge it effectively.<br />
We estimate <strong>Saudi</strong> <strong>Ceramic</strong>’s<br />
WACC at 8.4%<br />
However, as with any DCF-based approach, the factor to which the DEP valuation is most<br />
sensitive is WACC; we have assumed a WACC of 8.4% for <strong>Saudi</strong> <strong>Ceramic</strong>. <strong>Saudi</strong> <strong>Ceramic</strong> has<br />
an adjusted Beta of around 0.9 according to Bloomberg. Moreover, <strong>Saudi</strong> <strong>Ceramic</strong> has a low<br />
interest rate on debt which stems from the fact that a significant portion of its loans comes<br />
Disclosures Please refer to the important disclosures at the back of this report. 10
<strong>Saudi</strong> <strong>Ceramic</strong><br />
Construction & Materials –Industrial<br />
1 August 2010<br />
from the <strong>Saudi</strong> Industrial Development Fund (SIDF); these loans carry a very low or zero<br />
interest rate.<br />
WACC is in turn highly sensitive to assumed terminal capital structure. Estimating terminal<br />
capital structure is again a rather subjective exercise. We have assumed a terminal debt/(debt<br />
plus equity) ratio of 35% for <strong>Saudi</strong> <strong>Ceramic</strong>, compared to about 45% at present. We expect<br />
the company to redeem some of the debt as more cash is generated and so we expect gearing<br />
to decrease over the long run.<br />
Figure 10. <strong>Saudi</strong> <strong>Ceramic</strong>: weighted average cost of capital (WACC)<br />
Risk-free Rate 3.0%<br />
Expected Mkt Return - Risk-free Rate 8.4%<br />
Adjusted Beta 0.9<br />
Cost of Equity 10.6%<br />
Pre-tax Cost of Debt 4.5%<br />
Effective Tax rate 2.6%<br />
After-tax Cost of Debt 4.4%<br />
Target D/(D+E) 35.0%<br />
WACC 8.4%<br />
Source: Bloomberg, <strong>Al</strong> <strong>Rajhi</strong> <strong>Capital</strong><br />
Two-thirds of our estimated fair<br />
enterprise value for <strong>Saudi</strong><br />
<strong>Ceramic</strong> comes from future<br />
economic returns<br />
We estimate fair value per<br />
share at SAR166.3<br />
One of the advantages of discounted economic profit forecasting is that it splits the analyst’s<br />
appraised fair enterprise value for a company between discounted economic profit, i.e. the<br />
present value of the company’s future returns in excess of the cost of capital, and invested<br />
capital, i.e. (in simple terms) the debt and equity funding already invested in the business.<br />
With regard to <strong>Saudi</strong> <strong>Ceramic</strong>, as the table below shows, we calculate discounted economic<br />
profit at SAR3,238mn, i.e. roughly twice the opening invested capital of SAR1,554mn. In<br />
other words, two-thirds of our estimated fair enterprise value for <strong>Saudi</strong> <strong>Ceramic</strong> comes from<br />
discounted economic profit. This means that a large part of the company’s value lies in the<br />
high economic returns that we expect it to continue to generate in the future.<br />
As noted, appraised fair enterprise value is the sum of discounted economic profit and<br />
invested capital. From appraised fair enterprise value we subtract net debt to estimate the<br />
fair value of equity. We divided the fair value of equity by the number of shares to arrive at<br />
the intrinsic fair value per share. Based on long-run DEP analysis, and using our core<br />
assumption of a period of competitive advantage of 30 years, we thus estimate fair value per<br />
share for <strong>Saudi</strong> <strong>Ceramic</strong> at SAR166.3.<br />
Figure 11. <strong>Saudi</strong> <strong>Ceramic</strong>: discounted economic profit valuation<br />
(SAR '000)<br />
Discounted economic profit 3,283,376<br />
Opening Invested capital 1,553,867<br />
Appraised value of the enterprise 4,837,243<br />
Value of debt (739,985)<br />
Appraised value of the equity 4,157,269<br />
Number of shares 25,000<br />
Appraised share price 166.3<br />
Source: Company data, <strong>Al</strong> <strong>Rajhi</strong> <strong>Capital</strong><br />
We have considered<br />
comparative multiples analysis<br />
too<br />
We have selected two GCC<br />
ceramic companies as<br />
benchmark for <strong>Saudi</strong> <strong>Ceramic</strong><br />
In addition to long-run DEP, we have considered comparative multiples analysis to value<br />
<strong>Saudi</strong> <strong>Ceramic</strong> in relation to other players in the GCC region. Under this approach we<br />
estimate fair value using comparisons of valuation measures – notably, EV/EBITDA and PE<br />
multiples– with other listed GCC ceramic companies since <strong>Saudi</strong> <strong>Ceramic</strong> is the only listed<br />
ceramic company in <strong>Saudi</strong> Arabia. However, we have taken 100% weight on the long-run<br />
DEP method because it is theoretically more defensible.<br />
Regarding the comparative multiples analysis, we have selected two GCC ceramic companies<br />
as benchmarks. Those two companies are <strong>Al</strong> Anwar <strong>Ceramic</strong> Tiles and Ras <strong>Al</strong> Khaimah (Rak)<br />
<strong>Ceramic</strong>s. We believe that they provide excellent comparables considering that they are<br />
operating in the same region, and face almost the same macroeconomic factors. However, the<br />
relatively low liquidity in the non-<strong>Saudi</strong> GCC markets is a major concern that probably<br />
Disclosures Please refer to the important disclosures at the back of this report. 11
<strong>Saudi</strong> <strong>Ceramic</strong><br />
Construction & Materials –Industrial<br />
1 August 2010<br />
reduces the ratios for these companies. In addition, the other non-<strong>Saudi</strong> GCC markets have<br />
been more affected by global economic events over the past couple of years. This has<br />
decreased investors’ confidence in the non-<strong>Saudi</strong> GCC markets and contributed to relatively<br />
cheap stock prices. The table below shows the major valuation ratios for <strong>Al</strong> Anwar <strong>Ceramic</strong><br />
Tiles and Rak <strong>Ceramic</strong>s compared to <strong>Saudi</strong> <strong>Ceramic</strong>’s.<br />
Figure 12. <strong>Saudi</strong> <strong>Ceramic</strong>: comparative multiples analysis<br />
Coompany Market Sector MKT Cap P/E EV/EBITDA<br />
Bloomberg<br />
Code<br />
<strong>Al</strong> Anwar <strong>Ceramic</strong> Tiles MSM Construction & Materials $ 130 9.9 6.5 AACT OM<br />
Rak <strong>Ceramic</strong>s ADSM Real Estate $ 285 4.3 4.4 RAKCEC DH<br />
<strong>Saudi</strong> <strong>Ceramic</strong> KSA-Tadawul Building & construction $ 903 14.3 11.5 SCERCO AB<br />
Source: Bloomberg, <strong>Al</strong> <strong>Rajhi</strong> <strong>Capital</strong><br />
<strong>Saudi</strong> <strong>Ceramic</strong> still offers value<br />
despite its high PE and<br />
EV/EBITDA ratios<br />
We believe that <strong>Saudi</strong> <strong>Ceramic</strong> still offers value despite its high PE and EV/EBITDA ratios<br />
compared to <strong>Al</strong> Anwar <strong>Ceramic</strong> Tiles in Oman. <strong>Al</strong> Anwar produces only ceramic tiles, which<br />
as mentioned earlier enjoy higher margins than other ceramic products such as bathroom<br />
products and water heaters. While this fact probably supports a high valuation, <strong>Saudi</strong><br />
<strong>Ceramic</strong> operates in a larger market, with greater growth potential in a larger number of<br />
businesses; moreover, <strong>Saudi</strong> <strong>Ceramic</strong> is engaged in aggressive expansion that should drive its<br />
growth further. <strong>Saudi</strong> <strong>Ceramic</strong> is well above Rak <strong>Ceramic</strong>s in terms of PE and EV/EBITDA<br />
ratios. Rak <strong>Ceramic</strong>s has almost the same business lines except that it does not manufacture<br />
water heaters, which have low margins. Rak <strong>Ceramic</strong>s is suffering because of apparently<br />
un<strong>success</strong>ful expansion projects in different countries, and high financing costs that reduce<br />
its net margin.<br />
We expect <strong>Saudi</strong> <strong>Ceramic</strong> to concentrate more on ceramic tiles since its return is higher.<br />
Moreover, we expect the company to record an impressive increase in its earnings when its<br />
new expansion projects start commercial production.<br />
Risks associated with our assumptions<br />
It is important to mention that our valuation relies heavily on forecasts which are subject to<br />
errors. We have come up with several assumptions including growth, cost of capital, and<br />
market trend to predict future performance. We have tried to arrive at the most accurate<br />
assumptions; however, reality may deviate from our forecasts depending on new<br />
microeconomic or macroeconomic factors. Competition is another factor that can influence<br />
our assumptions. New entrants or/and transformation of current rivals’ business models<br />
might cause a change in the whole market, and hence in our overall assumptions and<br />
forecasts.<br />
Disclosures Please refer to the important disclosures at the back of this report. 12
<strong>Saudi</strong> <strong>Ceramic</strong><br />
Construction & Materials –Industrial<br />
1 August 2010<br />
Appendix:<br />
<strong>Saudi</strong> <strong>Ceramic</strong>’s investments<br />
SAR44.4mn investment in<br />
associate companies<br />
15.87% share in Natural Gas<br />
Distribution<br />
50% share in CPC<br />
CPC and <strong>Saudi</strong> <strong>Ceramic</strong> has<br />
the same input, i.e. clay<br />
<strong>Saudi</strong> <strong>Ceramic</strong> has some investments that are intended to increase the value of the operating<br />
business. <strong>Saudi</strong> <strong>Ceramic</strong> has a total of SAR44.4mn of investment in two associate companies,<br />
which are Natural Gas Distribution Company and <strong>Ceramic</strong> Pipes Company (CPC). The<br />
company does not have a controlling interest in either company. The company also has<br />
investments in available-for-sale securities of SAR9mn.<br />
Natural Gas Distribution Company<br />
Natural Gas Distribution Company is a limited liability company established in 2002 with<br />
paid up capital of SAR15mn. <strong>Saudi</strong> <strong>Ceramic</strong> has 15.87% of the share capital. The main<br />
activities of the associate are to purchase and distribute gas to factories in the Second<br />
Industrial City in Riyadh. Gas is an important material that is used to run kilns where clay is<br />
processed to produce ceramics. The investment is accounted for using the equity method<br />
because the company has significant influence over the investee by major representation in<br />
the board of directors.<br />
<strong>Ceramic</strong> Pipes Company<br />
<strong>Ceramic</strong> Pipes Company (CPC) is a closed joint stock company established in February 2007.<br />
<strong>Saudi</strong> <strong>Ceramic</strong> Company holds 50% of the share capital. The authorised and fully subscribed<br />
share capital is SAR100mn in which SAR80mn is paid up. The company has paid its share by<br />
contributing SAR25mn in cash and SAR15mn in kind, representing the value of a plot of land.<br />
The investment is accounted for using the equity method.<br />
The main activity of the company is manufacturing of clay pipes, which are used in<br />
connecting sewage systems. The sole customer of the company is the government. Clay pipes<br />
are expected to experience high demand because of the construction of government’s huge<br />
economic cities. However, there are other local competitors in the market such as <strong>Saudi</strong><br />
Vitrified Clay Pipe Company (SVCP), which is listed in <strong>Saudi</strong> stock market. CPC is purchasing<br />
clay from Desert Mines Company, which is a division of <strong>Saudi</strong> <strong>Ceramic</strong>. The company’s<br />
production capacity is 100,000 tons per year. We expect the company to start commercial<br />
production by the end of 2010. However, we expect the contribution of CPC to net income to<br />
be minor in 2010 and 2011.<br />
Disclosures Please refer to the important disclosures at the back of this report. 13
<strong>Saudi</strong> <strong>Ceramic</strong><br />
Construction & Materials –Industrial<br />
1 August 2010<br />
We expect revenues to reach<br />
SAR1,103mn this year<br />
Income Statement (SARmn) 12/08A 12/09A 12/10E 12/11E 12/12E<br />
Revenue 857 958 1,129 1,356 1,551<br />
Cost of Goods Sold (537) (605) (708) (841) (946)<br />
Gross Profit 321 352 421 515 605<br />
Government Charges<br />
S.G. & A. Costs (138) (156) (177) (217) (248)<br />
Operating EBIT 183 197 245 298 357<br />
Cash Operating Costs (598) (675) (786) (941) (1,062)<br />
EBITDA 259 282 344 415 488<br />
Depreciation and Amortisation (77) (86) (99) (117) (131)<br />
Operating Profit 183 197 245 298 357<br />
Net financing income/(costs) 2 4 (2) (12) (13)<br />
Forex and Related Gains<br />
Provisions - - - - -<br />
Other Income<br />
Other Expenses<br />
Net Profit Before Taxes 185 200 243 286 344<br />
Taxes (7) (3) (6) (7) (9)<br />
Minority Interests<br />
Net profit available to shareholders 178 197 236 279 335<br />
Dividends (63) (75) (75) (75) (75)<br />
Transfer to <strong>Capital</strong> Reserve<br />
We expect steady dividends for<br />
the next three years<br />
We expect <strong>Saudi</strong> <strong>Ceramic</strong> to<br />
maintain its strong sales growth<br />
over the next three years<br />
Consistent margins and strong<br />
margins<br />
12/08A 12/09A 12/10E 12/11E 12/12E<br />
Adjusted Shares Out (mn) 25.00 25.00 25.00 25.00 25.00<br />
CFPS (SAR) 10.18 11.32 13.41 15.83 18.67<br />
EPS (SAR) 7.12 7.89 9.45 11.17 13.41<br />
DPS (SAR) 2.500 3.000 3.000 3.000 3.000<br />
Growth 12/08A 12/09A 12/10E 12/11E 12/12E<br />
Revenue Growth 39.4% 11.7% 17.9% 20.1% 14.3%<br />
Gross Profit Growth 42.2% 10.0% 19.5% 22.3% 17.4%<br />
EBITDA Growth 47.0% 8.9% 21.7% 20.7% 17.6%<br />
Operating Profit Growth 55.2% 7.6% 24.4% 21.9% 19.5%<br />
Net Profit Growth 39.5% 10.8% 19.9% 18.1% 20.1%<br />
EPS Growth 39.5% 10.8% 19.9% 18.1% 20.1%<br />
Margins 12/08A 12/09A 12/10E 12/11E 12/12E<br />
Gross profit margin 37.4% 36.8% 37.3% 38.0% 39.0%<br />
EBITDA margin 30.3% 29.5% 30.4% 30.6% 31.5%<br />
Operating Margin 21.3% 20.5% 21.7% 22.0% 23.0%<br />
Pretax profit margin 21.6% 20.9% 21.5% 21.1% 22.2%<br />
Net profit margin 20.8% 20.6% 20.9% 20.6% 21.6%<br />
Other Ratios 12/08A 12/09A 12/10E 12/11E 12/12E<br />
ROCE 16.4% 15.5% 16.1% 16.3% 16.8%<br />
ROIC 15.9% 13.9% 15.3% 15.4% 15.8%<br />
ROE 26.6% 24.9% 25.2% 24.9% 24.8%<br />
Effective Tax Rate 3.8% 1.5% 2.6% 2.5% 2.5%<br />
Capex/Sales 28.7% 28.0% 24.9% 26.0% 23.0%<br />
Dividend Payout Ratio 35.1% 38.0% 31.7% 26.9% 22.4%<br />
We expect EV/EBITDA &<br />
EV/sales to decline<br />
Valuation Measures 12/08A 12/09A 12/10E 12/11E 12/12E<br />
P/E (x) 19.7 17.8 14.8 12.6 10.5<br />
P/CF (x) 13.8 12.4 10.5 8.9 7.5<br />
P/B (x) 4.8 4.1 3.4 2.9 2.4<br />
EV/Sales (x) 4.6 4.1 3.6 3.1 2.8<br />
EV/EBITDA (x) 15.1 13.9 11.8 10.2 8.8<br />
EV/EBIT (x) 21.5 19.9 16.6 14.2 12.0<br />
EV/IC (x) 2.8 2.5 2.2 1.9 1.7<br />
Dividend Yield 1.8% 2.1% 2.1% 2.1% 2.1%<br />
Source: Company data, <strong>Al</strong> <strong>Rajhi</strong> <strong>Capital</strong><br />
Disclosures Please refer to the important disclosures at the back of this report. 14
<strong>Saudi</strong> <strong>Ceramic</strong><br />
Construction & Materials –Industrial<br />
1 August 2010<br />
Expanding balance sheet due<br />
to expansion in operations<br />
Debt/equity is quite high but<br />
financing cost is relatively low<br />
<strong>Saudi</strong> <strong>Ceramic</strong>’s cash flow<br />
position is strong<br />
We estimate capex/sales at<br />
around 23-28% over the next<br />
three years<br />
Balance Sheet (SARmn) 12/08A 12/09A 12/10E 12/11E 12/12E<br />
Cash and Cash Equivalents 25 36 124 90 100<br />
Current Receivables 108 109 120 170 202<br />
Inventories 351 357 421 509 558<br />
Other current assets 28 28 35 35 35<br />
Total Current Assets 512 530 701 804 895<br />
Fixed Assets 1,004 1,176 1,358 1,594 1,819<br />
Investments 47 60 52 52 52<br />
Goodwill<br />
Other Intangible Assets - - - - -<br />
Total Other Assets 2 2 2 2 2<br />
Total Non-current Assets 1,053 1,237 1,412 1,648 1,873<br />
Total Assets 1,565 1,767 2,113 2,452 2,768<br />
Short Term Debt 281 289 364 364 364<br />
Trade Payables<br />
Dividends Payable - - - - -<br />
Other Current Liabilities<br />
Total Current Liabilities 423 469 558 582 605<br />
Long-Term Debt 392 406 500 611 643<br />
Other LT Payables 1 0 1 1 1<br />
Provisions 25 33 36 36 36<br />
Total Non-current Liabilities 418 439 537 647 679<br />
Minority interests<br />
Paid-up share capital 250 250 250 250 250<br />
Total Reserves 474 609 769 973 1,234<br />
Total Shareholders' Equity 724 859 1,019 1,223 1,484<br />
Total Equity 724 859 1,019 1,223 1,484<br />
Total Liabilities & Shareholders' Equity 1,565 1,767 2,113 2,452 2,768<br />
Ratios 12/08A 12/09A 12/10E 12/11E 12/12E<br />
Net Debt (SARmn) 647 659 740 885 907<br />
Net Debt/EBITDA (x) 2.49 2.33 2.15 2.13 1.86<br />
Net Debt to Equity 89.3% 76.8% 72.6% 72.3% 61.1%<br />
EBITDA Interest Cover (x) (120.2) (80.7) 161.4 34.7 38.5<br />
BVPS (SAR) 28.97 34.35 40.76 48.93 59.35<br />
Cashflow Statement (SARmn) 12/08A 12/09A 12/10E 12/11E 12/12E<br />
Net Income before Tax & Minority Interest 184.9 200.2 242.6 286.4 344.0<br />
Depreciation & Amortisation 76.7 85.8 99.0 116.7 131.5<br />
Decrease in Working <strong>Capital</strong> (90.4) 15.2 (64.6) (113.4) (57.2)<br />
Other Operating Cashflow (3.4) 2.7 (4.5) (7.2) (8.6)<br />
Cashflow from Operations 167.8 303.8 272.5 282.5 409.6<br />
<strong>Capital</strong> Expenditure (246.3) (268.1) (281.7) (352.6) (356.6)<br />
New Investments (23.8) 1.5 11.2 0.0 0.0<br />
Others<br />
Cashflow from investing activities (270.1) (266.5) (270.5) (352.6) (356.6)<br />
Net Operating Cashflow (102.3) 37.3 2.0 (70.0) 53.0<br />
Dividends paid to ordinary shareholders (62.1) (64.5) (75.9) (75.0) (75.0)<br />
Proceeds from issue of shares<br />
Effects of Exchange Rates on Cash<br />
Other Financing Cashflow (1.8) 0.0 0.0 0.0 0.0<br />
Cashflow from financing activities 106.7 (26.9) 86.7 35.5 (43.0)<br />
Total cash generated 4.5 10.4 88.8 (34.5) 10.0<br />
Cash at beginning of period 20.9 25.3 35.7 124.5 90.0<br />
Implied cash at end of year 25.3 35.7 124.5 90.0 100.0<br />
Ratios 12/08A 12/09A 12/10E 12/11E 12/12E<br />
Capex/Sales 28.7% 28.0% 24.9% 26.0% 23.0%<br />
Source: Company data, <strong>Al</strong> <strong>Rajhi</strong> <strong>Capital</strong><br />
Disclosures Please refer to the important disclosures at the back of this report. 15
<strong>Saudi</strong> <strong>Ceramic</strong><br />
Construction & Materials –Industrial<br />
1 August 2010<br />
Disclaimer and additional disclosures for Equity Research<br />
Disclaimer<br />
This research document has been prepared by <strong>Al</strong> <strong>Rajhi</strong> <strong>Capital</strong> Company (“<strong>Al</strong> <strong>Rajhi</strong> <strong>Capital</strong>”) of Riyadh, <strong>Saudi</strong> Arabia. It has been prepared<br />
for the general use of <strong>Al</strong> <strong>Rajhi</strong> <strong>Capital</strong>’s clients and may not be redistributed, retransmitted or disclosed, in whole or in part, or in any form or<br />
manner, without the express written consent of <strong>Al</strong> <strong>Rajhi</strong> <strong>Capital</strong>. Receipt and review of this research document constitute your agreement<br />
not to redistribute, retransmit, or disclose to others the contents, opinions, conclusion, or information contained in this document prior to<br />
public disclosure of such information by <strong>Al</strong> <strong>Rajhi</strong> <strong>Capital</strong>. The information contained was obtained from various public sources believed to be<br />
reliable but we do not guarantee its accuracy. <strong>Al</strong> <strong>Rajhi</strong> <strong>Capital</strong> makes no representations or warranties (express or implied) regarding the<br />
data and information provided and <strong>Al</strong> <strong>Rajhi</strong> <strong>Capital</strong> does not represent that the information content of this document is complete, or free<br />
from any error, not misleading, or fit for any particular purpose. This research document provides general information only. Neither the<br />
information nor any opinion expressed constitutes an offer or an invitation to make an offer, to buy or sell any securities or other investment<br />
products related to such securities or investments. It is not intended to provide personal investment advice and it does not take into account<br />
the specific investment objectives, financial situation and the particular needs of any specific person who may receive this document.<br />
Investors should seek financial, legal or tax advice regarding the appropriateness of investing in any securities, other investment or<br />
investment strategies discussed or recommended in this document and should understand that statements regarding future prospects may<br />
not be realized. Investors should note that income from such securities or other investments, if any, may fluctuate and that the price or value<br />
of such securities and investments may rise or fall. Fluctuations in exchange rates could have adverse effects on the value of or price of, or<br />
income derived from, certain investments. Accordingly, investors may receive back less than originally invested. <strong>Al</strong> <strong>Rajhi</strong> <strong>Capital</strong> or its<br />
officers or one or more of its affiliates (including research analysts) may have a financial interest in securities of the issuer(s) or related<br />
investments, including long or short positions in securities, warrants, futures, options, derivatives, or other financial instruments. <strong>Al</strong> <strong>Rajhi</strong><br />
<strong>Capital</strong> or its affiliates may from time to time perform investment banking or other services for, solicit investment banking or other business<br />
from, any company mentioned in this research document. <strong>Al</strong> <strong>Rajhi</strong> <strong>Capital</strong>, together with its affiliates and employees, shall not be liable for<br />
any direct, indirect or consequential loss or damages that may arise, directly or indirectly, from any use of the information contained in this<br />
research document.<br />
This research document and any recommendations contained are subject to change without prior notice. <strong>Al</strong> <strong>Rajhi</strong> <strong>Capital</strong> assumes no<br />
responsibility to update the information in this research document. Neither the whole nor any part of this research document may be altered,<br />
duplicated, transmitted or distributed in any form or by any means. This research document is not directed to, or intended for distribution to<br />
or use by, any person or entity who is a citizen or resident of or located in any locality, state, country or other jurisdiction where such<br />
distribution, publication, availability or use would be contrary to law or which would subject <strong>Al</strong> <strong>Rajhi</strong> <strong>Capital</strong> or any of its affiliates to any<br />
registration or licensing requirement within such jurisdiction.<br />
Additional disclosures<br />
1. Explanation of <strong>Al</strong> <strong>Rajhi</strong> <strong>Capital</strong>’s rating system<br />
<strong>Al</strong> <strong>Rajhi</strong> <strong>Capital</strong> uses a three-tier rating system based on absolute upside or downside potential for all stocks under its coverage except<br />
financial stocks and those few other companies not compliant with Islamic Shariah law:<br />
"Overweight": Our target price is more than 15% above the current share price, and we expect the share price to reach the target on a 6-9<br />
month time horizon.<br />
"Neutral": We expect the share price to settle at a level between 5% below the current share price and 15% above the current share price<br />
on a 6-9 month time horizon.<br />
"Underweight": Our target price is more than 5% below the current share price, and we expect the share price to reach the target on a 6-9<br />
month time horizon.<br />
2. Definitions<br />
"Time horizon": Our analysts make recommendations on a 6-9 month time horizon. In other words, they expect a given stock to reach their<br />
target price within that time.<br />
"Fair value": We estimate fair value per share for every stock we cover. This is normally based on widely accepted methods appropriate to<br />
the stock or sector under consideration, e.g. DCF (discounted cash flow) or SoTP (sum of the parts) analysis.<br />
"Target price": This may be identical to estimated fair value per share, but is not necessarily the same. There may be very good reasons<br />
why a share price is unlikely to reach fair value within our time horizon. In such a case we set a target price which differs from estimated fair<br />
value per share, and explain our reasons for doing so.<br />
Please note that the achievement of any price target may be impeded by general market and economic trends and other external factors, or<br />
if a company’s profits or operating performance exceed or fall short of our expectations.<br />
Contact us<br />
Dr. Saleh <strong>Al</strong>suhaibani<br />
Head of Research<br />
Tel : +966 1 2119434<br />
alsuhaibanis@alrajhi-capital.com<br />
<strong>Al</strong> <strong>Rajhi</strong> <strong>Capital</strong><br />
Research Department<br />
Head Office, King Fahad Road<br />
P.O. Box 5561<br />
Riyadh 11432<br />
Kingdom of <strong>Saudi</strong> Arabia<br />
Email: research@alrajhi-capital.com<br />
<strong>Al</strong> <strong>Rajhi</strong> <strong>Capital</strong>, a subsidiary of <strong>Al</strong> <strong>Rajhi</strong> Bank, is licensed by the <strong>Saudi</strong> Arabian <strong>Capital</strong> Market<br />
Authority, License No. 07068/37.<br />
Disclosures Please refer to the important disclosures at the back of this report. 16