Retail Sector Report - Al Rajhi Capital
Retail Sector Report - Al Rajhi Capital
Retail Sector Report - Al Rajhi Capital

You also want an ePaper? Increase the reach of your titles
YUMPU automatically turns print PDFs into web optimized ePapers that Google loves.
Saudi <strong>Retail</strong> <strong>Sector</strong><br />
<strong>Retail</strong> –Industrial<br />
Saudi Arabia<br />
05 January 2013<br />
January 18, 2010<br />
US$ 5.7 bn 73% US$4.2mn<br />
Market cap Free float Avg. daily volume<br />
Target mkt cap 23,942.8 12.0% over current<br />
Consensus mkt cap. 23,107.4 8.1% over current<br />
Current mkt cap. 21,368.1 as at 02/01/2013<br />
Research Department<br />
Majed <strong>Al</strong> Solaim<br />
Tel +966 1211 9471, alsolaimm@alrajhi-capital.com<br />
Underweight Neutral Overweight<br />
Overweight<br />
Key themes<br />
Driven by rising population, improving education,<br />
and changing lifestyle, we expect the retail sector in<br />
Saudi Arabia to continue growing. We expect bigbox<br />
retail formats and established players to flourish<br />
in the Kingdom, even as online sales gradually<br />
penetrate. We believe the retail market to spread<br />
beyond Riyadh and Jeddah and retailers will have to<br />
focus more on building relationships with its<br />
customers as competition intensifies.<br />
Implications<br />
We initiate coverage on Extra with an Overweight<br />
rating. We upgrade our target price for Jarir but<br />
maintain our Neutral rating. We also upgrade our<br />
target price for <strong>Al</strong>hokair after its impressive results in<br />
Q3 2012. On the other hand, we lower our target<br />
price for <strong>Al</strong>othaim. However we maintain an<br />
Overweight rating on both <strong>Al</strong>hokair and <strong>Al</strong>othaim.<br />
What do we think?<br />
Stock Rating Price Target<br />
Extra Overweight SAR123.5<br />
<strong>Al</strong>hokair Overweight SAR124.1<br />
<strong>Al</strong>othaim Overweight SAR96.7<br />
Jarir Neutral SAR168.6<br />
Why do we think it?<br />
Stock 3 year EBITDA CAGR* 2013 EV/EBITDA<br />
Extra 12.42% 11.6x<br />
<strong>Al</strong>hokair 9.80% 9.0x<br />
<strong>Al</strong>othaim 14.80% 5.7x<br />
Jarir 8.71% 14.6x<br />
*2012-2015<br />
Where are we versus consensus?<br />
200<br />
150<br />
100<br />
50<br />
0<br />
SAR<br />
Extra <strong>Al</strong>hokair <strong>Al</strong>othaim Jarir<br />
Current Consensus ARC<br />
Source: Company data, <strong>Al</strong> <strong>Rajhi</strong> <strong>Capital</strong><br />
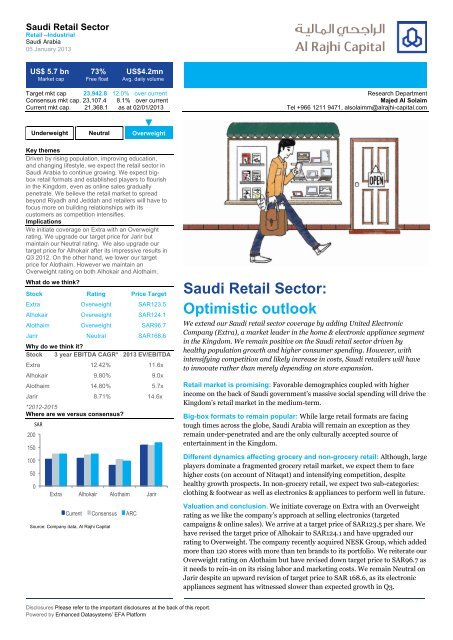
Saudi <strong>Retail</strong> <strong>Sector</strong>:<br />
Optimistic outlook<br />
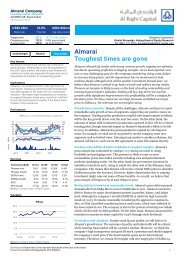
We extend our Saudi retail sector coverage by adding United Electronic<br />
Company (Extra), a market leader in the home & electronic appliance segment<br />
in the Kingdom. We remain positive on the Saudi retail sector driven by<br />
healthy population growth and higher consumer spending. However, with<br />
intensifying competition and likely increase in costs, Saudi retailers will have<br />
to innovate rather than merely depending on store expansion.<br />
<strong>Retail</strong> market is promising: Favorable demographics coupled with higher<br />
income on the back of Saudi government’s massive social spending will drive the<br />
Kingdom’s retail market in the medium-term.<br />
Big-box formats to remain popular: While large retail formats are facing<br />
tough times across the globe, Saudi Arabia will remain an exception as they<br />
remain under-penetrated and are the only culturally accepted source of<br />
entertainment in the Kingdom.<br />
Different dynamics affecting grocery and non-grocery retail: <strong>Al</strong>though, large<br />
players dominate a fragmented grocery retail market, we expect them to face<br />
higher costs (on account of Nitaqat) and intensifying competition, despite<br />
healthy growth prospects. In non-grocery retail, we expect two sub-categories:<br />
clothing & footwear as well as electronics & appliances to perform well in future.<br />
Valuation and conclusion. We initiate coverage on Extra with an Overweight<br />
rating as we like the company’s approach at selling electronics (targeted<br />
campaigns & online sales). We arrive at a target price of SAR123.5 per share. We<br />
have revised the target price of <strong>Al</strong>hokair to SAR124.1 and have upgraded our<br />
rating to Overweight. The company recently acquired NESK Group, which added<br />
more than 120 stores with more than ten brands to its portfolio. We reiterate our<br />
Overweight rating on <strong>Al</strong>othaim but have revised down target price to SAR96.7 as<br />
it needs to rein-in on its rising labor and marketing costs. We remain Neutral on<br />
Jarir despite an upward revision of target price to SAR 168.6, as its electronic<br />
appliances segment has witnessed slower than expected growth in Q3.<br />
Disclosures Please refer to the important disclosures at the back of this report.<br />
Powered by Enhanced Datasystems’ EFA Platform
Saudi <strong>Retail</strong> <strong>Sector</strong><br />
<strong>Retail</strong> –Industrial<br />
05 January 2013<br />
Saudi economy has benefited<br />
from high oil prices and exports<br />
for most of 2012<br />
<strong>Retail</strong> is promising:<br />
growing despite challenges<br />
A strong economy moving away from oil<br />
The MENA region is expected to remain one of the few bright spots for global GDP growth in<br />
2012, even as the global economic recovery remains uncertain with a deepening financial<br />
crisis in Europe and a slowdown in the US as well as emerging Asian markets like China and<br />
India. According to the IMF’s update in July 2012, GDP growth in the MENA region will be<br />
higher by 200bps y-o-y in 2012 at 5.5% vs. decline of 20bps (advanced economies) to 340bps<br />
(Central and Eastern Europe), mainly due to higher oil production. As the global leader in oil<br />
exports, Saudi Arabia has been a beneficiary of the high crude prices witnessed in the first<br />
half of 2012. <strong>Al</strong>though crude oil production from the Kingdom has moderated after it peaked<br />
in June 2012 at 10.1mbpd, it continues to be at elevated levels.<br />
Figure 1 Crude oil production are at elevated levels<br />
mbpd<br />
10.5<br />
Figure 2 Smaller sectors are growing faster<br />
40%<br />
10.0<br />
20%<br />
9.5<br />
9.0<br />
0%<br />
8.5<br />
-20%<br />
8.0<br />
7.5<br />
Jan-11 Apr-11 Jul-11 Oct-11 Jan-12 Apr-12 Jul-12 Oct-12<br />
Source: OPEC, <strong>Al</strong> <strong>Rajhi</strong> <strong>Capital</strong><br />
Source: Bloomberg, <strong>Al</strong> <strong>Rajhi</strong> <strong>Capital</strong><br />
Market Cap 1-year growth<br />
Performance 1-year growth<br />
The Saudi economy, with real GDP at SAR942bn in 2011, (source: IMF with 1999 as base<br />
year) has been growing strong thanks to its rising oil exports even as countries in the<br />
developed world continue to struggle. <strong>Al</strong>though the IMF expects the Kingdom’s real GDP<br />
growth to remain at moderate levels (6% in 2012 vs. 7% in 2011), it remains better than<br />
developed economies and comparable to the emerging economies of Asia. Even at the<br />
regional level, Saudi Arabia has remained relatively unscathed from the uprisings witnessed<br />
in other countries in the MENA region. This is mainly due to the massive social spending<br />
activities worth SAR1.4tn being carried out by the Saudi government over 2010-2014 as per<br />
the ninth five-year development plan.<br />
The Saudi government has<br />
been using its export surpluses<br />
for increased social spending<br />
The Saudi government has allocated SAR250bn for building 500,000 new affordable housing<br />
units for low income Saudis. A new Saudization program (Nitaqat) aimed at increasing the<br />
employment of Saudi citizens in the private sector came into effect in late 2011, which has<br />
been supported by job placement and training schemes. A decree was passed in 2011 to<br />
increase the minimum wages for all public sector employees to SAR3,000 per month. Further,<br />
in January 2012, an unemployment allowance (Hafiz) of SAR2,000 per month was<br />
introduced, which the Ministry of Labor has estimated to cost around SAR5.5bn per annum<br />
for the Saudi government. We believe this massive social spending will generate employment<br />
opportunities leading to higher disposable income levels for Saudi citizens, which will<br />
gradually trickle down to various sectors such as retail.<br />
Apart from the social spending, the surpluses generated from oil exports are also being<br />
ploughed back to diversify the country’s economy. This has led to the development of new<br />
sectors such as agriculture, retail, and real estate which are growing at a faster pace as<br />
compared to other bellwether sectors such as petrochemicals and banking. We view this as a<br />
positive development for the long-term economic growth of the Kingdom. <strong>Al</strong>though this may<br />
indicate slower growth than in the past, it will pave the way for a much more vibrant and<br />
diversified economy.<br />
Disclosures Please refer to the important disclosures at the back of this report. 2
Saudi <strong>Retail</strong> <strong>Sector</strong><br />
<strong>Retail</strong> –Industrial<br />
05 January 2013<br />
Demographics continue to fuel retail growth<br />
Saudi Arabia is the largest market in the GCC region with a population of about 28mn in 2011<br />
(source: Central Department of Statistics and Information). The EIU forecasts this<br />
population to nearly double to 50mn by 2030. Further, it is pertinent to mention that 32% of<br />
the Saudi population is below 15 years of age, while around 50% are in the age group of 15-40<br />
(source: 2010 UN statistics). This young population is exposed to improving educational<br />
opportunities and a changing lifestyle aligned to modern technologies and western culture.<br />
In addition, the country has witnessed a steady growth in personal disposable income level,<br />
which bodes well for consumer sectors such as electronics, grocery and apparel retail. Higher<br />
level of disposable income in the hands of a young population is creating increased demand<br />
for better quality and diversified products, more number of supermarkets and hypermarkets,<br />
and the entry of a slew of foreign brands in the country.<br />
Figure 3 Saudi Arabia has a young population profile<br />
Figure 4 Rising disposable income leading to higher consumption<br />
80+<br />
0.1<br />
US$<br />
10,000<br />
Title:<br />
Source:<br />
60-79<br />
1.0<br />
8,000<br />
Please fill in the values above to have them entered in your report<br />
45-59<br />
3.0<br />
6,000<br />
30-44<br />
6.9<br />
15-29<br />
7.1<br />
4,000<br />
0-14<br />
8.5<br />
0 2 4 6 8 10<br />
Population in mn<br />
2,000<br />
2007 2008 2009 2010 2011E 2012E 2013E 2014E 2015E 2016E<br />
Personal disposable income*<br />
Household consumption<br />
Source: UNSD, <strong>Al</strong> <strong>Rajhi</strong> <strong>Capital</strong>; Note: Data is as of 2010 Source: EIU, CDSI, <strong>Al</strong> <strong>Rajhi</strong> <strong>Capital</strong>; Note:*EIU estimates from 2009<br />
<strong>Al</strong>though the Saudi retail sector dwarfs in comparison to other mainstream sectors such as oil<br />
and petrochemicals, the EIU estimates the country’s retail sector sales to be around<br />
US$83.3bn in 2011, which is expected to grow at a healthy CAGR of 9.5% over 2011-2016 to<br />
reach US$131.2bn. Further, the number of supermarkets grew from 80 in 1984 to 450 by<br />
2009 and continues to grow. There are currently around 60 hypermarkets spread across the<br />
major cities of Riyadh, Jeddah and Dammam (source: USDA).<br />
Big-box formats to usher in the next level of growth<br />
Supermarkets and<br />
hypermarkets will grow faster<br />
than small groceries<br />
Small convenience stores will be gradually phased out<br />
The retail sector in Saudi Arabia, though bigger in size, is still evolving as compared to a<br />
country like the UAE, where it is much more developed due to the latter’s history of being a<br />
trading hub. <strong>Al</strong>though big-box retail formats (supermarkets and hypermarkets) have sprungup<br />
in Saudi Arabia, they remain relatively under-penetrated compared to other global<br />
markets. Small convenience stores called “bakalas” currently dominate the retail sector with<br />
around 59% of the market share.<br />
We believe big-box formats will become more popular going forward due to their cost<br />
effectiveness (trading in large volumes lead to better margins) on the supply side and<br />
convenience (availability of diverse products and brands, discounts, comfort to choose) on<br />
the demand side. Savola, <strong>Al</strong>othaim, Fawaz <strong>Al</strong> Hokair (<strong>Al</strong>hokair), Bin Dawood, Tamimi<br />
(Safeway), Saudi Marketing Company (Farm Superstores) and the UAE-based Majid <strong>Al</strong><br />
Futtaim in partnership with France’s Carrefour are among the top retailers in the Kingdom.<br />
Apart from these large players, the market consists of numerous small players, rendering the<br />
retail sector highly fragmented and ripe for consolidation. <strong>Al</strong>hokair’s acquisition of NESK<br />
Group (it operates 120 retail stores across the Kingdom) for SAR730mn in August 2012 is an<br />
indication of this growing trend.<br />
Disclosures Please refer to the important disclosures at the back of this report. 3
Saudi <strong>Retail</strong> <strong>Sector</strong><br />
<strong>Retail</strong> –Industrial<br />
05 January 2013<br />
Figure 5 New format retail stores are under-penetrated<br />
Figure 6 Share of Top 5 players in the retail market<br />
100%<br />
70%<br />
80%<br />
15%<br />
25%<br />
19%<br />
60%<br />
59%<br />
59%<br />
24%<br />
50%<br />
60%<br />
40%<br />
36%<br />
62%<br />
40%<br />
30%<br />
33%<br />
25%<br />
57%<br />
20%<br />
0%<br />
39%<br />
23%<br />
16%<br />
Saudi Arabia Spain UK UAE<br />
Hypermarkets Supermarkets Small groceries<br />
20%<br />
10%<br />
0%<br />
15%<br />
Saudi Arabia Brazil UK<br />
Source: Savola investor presentation<br />
Source: Savola investor presentation<br />
Large formats to gain from the Kingdom’s demography<br />
Sales in big-box stores in the US and developed countries of Western Europe have been<br />
severely impacted with consumers switching to a savings mode due to the macro-economic<br />
slump in these countries. While the baby boomer generation has begun to age, the current<br />
young generation prefers to marry late and delay the arrival of children. These factors have<br />
reduced demand for consumer goods in the developed markets. Moreover, consumers are<br />
using online shopping to make comparisons and avail the best offers from retailers. Hence,<br />
large stores, which were earlier seen as efficient due to their scale of operations, are now<br />
becoming costly due to an inventory pile-up.<br />
Large stores are the only<br />
culturally accepted source of<br />
entertainment in the Kingdom<br />
Saudi Arabia provides one of<br />
the best environments in the<br />
MENA region for international<br />
retailers<br />
However, in Saudi Arabia, we believe the economic and cultural environment is conducive for<br />
large stores to thrive. Apart from the strong growth scenario as discussed earlier, large malls<br />
act as the only source of entertainment in the form of shopping and dining, which is<br />
culturally acceptable in the Kingdom. Supermarkets and hypermarkets with in-house<br />
facilities such as restaurants and theme parks are ideal locations for the Saudi population to<br />
relax along with their families. We believe this cultural connection coupled with the healthy<br />
income of a young population, will bring in more footfalls for the big-box formats over the<br />
medium to long-term. Moreover, there are other factors due to which online retail will take<br />
some time to catch-up in the Kingdom.<br />
International and regional retailers to increase their presence<br />
Leading retailers in the mature markets of the US and Europe are facing declining sales and<br />
profits in their domestic markets, which are their largest source of income. With growth<br />
expected to remain negative or at best at low single-percentage levels in their countries over<br />
the medium-term, retailers can reverse their fortunes only by expanding abroad. This idea is<br />
being promoted by leading built asset consultancy firm EC Harris in its first annual <strong>Retail</strong><br />
International Program Expansion (RIPE) Index published in September 2012. According to<br />
the index, Saudi Arabia, Qatar, and the UAE offer attractive opportunities in the Middle East<br />
among international destinations. While these countries ranked 8 th , 11 th and 15 th respectively<br />
globally, they held the 1 st , 2 nd and 3 rd positions in the MENA region.<br />
Further, the presence of strong local trading partners and franchise operators in these<br />
countries implies lower-cost and ease of scalability for western retailers. We believe Saudi<br />
companies such as Savola, <strong>Al</strong>hokair, and <strong>Al</strong>othaim can also provide similar, if not better<br />
benefits and synergies to international retailers, who want to enter Saudi Arabia. Large<br />
regional retailers such as Majid <strong>Al</strong> Futtaim, <strong>Al</strong> Tayer, Landmark Group, Chalhoub Group and<br />
<strong>Al</strong>shaya have also been attracted by the growth opportunities available in the Kingdom. In<br />
June 2012, the EMKE Group opened its popular Lulu brand hypermarket in Riyadh, and is<br />
planning to open more stores over the next couple of years.<br />
Disclosures Please refer to the important disclosures at the back of this report. 4
Saudi <strong>Retail</strong> <strong>Sector</strong><br />
<strong>Retail</strong> –Industrial<br />
05 January 2013<br />
While the increasing presence of international and regional players will intensify competition,<br />
we believe it will lead to an influx of brands, product diversification, attractive pricing and<br />
efficient operations, which will in turn benefit consumers. Large retail formats, that can<br />
house multiple brands under one roof, will be able to capture more market share rather than<br />
smaller stores with limited offerings.<br />
Increasing number of malls will<br />
lead to a decline in rental rates<br />
Steady supply of malls to lower retail rental rates<br />
<strong>Retail</strong> space is expanding in both Riyadh and Jeddah as new large retail malls are set up.<br />
Consequently, we believe rental rates are set to decline slightly, while poorly performing<br />
malls will see higher vacancy rates. This scenario implies lower costs and in turn better profit<br />
margins for those retailers who lease out their space over the next few quarters.<br />
According to Jones Lang LaSalle (JLL), the average rental value of retail space in Riyadh has<br />
increased to SAR2,520 per sq m per annum at the end of Q3 2012 after remaining unchanged,<br />
over the past three quarters, at SAR2,380 per sq m per annum. Rents in the malls located in<br />
prime locations are expected to rise in Q4 2012. However, average retail rental rates are<br />
expected to witness limited increase on account of downward pressure from lower rentals of<br />
malls not located in prime locations. Further, the mixed-use King Abdullah Financial District<br />
(KAFD) and Nakheel Mall are the next major quality retail projects which are expected to be<br />
delivered in 2014. We believe these will keep retail rental as well as occupancy rates in check<br />
in the traditional districts of Olaya, Malaz and Bathaa. Total mall space in Riyadh is expected<br />
to reach 1.5mn sq m by 2015 from 1.2mn sq m currently.<br />
Figure 7 Riyadh retail forecasts at the end of Q3 2012 Figure 8 Jeddah retail forecasts at the end of Q3 2012<br />
'000 sq m<br />
2,000<br />
'000 sq m<br />
1,200<br />
1,600<br />
1,200<br />
800<br />
800<br />
400<br />
400<br />
0<br />
2011 2012E 2013E 2014E 2015E<br />
0<br />
2011 2012E 2013E 2014E 2015E<br />
Completed Stock<br />
Future Supply<br />
Completed Stock<br />
Future Supply<br />
Source: Jones Long LaSalle, <strong>Al</strong> <strong>Rajhi</strong> <strong>Capital</strong><br />
Source: Jones Lang LaSalle, <strong>Al</strong> <strong>Rajhi</strong> <strong>Capital</strong><br />
At the end of Q3 2012, average rental rates for retail space in Jeddah increased slightly to<br />
SAR2,394 per sq m per annum from SAR2,380 per sq m per annum in Q2 2012(source: JLL).<br />
Apart from the Flamingo Mall on Prince Majid Road (80% pre-leased) with a retail area of<br />
46,000 sq m to be completed by in early 2013, no major retail space is expected to be added.<br />
As a result, average mall vacancy rates have remained quite low at 4% in Jeddah as compared<br />
to 11% in Riyadh due to healthy demand. There remains strong demand in the north and<br />
north-east of Jeddah to cater to the planned residential growth in this area. The central<br />
Jeddah region, such as Tahliyah, is also witnessing good demand on account of the high<br />
population density in the region. Hence, rental rates are expected to appreciate in the nearterm.<br />
However, with more than 70,000 sq m expected to be added to the total retail stock<br />
every year from 2013 onward, rental rates are expected to come down over the long-term.<br />
Religious tourism will provide<br />
support to Saudi retail growth<br />
story<br />
<strong>Retail</strong> growth to spread beyond Riyadh and Jeddah<br />
Apart from the growth in Riyadh and Jeddah, the retail sector is also expected to expand to<br />
other cities in the country spreading the growth more evenly across the country. The twin<br />
holy cities of Mecca and Medina, in particular, will witness considerable growth in retail<br />
space. <strong>Al</strong>though both the holy cities witness an influx of nearly 10mn pilgrims every year,<br />
they have traditionally seen limited retail facilities as compared to Riyadh and Jeddah. This<br />
trend is set to change with large facilities under construction in both the holy cities.<br />
Disclosures Please refer to the important disclosures at the back of this report. 5
Saudi <strong>Retail</strong> <strong>Sector</strong><br />
<strong>Retail</strong> –Industrial<br />
05 January 2013<br />
The Jabal Omar Development Company is developing a massive hotel and retail project on a<br />
2.2mn sq m land in Mecca near the Grand Mosque, which is scheduled to be completed over<br />
the next five years. The project, being the largest in the Kingdom, will be executed in phases<br />
at a cost of SAR20bn and shall add 38 hotel towers and a retail space of 89,000 sq m. In<br />
Medina, the King Abdullah Waqf project will add around 10,000 sq m of retail space. The<br />
store rents in shopping centers such as the Abraj al Bayt in Mecca are already 50-100%<br />
higher than that of premium locations in Riyadh or Jeddah, indicating the attractiveness and<br />
business potential of the holy cities.<br />
Online retail is yet to catch the<br />
fancy of the people due to a<br />
number of factors<br />
Online sales yet to catch-up<br />
Online retail sales still remain under-developed in the Kingdom, restricted to sales of<br />
consumer electronics and home appliances, booking air tickets, and hotel reservations. Some<br />
of the successful online businesses are those of United Electronics Company (under the<br />
brand Extra), mobile handset retailer Axiom Telecom, and sports & health equipment<br />
company U-Mark. <strong>Al</strong>though companies like Savola’s <strong>Al</strong> Azizia Panda and Jarir display<br />
products on the internet, online payment and delivery systems are not available. In the<br />
former’s case, a printout of the shopping list can be taken from the website and processed at<br />
the nearest actual store. <strong>Al</strong>othaim started accepting online payment and making home<br />
delivery in July 2012. However, this service is limited to Riyadh currently.<br />
We believe that it will take some time before online retail sales pick-up rapidly even as a<br />
young Saudi population — who extensively use mobile, internet, and social media tools —<br />
begins to buy products online. The main reason for this delay could be that traditional brick<br />
and mortar retail stores are one of the main sources for entertainment in the Kingdom. Nonreligious<br />
music, cinema, gambling and drinking alcohol are forbidden in the Kingdom.<br />
Outdoor sports and adventure activities are also not possible due to the harsh weather<br />
conditions in the country. As a result, it will be hard to wean away the young population from<br />
retail malls, which are the main source for pastime and social interaction in the country. The<br />
reasons why online sales could pick-up is the convenience that it provides in receiving goods<br />
at home and it allows women to carry out purchases from the comfort of their home.<br />
Other reasons for limited development of online or e-commerce transactions in the Kingdom<br />
are:<br />
<br />
<br />
<br />
Lack of proper infrastructure (no secure payment gateway mechanism, lack of<br />
multiple payment options, limited technical knowledge to design e-commerce<br />
platforms, etc.)<br />
Non-availability of an efficient delivery system (the current postal system uses P.O.<br />
Box systems rather than postal addresses and the new Wasel service, which uses<br />
geographic information systems (GIS) covers only 2% of the Saudi population)<br />
Legislations regulating e-commerce retailing are still under development<br />
While online retail may take some time to establish in the Kingdom, we believe it is the way<br />
to go ahead, considering the success stories in developed countries. Hence, retailers who<br />
quickly adapt to technological and logistical requirements as they develop will be able to<br />
capture major the market share in this segment.<br />
Selling products will become a<br />
part of the entire customer<br />
relationship experience<br />
Saudi retailers will have to build relationships<br />
Saudi Arabian consumers are becoming more discerning because of availability of<br />
information on comparable products on the internet. <strong>Al</strong>ong with this, competition has<br />
intensified due to the presence of regional and international players. Hence, Saudi retailers<br />
will have to leverage on their local presence and proximity, and will have to provide<br />
competitive (best prices, discounts, financing arrangements, extended warrantees, etc.) and<br />
value-added services (door delivery, free installation, after-sales support, etc.) to ensure<br />
customer satisfaction and brand loyalty. Customizing products and developing marketing<br />
campaigns to target specific groups would also facilitate long-term growth. For instance,<br />
Extra launched a month-long “Women Festival” in early 2012, where women were offered<br />
products specific to their needs at discounted prices.<br />
Disclosures Please refer to the important disclosures at the back of this report. 6
Saudi <strong>Retail</strong> <strong>Sector</strong><br />
<strong>Retail</strong> –Industrial<br />
05 January 2013<br />
Grocery retail:<br />
promising despite competition<br />
Demand for more diversified and protein-rich forms of food will be driven by an ever<br />
increasing population in the Kingdom and increasing disposable income in the hands of<br />
Saudi citizens. Food is the third most imported commodity by value after machinery and<br />
transport equipments, which highlights its importance. According to the EIU, a major part of<br />
the Saudi retail sales will be driven by sale of food products. The EIU estimates the retail<br />
sales to increase from US$83.3bn in 2011 to US$131.2bn by 2016, of which food sales’<br />
contribution is expected to increase from 50% to 53%.<br />
Figure 9 Food is the third largest imported commodity<br />
Figure 10 Composition of food and non-food in retail sales<br />
SAR bn<br />
500<br />
400<br />
300<br />
200<br />
100<br />
41.7<br />
66.0<br />
53.0<br />
62.2<br />
77.6<br />
13.9<br />
45.2<br />
49.5<br />
56.7<br />
63.2<br />
73.6<br />
13.4<br />
US$ bn<br />
160<br />
120<br />
80<br />
Title:<br />
Source:<br />
Please fill in the values above to have them entered in your report<br />
117.3 99.0<br />
0<br />
2008 2010<br />
40<br />
Machinery, appliances & equipment<br />
Foodstuffs<br />
Metals & their products<br />
Textiles & clothing<br />
Transport equipment<br />
Chemical & metal products<br />
Other goods<br />
0<br />
2007 2008 2009 2010 2011E 2012E 2013E 2014E 2015E 2016E<br />
Non-food retail sales<br />
Food retail sales<br />
Source: SAMA, <strong>Al</strong> <strong>Rajhi</strong> <strong>Capital</strong><br />
Source: EIU, <strong>Al</strong> <strong>Rajhi</strong> <strong>Capital</strong><br />
Large players have an<br />
advantage in a fragmented<br />
market<br />
Opportunities exist but new challenges emerge<br />
Large players maintain a strangle hold on the market<br />
With big-box retail set to play a major role in the Saudi Arabia’s retail sector, we believe large<br />
grocery retailers like Savola, <strong>Al</strong>othaim and Tamimi will remain key players in the sector.<br />
Savola through its Panda brand leads the organized grocery retail market followed by Bin<br />
Dawood and <strong>Al</strong>othaim. Azizia Panda (the retail arm of Savola) opened 4 hypermarkets and 7<br />
supermarkets in 2011 to reach a total of 132 stores in Saudi Arabia. The company plans to<br />
open 5 hypermarkets and 14 supermarkets by the end of 2012. A large chunk of the grocery<br />
retail market (more than 80% as per our estimates) continues to be catered by small stores<br />
and the unorganized sector. Hence, we expect these retailers to continue launching new<br />
stores across the country to capture a larger share of the market over the next few years.<br />
Figure 11 Top five big-box retailers, 2011<br />
Sales area Avg. sales area Grocery sales Market share<br />
Company No. of stores (sq m) (sq m) (US$ mn) (%)<br />
Panda 144 628,500 4,365 1,742 4.2<br />
Bin Dawood 30 205,000 6,833 929 2.3<br />
<strong>Al</strong> Othaim 106 162,440 1,532 879 2.0<br />
Carrefour 17 107,000 6,294 683 1.7<br />
Farm 43 115,850 2,694 327 0.8<br />
Total 340 1,218,790 21,718 4,560 11<br />
Source: EIU, <strong>Al</strong> <strong>Rajhi</strong> <strong>Capital</strong><br />
Disclosures Please refer to the important disclosures at the back of this report. 7
Saudi <strong>Retail</strong> <strong>Sector</strong><br />
<strong>Retail</strong> –Industrial<br />
05 January 2013<br />
Discount stores is a growth area<br />
The non-Saudi population accounts for around a third of the total population of Saudi Arabia.<br />
This expatriate population has grown over a period of time and looking at the country’s<br />
dependency on employing the expatriate population (58% as of 2011), this population will<br />
remain a substantial portion of the Saudi workforce in future. By analyzing the trend of<br />
remittances made by these expatriates, we find their income/savings levels have steadily<br />
increased. Therefore, retailers cannot afford to ignore this target group. Since most of them<br />
have left their home countries to earn and save as much as possible, these customers tend to<br />
be more price conscious than Saudi citizens. They will be driven by sales, free offers,<br />
discounts, and gifts rather than brands and high quality.<br />
Figure 12 Expatriate population growing among employed<br />
Figure 13 Remittances by expatriates<br />
mn<br />
12<br />
SAR bn<br />
120<br />
Title:<br />
Source:<br />
10<br />
100<br />
Please fill in the values above to have them entered in your report<br />
8<br />
6<br />
4<br />
5.79<br />
4.88<br />
3.88 4.00 4.09 4.14 4.26 4.31<br />
3.49<br />
80<br />
60<br />
40<br />
2<br />
0<br />
3.12 3.30 3.37 3.43 3.60 3.76 3.84 3.96 4.14<br />
2003 2004 2005 2006 2007 2008 2009 2010 2011<br />
Saudi Non-Saudi<br />
20<br />
0<br />
2003 2004 2005 2006 2007 2008 2009 2010 2011<br />
Source: Ministry of Economy and Planning, <strong>Al</strong> <strong>Rajhi</strong> <strong>Capital</strong><br />
Source: SAMA, <strong>Al</strong> <strong>Rajhi</strong> <strong>Capital</strong><br />
Saudi retailers can cater to this segment by opening up discount stores. According to the EIU,<br />
<strong>Al</strong>hokair plans to roll out 200 discount stores under its “Easy” brand. Similarly, in late 2011,<br />
the UAE-based Convenience Arabia announced plans to open 60 “Circle K” stores in Riyadh,<br />
with the option of opening another 400 outlets in <strong>Al</strong>drees petrol stations.<br />
The emphasis on employing<br />
Saudi nationals imply higher<br />
costs for retail companies<br />
Training of Saudi nationals under Nitaqat to entail costs<br />
The private sector in Saudi Arabia currently employs around 6mn non-Saudis, while the<br />
number of Saudi nationals employed barely touch 1mn (source: SAMA 2011 annual report).<br />
At the same time, the Ministry of Labor’s data shows nearly 1mn Saudi nationals are<br />
unemployed. Consequently, the Saudi government rolled out the ‘Nitaqat’ program in<br />
November 2011 to ensure that a specified number of Saudi nationals are employed by the<br />
private sector. Non-compliance would lead to varying levels of restrictions on non-Saudis<br />
already employed by the private companies.<br />
An elaborate traffic lighting system (red, green and yellow) has been developed, which<br />
prescribes varying quota of Saudi nationals for private companies based on their existing<br />
employee strength. If a company falls in red category, then the company’s non-Saudi workers<br />
would lose their work permits. Companies in yellow cannot renew the work permits of non-<br />
Saudi workers after six years, while those in green will have the freedom to employ non-Saudi<br />
workers from other companies.<br />
Figure 14 Saudi nationals to be employed under Nitaqat program<br />
Employee strength Red Yellow Green Excellent<br />
< 10 0% 0% 0% 0%<br />
10-49 0-4% 5-9% 10-26% 27%+<br />
50-499 0-9% 5-16% 17-33% 34%+<br />
500-2,999 0-9% 10-23% 24-34% 35%+<br />
3000 or more 0-9% 10-24% 25-36% 37%+<br />
Source: EIU, <strong>Al</strong> <strong>Rajhi</strong> <strong>Capital</strong><br />
Disclosures Please refer to the important disclosures at the back of this report. 8
Saudi <strong>Retail</strong> <strong>Sector</strong><br />
<strong>Retail</strong> –Industrial<br />
05 January 2013<br />
While the success of this program remains to be seen, we believe companies in the retail<br />
sector will find it increasingly difficult and expensive to employ Saudi nationals to work on<br />
labor intensive jobs. These jobs are presently carried out by low cost non-Saudi (South Asian<br />
and East Asian) nationals. As a result, these companies will have to incur higher costs for<br />
recruitment, training and retention, which would squeeze their profit margins.<br />
Clothing & footwear and<br />
electronics & appliance to lead<br />
non-grocery retail<br />
International competition is not far behind<br />
An attractive retail market has lured regional players like Majid <strong>Al</strong> Futtaim and EMKE Group<br />
(Lulu). Majid <strong>Al</strong> Futtaim has been present in Saudi Arabia through its French partner<br />
Carrefour since 2005, which had 9 hypermarkets in the country at the end of 2011. While the<br />
company owns malls across the UAE, Oman, Bahrain and Egypt, it has none in Saudi Arabia.<br />
Consequently, the management considers Saudi Arabia as a key strategic market for growth<br />
and plans to open several malls in Riyadh over the next few years. Separately, Lulu which has<br />
opened four stores in the country, of which three are in Riyadh, plans to expand further<br />
across the country.<br />
Non-grocery retail:<br />
promising despite competition<br />
We expect the non-grocery retail market to post a healthy growth driven by favorable<br />
demography, changing lifestyle, improving education, and aggressive expansion plans of<br />
large retailers. We expect two sub-categories: clothing & footwear as well as electronics &<br />
appliances to lead the growth in non-grocery retail. While the markets remain attractive for<br />
long-term growth, it will be crucial for players to stay ahead of the intensifying competition,<br />
be it in terms of launching new marketing campaigns or offering products/support services.<br />
Clothing & footwear market: brands will rule<br />
Branded apparel catching fancy of a young generation<br />
Clothing & footwear is the largest non-grocery retail sales category in Saudi Arabia.<br />
According to EIU estimates, this market was worth US$9bn in 2011 and is expected to grow<br />
to US$16bn by 2016. Sales in the clothing & footwear segment tend to be seasonal with peaks<br />
during summer breaks and Saudi religious holidays (Eid El Fitr at the end of Ramadan and<br />
Eid <strong>Al</strong> Adha at the end of Hajj). With high disposable income levels, Saudi consumers prefer<br />
branded products, so pricing takes a backseat. Consequently, designer and high-fashion<br />
branded clothing are witnessing robust demand and this trend is likely to continue,<br />
considering the growing young population in the Kingdom. Sales of clothing for women and<br />
children represent majority of the market. As a result, branded boutiques, especially for<br />
women and children, have gathered pace. <strong>Al</strong>though, women wear the “abaya” (a long black<br />
robe) and veil in public, they wear fashionable clothes and footwear at home. Men wear the<br />
“thobe” (a traditional white dress). However, the younger generation is gradually choosing to<br />
wear formal suits and shoes for work, and jeans and t-shirts for casual gatherings.<br />
Figure 15 <strong>Retail</strong> clothing sales trend in Saudi Arabia<br />
US$ mn<br />
16,000<br />
Figure 16 <strong>Retail</strong> footwear sales trend in Saudi Arabia<br />
US$ mn<br />
1200<br />
1000<br />
12,000<br />
800<br />
8,000<br />
600<br />
400<br />
4,000<br />
200<br />
0<br />
2007 2008 2009 2010 2011 2012E 2013E 2014E 2015E 2016E<br />
0<br />
2007 2008 2009 2010 2011 2012E 2013E 2014E 2015E 2016E<br />
Source: EIU, <strong>Al</strong> <strong>Rajhi</strong> <strong>Capital</strong><br />
Source: EIU, <strong>Al</strong> <strong>Rajhi</strong> <strong>Capital</strong><br />
Disclosures Please refer to the important disclosures at the back of this report. 9
Saudi <strong>Retail</strong> <strong>Sector</strong><br />
<strong>Retail</strong> –Industrial<br />
05 January 2013<br />
The potential opportunity for branded products has attracted regional players from the UAE,<br />
a retail hotspot in the GCC region. Prominent among them are the Jashanmal Group and<br />
Western International Group (WIG). While Jashanmal plans to launch stores simultaneously<br />
in Riyadh, Jeddah and Dammam in 2013, WIG has already launched its first “Brandzone”<br />
store in Riyadh and plans to open 50 stores across the country by 2015, apart from the seven<br />
stores under the “Shoe Point” brand in Saudi Arabia launched in 2012.<br />
Changing regulations for women centric retail<br />
For the first time, the Saudi government brought out a law mandating lingerie shops to<br />
employ only women staff for retail sales from January 2012 onward. In March 2012, the<br />
Ministry of Labor ordered closure of 600 outlets that had not complied with this rule. In July<br />
2012, the second phase of the law was enacted, which requires all cosmetic stores to employ<br />
Saudi women as front office staff.<br />
Recently, the Ministry also announced a decision to allow Saudi women to work as<br />
saleswomen in jewelry shops. <strong>Al</strong>though arguments continue in support of and against women<br />
working in the Kingdom, we believe this trend reflects the government’s broadening mindset<br />
to empower women. <strong>Al</strong>lowing women to work could be the first step to provide them with a<br />
wider and equitable role in the Saudi society. Women gaining more social and economic<br />
independence will augur well for the retail sector, since they are the sector’s main target<br />
customers.<br />
Apart from a few large players,<br />
the market remains fragmented<br />
The market remains fragmented led by a few players<br />
The leading clothes retailers in the Kingdom are <strong>Al</strong>hokair, <strong>Al</strong> Bandar Trading Company (<strong>Al</strong><br />
Bandar), <strong>Al</strong>shaya Group and <strong>Al</strong> Sawani Group. Apart from these major companies, the rest of<br />
the market is fragmented. A brief description of the leaders in this market is listed below:<br />
<strong>Al</strong>hokair, the leader in fashion retail, offers a multitude of leading brands (75 franchises)<br />
such as GAP, Zara, Bershka, Marks & Spencer, Massimo Dutti, and Charles & Keith. Further,<br />
its subsidiary, Arabian Centres, has a network of 13 malls (12 in Saudi Arabia and 1 in Egypt),<br />
managing almost 2mn sq m of retail property with a combined gross leasable area (GLA) of<br />
835,710 sq m. The company plans to open 10 more malls by 2014.<br />
<strong>Al</strong> Bandar is part of the larger Landmark Group based out of Bahrain and offers major<br />
brands such as Lee Cooper, Zodiac, Louise Philippe, Reebok, Adidas, Bossini, Splash, Shoe<br />
Mart, and City Max in the Kingdom. The company operates through 300 stores in the country<br />
with more than 400,000 sq m of retail space.<br />
<strong>Al</strong>shaya is a Kuwaiti company with a portfolio of popular brands such as Debenhams,<br />
Mothercare, H&M, Next, Milano and Footlocker. The company also offers leading branded<br />
products such as The Body Shop, Estee Lauder, Boots and Vision Express in cosmetics and<br />
healthcare categories.<br />
<strong>Al</strong> Sawani Group, which was one of the first companies to launch department stores in the<br />
Kingdom, has brought in brands such as Benetton, Guess, Moschino, Marina Rinaldi, Betty<br />
Barclay, La Perla and Esprit. The company is the sole authorized distributor of the Espirit<br />
Brand in MENA region.<br />
Demand for latest electronic<br />
gadgets to grow<br />
Electronics and appliances market: booming market<br />
Smart phones and tablets to drive electronic appliance sales<br />
Absence of cinemas and concerts in the Kingdom has resulted in robust demand for home<br />
entertainment. Evidently, demand for DVDs, high-definition televisions (LCDs and LEDs),<br />
and computers remains healthy. With more than 80% of the population below the age of 40,<br />
the urge to be tech savvy among the youth is high and growing disposable income level<br />
supports this aspiration. This has resulted in rising demand for the latest electronic gadgets<br />
viz. smart phones, tablets and gaming consoles. In fact, smart phones and tablets are set to<br />
replace traditional laptops and desktops as they have advanced features, are portable, and<br />
add to the style quotient.<br />
Disclosures Please refer to the important disclosures at the back of this report. 10
Saudi <strong>Retail</strong> <strong>Sector</strong><br />
<strong>Retail</strong> –Industrial<br />
05 January 2013<br />
Higher internet and mobile<br />
usage will drive smart phone<br />
and tablet sales<br />
Increasing internet and mobile usage to provide support<br />
According to CITC, internet penetration in the country stood at around 50.7% at the end of<br />
H1 2012. <strong>Al</strong>though, this number is better than that of emerging markets, it remains much<br />
lower than developed markets like Japan, Germany and the US (more than 75%). Hence,<br />
there is ample room for growth. We believe that most of the sales growth in the smart phones<br />
and tablets will be driven by the growth in internet penetration. CITC estimates mobile<br />
broadband subscriptions to have reached 12.6mn by the end of H1 2012, implying a<br />
penetration rate of 43.4%. Internet usage will grow with the increasing popularity of social<br />
networking websites, web applications, and online games as well as a rise in e-commerce and<br />
m-commerce transactions. Further, the adoption of new communication technologies like<br />
3.5G (HSPA) and 4G should lead to increased demand for new and better electronic devices<br />
for high-definition mobile TV, video conferencing and 3D TV.<br />
Figure 17 Internet usage has been growing rapidly<br />
Figure 18 Mobile subscriptions have also surged<br />
mn<br />
16<br />
60%<br />
mn<br />
60<br />
Title:<br />
Source:<br />
200%<br />
12<br />
50%<br />
50<br />
Please fill in the values above to have them entered in your report<br />
160%<br />
40%<br />
40<br />
120%<br />
8<br />
30%<br />
30<br />
20%<br />
20<br />
80%<br />
4<br />
10%<br />
10<br />
40%<br />
0<br />
2001 2002 2003 2004 2005 2006 2007 2008 2009 2010 2011 H1<br />
2012<br />
0%<br />
0<br />
2001 2002 2003 2004 2005 2006 2007 2008 2009 2010 2011 H1<br />
2012<br />
0%<br />
Source: CITC, <strong>Al</strong> <strong>Rajhi</strong> <strong>Capital</strong><br />
Internet users<br />
Penetration (RHS)<br />
Source: CITC, <strong>Al</strong> <strong>Rajhi</strong> <strong>Capital</strong><br />
Post-paid Pre-paid Penetration (RHS)<br />
Home appliance sales to also witness growth<br />
The home appliances market has witnessed a steady growth with total sales reaching<br />
SAR6.8bn in 2010 (source: Extra Prospectus). Addition of new housing units is bound to<br />
drive the consumption of home appliances, especially split air conditioners, top and front<br />
load washing machines, and dryers. New ventures are being forged between private<br />
developers and government entities to meet the target of building 500,000 affordable<br />
housing units. According to JLL, 115,000 new residential units will be added in Riyadh, while<br />
76,000 units are expected to be added in Jeddah over the 2012-2015 period. Implementation<br />
of the recently approved mortgage law will provide further impetus.<br />
Electronics market is fragmented and ripe for consolidation<br />
Extra is the largest player in the electronics and appliances market and had a 9.3% market<br />
share in 2010 (Source: Extra prospectus). Jarir was second, trailing far behind with a market<br />
share of 4.7%. Axiom Telecom, Savola (through Hyper Panda) and <strong>Al</strong> Bandar (through E-<br />
Max) follow with a market share ranging between 2-2.6%. We believe that their share will<br />
have increased over the next couple of years. However, their ranking remains the same.<br />
Extra has been able to scale up aggressively in the Kingdom with 29 branches since 2003<br />
and has ambitious plans to launch 40 branches by 2015. The company offers 12,000 products<br />
from leading international brands. Products are offered in big-box retail formats as well as<br />
online sites, along with providing extensive after-sales services. Consequently, Extra has been<br />
able to overtake well established players like Jarir and become the market leader.<br />
Jarir, which started as a stationery and school book supplier, has diversified to office<br />
equipments, portable consumer electronics (smart phones, tablets and e-readers), computers<br />
and peripherals. The company, established in 1979, has been able to build a strong brand<br />
among Saudi nationals. At the end of 2011, the company had 30 retail (23 are leased) and five<br />
wholesale stores, apart from a central warehousing and distribution center. Jarir plans to<br />
open eight new stores by 2014, of which two will be located in Kuwait.<br />
Disclosures Please refer to the important disclosures at the back of this report. 11
Saudi <strong>Retail</strong> <strong>Sector</strong><br />
<strong>Retail</strong> –Industrial<br />
05 January 2013<br />
The UAE-based Axiom Telecom has a strong presence across the GCC countries, UK and<br />
India with more than 500 outlets. The company retails all leading brands of mobile handsets,<br />
tablets and mobile accessories. Further, the company has a strategic partnership with<br />
telecom players du in the UAE and Mobily in Saudi Arabia.<br />
The Saudi electronics retail market is heating up with regional companies increasing their<br />
presence. <strong>Al</strong> Bandar’s “Emax” stores, Majid <strong>Al</strong> Futtaim’s “Best E-City” stores (which it<br />
acquired from <strong>Al</strong>hokair in 2009), and Egypt-based Itsalat International’s “i2” are retailers<br />
from the MENA region, which are viewed as potential competitors in the segment. However,<br />
they have very low market share as compared to Extra.<br />
Investment in education<br />
remains a priority for the<br />
government<br />
Emphasis on a knowledge economy to boost book sales<br />
The Saudi government has placed high emphasis on education for its nationals. The<br />
Kingdom’s goal of creating a knowledge-based society has led the Ministry of Economy and<br />
Planning to allocate SAR732bn toward human resources in the ninth five-year development<br />
plan, which includes education and training. <strong>Al</strong>though the percentage of allocation has<br />
reduced from 56% in the eighth five-year development plan to the current 51%, it still<br />
remains a major area of focus.<br />
The ninth five-year development plan envisages increasing the number of students enrolled<br />
at each academic stage – elementary, intermediate, technical and vocational, graduate, and<br />
post-graduate levels. A number of new educational facilities (25 technology colleges, 28<br />
technical institutes, and 50 industrial training institutes) will be built. The plan also targets to<br />
monitor the implementation of projects under the first five-year plan of the National Policy<br />
for Science, Technology and Innovation, and will provide SAR900mn in grants for research<br />
projects each year. Further, initiatives include the launch of 10 research centers, 15<br />
technological innovation centers affiliated to King Abdullah City for Science and Technology<br />
(KACST), and at least 8 technology incubators at KACST and other universities. We believe<br />
this emphasis on education will provide a boost for book sales and stationeries benefitting<br />
retailers like Jarir — which has diversified to selling electronics (laptops, smart phones, and<br />
gaming equipment) and even has the motto “Not just a bookstore”.<br />
Figure 19 Education and heath are of prime importance<br />
SAR bn<br />
1600<br />
Figure 20 Spending is high on basic and college education<br />
SAR bn<br />
800<br />
1200<br />
Municipal & Housing<br />
Services<br />
Transport &<br />
Communications<br />
600<br />
Institute of Public<br />
Administration<br />
Science, Tech. & Innovation<br />
800<br />
Economic Resources<br />
Health<br />
400<br />
Technical & Vocational<br />
Higher Education<br />
400<br />
Human Resources<br />
(Education)<br />
200<br />
General Education<br />
0<br />
Eighth Plan (2005-09) Ninth Plan (2010-14)<br />
0<br />
Eighth Plan (2005-09) Ninth Plan (2010-14)<br />
Source: Ministry of Economy and Planning, <strong>Al</strong> <strong>Rajhi</strong> <strong>Capital</strong><br />
Source: Ministry of Economy and Planning, <strong>Al</strong> <strong>Rajhi</strong> <strong>Capital</strong><br />
Disclosures Please refer to the important disclosures at the back of this report. 12
RSI10<br />
Vol mn<br />
United Electronics Company<br />
<strong>Retail</strong><br />
EXTRA AB: Saudi Arabia<br />
05 January 2013<br />
US$0.7bn 40% US$1.14mn<br />
Market cap Free float Avg. daily volume<br />
Target price 123.5 19% over current<br />
Consensus price 123.4 19% over current<br />
Current price 103.75 as at 02/01/2013<br />
Underweight Neutral Overweight<br />
Overweight<br />
Key themes<br />
We expect rising population, improving education,<br />
and changing lifestyle to continue to drive the retail<br />
sector in Saudi Arabia. We believe the electronic<br />
retail segment, to which Extra caters, has immense<br />
potential not only in the Saudi Arabia but also in the<br />
GCC, thanks to the latent demand electronic<br />
gadgets and home appliances.<br />
Implications<br />
Extra is our preferred stock in the retail sector. Extra<br />
has become a leader in a very short time thanks to<br />
its aggressive expansion plans backed by an<br />
attention to all aspects of setting up an efficient<br />
business. We expect the stock to perform well in<br />
future, benefitting from the young demography and<br />
higher disposable income levels.<br />
Performance<br />
103<br />
Earnings<br />
Period End (SAR) 12/11A 12/12E 12/13E 12/14E<br />
Revenue (mn) 2,462 2,850 3,302 3,830<br />
Revenue Growth 38.4% 15.8% 15.8% 16.0%<br />
EBITDA (mn) 158 180 199 218<br />
EBITDA Growth 33.6% 13.8% 10.9% 9.3%<br />
EPS 5.51 6.17 6.81 7.31<br />
EPS Growth -4.2% 12.0% 10.3% 7.4%<br />
Source: Company data, <strong>Al</strong> <strong>Rajhi</strong> <strong>Capital</strong><br />
Valuation<br />
18.0<br />
16.0<br />
14.0<br />
12.0<br />
10.0<br />
8.0<br />
6.0<br />
4.0<br />
2.0<br />
93<br />
83<br />
73<br />
70<br />
30<br />
-104<br />
3<br />
2<br />
1<br />
Price Close<br />
P/E (x)<br />
MAV10<br />
12/11 04/12 07/12 10/12<br />
Source: Bloomberg<br />
0.0<br />
01/09 01/10 01/11 01/12<br />
Source: Company data, <strong>Al</strong> <strong>Rajhi</strong> <strong>Capital</strong><br />
136<br />
129<br />
122<br />
115<br />
107<br />
100<br />
93<br />
86<br />
Research Department<br />
Majed <strong>Al</strong>solaim,<br />
Tel +966 1211 9471, alsolaimm@alrajhi-capital.com<br />
Extra<br />
Ushering in the digital age<br />
Extra is the market leader in the home & electronic appliance segment in the<br />
Kingdom and has maintained solid revenue growth over the past few years on<br />
account of Saudi Arabia’s strong demographics. We expect the company to post<br />
healthy revenue growth over the next few years due to new store openings.<br />
<strong>Al</strong>though, the company’s margins are lower as compared to its peers, we<br />
attribute it to the selling and distribution costs. We believe that high SGA<br />
expenses are justified, given that the company is in a rapid expansion mode.<br />
We initiate Extra with an Overweight rating and a target price of SAR123.5,<br />
implying an upside potential of 19%.<br />
Favorable market conditions: We believe that Saudi Arabia’s retail sector will<br />
benefit immensely in the coming years on account of a young (80% below 40)<br />
and rapidly growing population. Apart from the Kingdom, neighboring GCC<br />
countries also have a similar demographic profile. While improving income<br />
levels, low internet penetration levels and an attraction to modern lifestyle will<br />
lead to a surge in demand for electronic devices, an increase in housing units will<br />
ensure steady demand for home appliances. Extra, being a market leader in the<br />
Kingdom, is positioned to reap rich dividends from this trend.<br />
Growth to come from rapid store expansion: Extra is planning to set up 42<br />
stores in the country by 2015 from 29 stores currently. Given the fact that Extra<br />
has been expanding rapidly over the past couple of years, we believe that it is<br />
capable of adding 4-5 stores every year for the next couple of years, implying<br />
double-digit revenue growth over the near-term.<br />
Aggressive sales pitch: Extra has been conducting huge sales events like the<br />
“Women Festival” and the recently concluded “Mega Sale” to capture the<br />
attention of Saudi consumers. The financials also point to the fact that Extra’s<br />
selling and distribution expenses are very high as compared to its peer Jarir and<br />
thus have impacted profit margins. However, we believe this is mainly due to<br />
Extra’s rapid expansion plans.<br />
Financials are supportive for growth: <strong>Al</strong>though inventory value has grown<br />
considerably (+86% y-o-y) at the end of Q3 2012 and represents a chunk of the<br />
balance sheet (around 55%), we believe the company can easily tide over any<br />
working capital issues. Our belief stems from the fact that Extra has zero debt on<br />
its balance sheet and hence can raise debt if required.<br />
Valuation: We like Extra’s business for its growth potential and its approach at<br />
selling electronic products (targeted sales campaigns and online sales) in the<br />
Kingdom. We feel the company will ride on the retail wave in the Kingdom as<br />
well as the GCC region at large and expect it to witness high revenue and profit<br />
growth in future. We have conservatively kept selling expenses at the same level<br />
in the forecast period, but we understand that this could reduce substantially in<br />
future, boosting margins. We initiate coverage on the stock with and Overweight<br />
rating and arrive at a target price of SAR123.5 per share using a blend of long<br />
run discounted economic profit (DEP) method (70% weight) along with<br />
comparable P/E and EV/EBITDA multiples of Extra’s peers (30%).<br />
Disclosures Please refer to the important disclosures at the back of this report.<br />
Powered by Enhanced Datasystems’ EFA Platform 13
United Electronics Company<br />
<strong>Retail</strong> –Industrial<br />
05 January 2013<br />
Corporate summary Share information Valuation<br />
Extra is one of the fastest growing<br />
electronic retail companies in Saudi<br />
Arabia with plans to expand to the<br />
GCC. The company retails electronic<br />
products under different categories.<br />
The company has established 29 stores<br />
in the Kingdom and targets to reach 42<br />
by 2015. Extra has become a leader in<br />
a very short time thanks to its<br />
aggressive expansion plans backed by<br />
an attention to all aspects of setting up<br />
an efficient business.<br />
Market cap (SAR/US$) 2.484bn / 0.662bn<br />
52-week range 78.00 - 104.3<br />
Daily avg volume (US$)<br />
1.061mn<br />
Shares outstanding<br />
24.00mn<br />
Free float (est) 40%<br />
Performance: 1M 3M 12M<br />
Absolute 11% 8.1% 35.3%<br />
Relative to index 8.4% 8.4% 27.9%<br />
Major Shareholder:<br />
Fawzan Holding Company 45.4%<br />
Abdulaziz <strong>Al</strong>saghyir Investment Company 14.9%<br />
Source: Bloomberg, <strong>Al</strong> <strong>Rajhi</strong> <strong>Capital</strong><br />
Period End 12/11A 12/12A 12/13E 12/14E<br />
Revenue (SARmn) 2,462 2,850 3,302 3,830<br />
EBITDA (SARmn) 158 180 199 218<br />
Net Profit (SARmn) 132 148 163 176<br />
EPS (SAR) 5.51 6.17 6.81 7.31<br />
DPS (SAR) 2.50 2.50 2.50 4.39<br />
EPS Growth -4.2% 12.0% 10.3% 7.4%<br />
EV/EBITDA (x) 15.3 13.2 11.6 10.3<br />
P/E (x) 18.8 16.8 15.2 14.2<br />
P/B (x) 6.6 5.4 4.4 3.8<br />
Dividend Yield 2.4% 2.4% 2.4% 4.2%<br />
Source: Company data, <strong>Al</strong> <strong>Rajhi</strong> <strong>Capital</strong><br />
A fresh look at electronics<br />
growing fast organically<br />
Extra continues to expand at a<br />
fast pace<br />
Extra has been busy over the past couple of years setting up stores rapidly across the<br />
Kingdom. Extra added 7 stores in 2011 and has added 5 more by the end of Q3 2012 with the<br />
total number reaching 29. The company plans to take this number to 42 by 2015, which<br />
implies and addition of 4-5 stores every year for the next couple of years. Considering the<br />
bright outlook for retail in Saudi Arabia and the low rental rates for retail property expected<br />
over the next few years (refer to our discussion on steady supply of malls in Page 5), we<br />
believe that Extra will be able to expand rapidly given that most of the company’s stores are<br />
rented rather than owned.<br />
Apart from expansion within the country, Extra also has plans to establish stores in the GCC.<br />
The first store outside Saudi Arabia will come up in the Bausher region in Muscat, Oman with<br />
a retail space of 4,000 sq m. Further, the company has entered into a partnership agreement<br />
with Qatar-based <strong>Al</strong> Meera Holding Company to open a big-box store in Qatar in 2013.<br />
According to a statement made by the Chairman of Extra in May 2012, the company also has<br />
plans to expand into Bahrain in future. The rapid expansion plans of the company seem to<br />
have borne fruit with the company rising to the top in a very fragmented market, overtaking<br />
experienced players like Jarir.<br />
Figure 21 Market share by value<br />
Brand Name Company 2008 2009 2010<br />
eXtra United Electronics Company 6.7% 8.0% 9.3%<br />
Jarir Bookstore Jarir Marketing Co 3.3% 4.0% 4.7%<br />
Axiom Axiom Telecom LLC 2.3% 2.5% 2.6%<br />
Hyper Panda <strong>Al</strong>-Azizia Panda United Inc 2.2% 2.2% 2.3%<br />
E-max <strong>Al</strong> Bandar Trading Co 1.5% 1.8% 2.0%<br />
Electro Advanced Electronics Company 1.2% 1.3% 1.3%<br />
Carrefour Majid <strong>Al</strong> Futtaim Hypermarkets LLC 1.6% 1.3% 1.1%<br />
Best E-City <strong>Al</strong> Futtaim Group LLC 0.4% 0.4% 0.3%<br />
Others 80.7% 78.5% 76.3%<br />
Source: Euromonitor, Company data, <strong>Al</strong> <strong>Rajhi</strong> <strong>Capital</strong><br />
While Jarir is into electronics<br />
and stationeries, Extra is into<br />
electronics and home<br />
appliances<br />
While Jarir has diversified from selling books, stationeries and school & office supplies to<br />
also selling electronic items, Extra’s product portfolio comprises of electronic items<br />
(computers, gaming devices, smart phones, and cameras) as well as home appliances<br />
(television, kitchen appliances, refrigerators, air conditioners, etc.). Considering the young<br />
demographic profile and the high disposable income levels, we believe Extra has timed it<br />
right to enter a segment which will witness robust growth at least for another couple of years.<br />
Disclosures Please refer to the important disclosures at the back of this report. 14
United Electronics Company<br />
<strong>Retail</strong> –Industrial<br />
05 January 2013<br />
Adoption of new technologies<br />
will boost the demand for smart<br />
phones and tablets<br />
Portable electronic devices and gaming to drive growth<br />
We believe sales of tablets and smart phones will overtake PCs and witness high growth levels<br />
going forward. According to recent estimates by Gartner, around 820mn smart phones and<br />
tablets will be sold globally in 2012 and it will reach 1.2 billion by 2013, which indicates a<br />
46% growth y-o-y. Gartner predicts mobile phones to overtake PCs as the most common web<br />
access device worldwide by 2013 and more than 80% percent of the handsets sold in mature<br />
markets to be smart phones by 2015. It also estimates tablet sales to surge from 13mn units<br />
worldwide in 2012 to 53mn by 2016.<br />
According to CITC data, while mobile subscriptions reached 181% in the Kingdom, mobile<br />
broadband subscriptions reached 11.7mn at the end of Q3 2012, representing a population<br />
penetration rate of 40%. Hence, we believe the demand for new handsets is likely to surge<br />
with the increasing popularity of social networking websites, online games and development<br />
of m-commerce transactions. In the case of tablets, we expect their portability and sleek<br />
features to make them popular over traditional desktop PCs and laptops in future.<br />
With the increasing popularity of bringing your own device to office, consumer preferences<br />
will dictate corporate choice and although this trend is just catching up, we believe it won’t be<br />
long before we see this development in Saudi Arabia. <strong>Al</strong>ready, Extra is eyeing business to<br />
business sales in the Kingdom and sees it as a potential market, especially those involved<br />
with government initiatives. Currently, corporate sales account for a mere 1-1.5% of total<br />
sales on a monthly basis.<br />
Both online and offline gaming<br />
is catching up and represent a<br />
huge market for electronic<br />
retailers<br />
With more than 80% of the population below 40 in the Kingdom, gaming is another market<br />
where we see potential growth for companies like Extra. According to Turkey-based Peak<br />
Games, a social gaming company which competes with top global players like Zynga,<br />
King.com and EA Sports, more than two-thirds of the internet users in Saudi Arabia are<br />
playing games online and the country has one of the highest average revenue per user<br />
(ARPU) rates in social gaming. According to the company, daily ARPU rates in Gulf countries<br />
average around eight cents which is higher as compared to around six cents in developed<br />
markets like the US and Europe. Apart from online gaming, offline sales through gaming<br />
equipments like Sony’s Play Station 3 and Microsoft’s X-box 360 are also expected to be<br />
robust, especially with the popularity of regional Arabic titles. While online gaming will drive<br />
the sales for tablets and smart phones, offline gaming will drive the sales for gaming devices.<br />
Figure 22 Extra: Revenue growth trend<br />
SAR bn<br />
5<br />
50%<br />
4.2<br />
4<br />
3.8<br />
40%<br />
3.3<br />
3<br />
2.5<br />
2.9<br />
30%<br />
2<br />
20%<br />
1<br />
10%<br />
0<br />
2011 2012E 2013E 2014E 2015E<br />
0%<br />
Revenue<br />
Y-o-Y growth (LHS)<br />
Source: Company data, <strong>Al</strong> <strong>Rajhi</strong> <strong>Capital</strong><br />
Considering the young population of Saudi Arabia, we believe that Extra can accelerate its top<br />
line by catering to these specific product categories. We expect sales of smart phones, tablets<br />
and gaming devices to complement Extra’s aggressive store expansion plans. We estimate<br />
Extra to achieve revenue growth of around 16% in 2012 and expect the company to maintain<br />
healthy growth over the next three years, though we have been very conservative regarding<br />
store expansions post 2014.<br />
Disclosures Please refer to the important disclosures at the back of this report. 15
United Electronics Company<br />
<strong>Retail</strong> –Industrial<br />
05 January 2013<br />
Extra has been aggressively<br />
promoting its products by<br />
conducting special events<br />
Aggressive sales pitch<br />
Extra has been periodically conducting events to attract the attention of Saudi consumers,<br />
apart from ramping up its stores aggressively. The company received the “<strong>Retail</strong> Marketing<br />
Initiative of the Year” in June 2012 from the Middle East <strong>Retail</strong> Academy in recognition of its<br />
month-long marketing campaign called “Women Festival,” held in the Kingdom. During the<br />
period, diverse marketing channels were employed to market products specifically used by<br />
women. Targeting women customers through extensive marketing efforts is unprecedented in<br />
the Kingdom. As a result, the company’s sales in March 2012 increased by 17% compared to<br />
the previous month.<br />
The company has also been conducting an event called the “Mega Sale” for the past eight<br />
years and the recent one was held in October 2012 for five days. It can be considered as one<br />
of the largest consumer electronics and home appliances event in the Middle East going by<br />
the numbers in 2011. In 2011, the “Mega Sale” attracted 1.2mn visitors to Extra’s stores and<br />
website (a 40% increase y-o-y) and double the volume of sales witnessed in the “GITEX<br />
Technology Week”, one of the largest ICT events held every year in Dubai. While these events<br />
promote brand visibility they also result in higher footfalls and revenue growth. It helps to lay<br />
the foundation for a strong reputation, which is very precious for repeat sales in a country<br />
like Saudi Arabia.<br />
Consumers have been kept in<br />
mind right from product pricing<br />
to after sales service<br />
Extra’s beauty lies in its eye for details<br />
Consumers have been kept in mind at all stages of the sales cycle<br />
Pricing and Products: Majority of Extra’s target customers comprise the middle and high<br />
income segments of both the Saudi and non-Saudi population. Product categories have been<br />
built to cover all price points, from the basic entry level to the high end luxury level, making a<br />
deep penetration into the mobile consumer segment. Extra also provides a comprehensive<br />
range among specific consumer groups. For instance, the company offers a variety of kitchen<br />
appliances under various leading brands to cater to its female customers, while it offers the<br />
top brands of gaming devices, iPods, MP3/MP4 players to the young customers.<br />
Payment: Extra became the first retailer in the Kingdom to join SAMA’s SADAD payment<br />
system in August 2012. SADAD is a single electronic payment platform that links different<br />
billers and banks, enabling consumers to pay electronically through any bank in the<br />
Kingdom. Various banking channels including internet banking, phone banking and ATMs<br />
can be used, providing consumers with the maximum flexibility in terms of how they choose<br />
to pay.<br />
After-Sales: We also like the fact that Extra has taken efforts in sales and after sales<br />
services. The company allows customers to purchase online and receive delivery at home, a<br />
feature available only by a handful of retailers in Saudi Arabia. Further, it provides a<br />
comprehensive list of programs including extended warranties, 24/7 remote technical<br />
support, computer servicing, and mobile upgrading services (Jawwaly). This differentiates<br />
Extra from the others and shows that the company is keen to nurture a long-standing<br />
relationship with its customers rather than merely increasing sales.<br />
Most of the stores are rented,<br />
which allows the company to<br />
focus only on inventory<br />
management<br />
Stores have been set up at minimal costs<br />
The company has been careful in setting up its stores with most of them being leased (only 3<br />
out of 24 stores were owned at the end of 2011) and in stand-alone locations. According to the<br />
company, stand alone stores typically have lower rentals and service charges compared to<br />
those based in shopping malls, which results in lower costs and facilitate aggressive pricing.<br />
Further, this allows the company to focus on its core operations of only managing inventory<br />
levels as well as expand at a fast pace.<br />
While Extra has established large stores with sales space averaging around 5,000 sq m in<br />
large cities such as Riyadh, Jeddah and Khobar, more than 75% of the company’s stores are<br />
small with a sales space averaging around 2,000 sq m. This shows that the company has been<br />
spreading its base across the Kingdom and not focusing only on the major cities.<br />
Multiple warehouses keep<br />
inventory levels at manageable<br />
levels and allow smooth<br />
operations<br />
Strategically placed warehouses<br />
Extra operates three central warehouses located in Riyadh, Jeddah and Khobar, which supply<br />
to the retail stores in specific regions. The Jeddah and Khobar warehouses have the capacity<br />
to receive direct imports and break it down for smaller deliveries to retail stores across the<br />
country. These warehouses, which are all rented, also serve as logistic hubs for making home<br />
delivery to consumers. Having three warehouses ensure inventory levels remain manageable<br />
and operations can continue even in case of break down in any specific region.<br />
Disclosures Please refer to the important disclosures at the back of this report. 16
United Electronics Company<br />
<strong>Retail</strong> –Industrial<br />
05 January 2013<br />
Figure 23 Extra's warehouses<br />
Location Total area (sq m) Stores covered<br />
Dammam 16,000 Khobar, Dammam, <strong>Al</strong> Hassah, Hafr <strong>Al</strong> Batin, <strong>Al</strong>Faisaliah<br />
Jeddah 14,000 Sultan, Abha, Taif, Medina, Old Airport, Mecca, Tabuk, Najran<br />
Riyadh 6,500 Worood, Ghurnath, Sweidi, Qassim, Khurais, <strong>Al</strong> Raed, <strong>Al</strong> Rimal, <strong>Al</strong> Badiah<br />
Source: Company prospectus, <strong>Al</strong> <strong>Rajhi</strong> <strong>Capital</strong><br />
Rising inventory levels could<br />
impact Extra<br />
Piling-up Inventory could impact operations<br />
The electronics market is constantly changing with products having a very short shelf-life due<br />
to changing technologies and new products constantly replacing old ones. With most of the<br />
company’s investment locked in inventory, it becomes important for the company to<br />
maintain optimal inventory levels at all times. We have noticed that inventory levels have<br />
been slowly building up over the past few quarters. The value of inventory in the balance<br />
sheet stood at SAR699mn at the end of Q3 2012, 86% higher than a year ago at the end of Q3<br />
2011 and representing 55% of the total assets on the company’s balance sheet.<br />
Figure 24 Inventory levels have been going up<br />
SAR mn<br />
800<br />
Days<br />
100<br />
600<br />
80<br />
60<br />
400<br />
40<br />
200<br />
20<br />
0<br />
Q3 2011 Q4 2011 Q1 2012 Q2 2012 Q3 2012<br />
0<br />
Inventory<br />
Inventory days* (LHS)<br />
Source: Company data, <strong>Al</strong> <strong>Rajhi</strong> <strong>Capital</strong><br />
* Days are calculated based on annualized revenue for respective quarter<br />
While, we understand that some of it can be attributed to support the recently conducted<br />
“Mega Sale” and fill in the pipeline of new stores, any further increase could entail cash<br />
management issues. However, considering the fact that Extra is a zero debt company, we<br />
believe that the company will be easily able to raise fresh debt, if required.<br />
Extra needs to control its SGA<br />
costs to improve profitability<br />
Extra versus its peers<br />
Extra has been performing better than Jarir in terms of gross margin. However, Extra has a<br />
very low EBITDA margin as compared to Jarir, which we believe is on account of the fact that<br />
the company is incurring high selling and distribution expenses of 8-10% of revenue. This has<br />
resulted in higher SGA expenses (12-13%) as compared to Jarir (2.5-3%). Consequently,<br />
Extra’s ROA and ROE are also comparatively lower than Jarir’s. As per our analysis every 2%<br />
reduction in Extra’s SGA expenses, will result in a net profit growth of around 4%. On<br />
comparing with international peers who have similar market capitalization and operate in<br />
comparable product categories, Extra’s offers decent returns.<br />
Figure 25 Extra vs. other retailers, in terms of profitability<br />
Gross EBITDA<br />
Company Market Cap Ent. Value Margin Margin ROA ROE<br />
Name (SAR mn) (SAR mn) (%) (%) (%) (%)<br />
Jarir Marketing Co 9,525 9,642 15.3 12.8 32.3 57.3<br />
Conn's Inc 3,893 5,118 41.7 12.5 5.2 11.5<br />
Officemax Inc 3,152 5,140 25.4 2.6 11.7 54.9<br />
Mobilezone Holding 1,408 1,380 n/a 10.9 21.0 32.5<br />
United Electronics Co 2,490 2,394 17.7 6.4 17.1 35.2<br />
Source: Bloomberg, Company data, <strong>Al</strong> <strong>Rajhi</strong> <strong>Capital</strong><br />
Disclosures Please refer to the important disclosures at the back of this report. 17
United Electronics Company<br />
<strong>Retail</strong> –Industrial<br />
05 January 2013<br />
Valuation multiples are high,<br />
but we believe it is justified<br />
Extra seems fairly valued, but is worth a premium<br />
Extra’s EV/EBITDA multiples for 2012 and 2013 are lower than that of Jarir. However, we<br />
feel that Extra deserves a premium as the company 1) is more focused on electronics and the<br />
related home appliances segment, 2) is growing faster than Jarir, and 3) has started paying<br />
dividend, which we expect to improve in future. Extra commands a premium over<br />
international peers, given the bright sector outlook for the company in the GCC region over<br />
the next few years.<br />
Figure 26 Extra vs. other retailers, in terms of valuation<br />
Company P/E EV/EBITDA EV/EBITDA Div Yield<br />
Name 2013E 2012E 2013E 2013E<br />
Jarir Marketing Co 14.9 16.2 14.5 4.7<br />
Conn's Inc 14.7 12.0 9.6 n/a<br />
Officemax Inc 11.6 6.4 6.0 0.4<br />
Mobilezone Holding Ag-Br 14.6 9.4 8.9 6.2<br />
United Electronics Co 15.2 13.2 11.6 2.4<br />
Source: Bloomberg, Company data, <strong>Al</strong> <strong>Rajhi</strong> <strong>Capital</strong><br />
We expect Extra to achieve<br />
post strong results in Q4 2012<br />
Looking forward: we expect strong Q4 and full year<br />
results<br />
As we approach the end of 2012, we think it will be useful to highlight our forecasts for Q4<br />
2012 and the full year. We expect Extra to report strong results in Q4 as compared to the last<br />
three quarters. We expect revenue growth of 10% y-o-y in the last quarter of 2012, after a<br />
weak performance in Q3, partly due to better efficiencies from its three new stores which<br />
were launched in Q3 and partly due to the Hajj season. This should result in full-year sales<br />
growth of 16% y-o-y.<br />
In terms of profits, we expect Q4 net profit to grow by 15% as compared to the same period<br />
last year, resulting in 12% full-year net profit growth. We have kept SGA expenses in Q4 at<br />
lower levels (10.9% of revenue) as compared to Q3 2012 (13.1% of revenue). We believe SGA<br />
expenses as a percentage of revenue will be at similar levels seen in Q4 2011, on account of<br />
Hajj. However, we remain conservative and expect only a nominal improvement in margins<br />
for the full year 2012 as compared to 2011.<br />
Figure 27 Extra Q4 and full-year comparison<br />
% chg. % chg. % chg.<br />
SAR mn Q4 2011 Q3 2012 Q4 2012E y-o-y q-o-q FY2011 FY2012E y-o-y<br />
Revenue 724 699 799 10.4 14.4 2,462 2,850 15.8<br />
Gross Profit 120 121 136 13.0 12.3 435 500 14.8<br />
Gross Margin % 16.6 17.3 17.0 17.7 17.5<br />
Operating Profit 42 29 49 16.3 66.1 136 152 11.9<br />
Operating Margin % 5.8 4.2 6.1 5.5 5.3<br />
EBITDA 48 36 56 16.4 52.8 158 180 13.8<br />
EBITDA Margin % 6.6 5.2 7.0 6.4 6.3<br />
Net Income 41 28 48 15.3 67.5 132 148 12.0<br />
Net Margin % 5.7 4.1 5.9 5.4 5.2<br />
Source: Company data, <strong>Al</strong> <strong>Rajhi</strong> <strong>Capital</strong><br />
Disclosures Please refer to the important disclosures at the back of this report. 18
United Electronics Company<br />
<strong>Retail</strong> –Industrial<br />
05 January 2013<br />
We have valued Extra using a<br />
combination of two different<br />
methods<br />
Extra’s valuation: using multiple methods<br />
We use two valuation methods for Extra: the long-run DEP method and a blend of<br />
comparative P/E and EV/EBITDA multiples. For estimating Extra’s fair value using the longrun<br />
DEP, sometimes also called the discounted long-run economic value added (EVA)<br />
method, we use a WACC of 9.6%.<br />
Figure 28 Extra: Calculation of WACC<br />
Particulars<br />
Risk-free Rate 2.0%<br />
Market Risk Premium 11.5%<br />
Adjusted Beta 0.7<br />
Cost of Equity 9.6%<br />
Pre-tax Cost of Debt 0.0%<br />
Effective Tax rate 2.7%<br />
After-tax Cost of Debt 0.0%<br />
Target D/(D+E) 0.0%<br />
WACC 9.6%<br />
Source: Bloomberg, Company Data, <strong>Al</strong> <strong>Rajhi</strong> <strong>Capital</strong><br />
Using our core assumption of a period of competitive advantage of 25 years, we estimate fair<br />
value per share for Extra. In DEP forecasting, the appraised fair enterprise value may be<br />
broken down into two elements: opening invested capital, i.e. the debt and equity capital that<br />
have already been deployed in the business, and discounted economic profit, i.e. the present<br />
value of future economic returns (returns above the cost of capital). We believe the value of<br />
the company lies more in its future economic returns considering that it represents around<br />
90% of our fair enterprise value of SAR3.06bn.<br />
We arrive at a fair value of<br />
SAR132.1 per share for Extra<br />
based on DEP valuation<br />
Discounted economic profit is shown in the table below as “total value created/destroyed”.<br />
We add the value of associates as well as net debt forecasted for 2012 (in the case of Extra net<br />
debt is negative) to the appraised enterprise value to arrive at the estimated equity value of<br />
SAR3.17bn. Dividing this value with the current number of outstanding shares, we estimate<br />
Extra’s fair value per share at SAR132.1.<br />
Figure 29 Extra valuation: Discounted economic profit<br />
Particulars<br />
SAR mn<br />
Total value created / (destroyed) 2,753<br />
Opening Invested capital 310<br />
Total Enterprise Value 3,063<br />
Value of associates 1<br />
Value of debt 108<br />
Value of minorities 0<br />
Equity Value 3,171<br />
Fair value per share (SAR) 132.1<br />
Source: Company data, <strong>Al</strong> <strong>Rajhi</strong> <strong>Capital</strong><br />
We have used weighted P/E<br />
and EV/EBITDA multiples for<br />
valuation based on comparative<br />
multiples<br />
For the comparative analysis, we use the weighted 2013 PE and EV/EBITDA multiples of<br />
Extra’s peers. We assign the highest weight to Jarir’s multiples as it is has a very similar<br />
profile and is influenced by the same macroeconomic factors as Extra. We assign lowest<br />
weight to Mobilezone as it has lower market capitalization than Extra.<br />
Figure 30 Calculation of P/E and EV/EBITDA multiples<br />
Company Name Weights Mkt. Cap. (SAR mn) P/E EV/EBITDA<br />
Jarir Marketing Co 66% 9,525 14.9 14.5<br />
Conn's Inc 20% 3,893 14.7 9.6<br />
Officemax Inc 10% 3,152 11.6 6.0<br />
Mobilezone Holding Ag-Br 4% 1,408 14.6 8.9<br />
Average 14.5 12.5<br />
Source: Bloomberg, <strong>Al</strong> <strong>Rajhi</strong> <strong>Capital</strong><br />
Disclosures Please refer to the important disclosures at the back of this report. 19
United Electronics Company<br />
<strong>Retail</strong> –Industrial<br />
05 January 2013<br />
Using the P/E multiple, we arrive at the appraised value of SAR98.7 per share.<br />
Figure 31 P/E multiple approach<br />
Particulars<br />
Extra's 2013 EPS (SAR) 6.8<br />
P/E multiple (x) 14.5<br />
Price per share (SAR) 98.7<br />
Source: <strong>Al</strong> <strong>Rajhi</strong> <strong>Capital</strong><br />
Using the EV/EBITDA multiple we arrive at an enterprise value of SAR2,483mn. Since net<br />
debt is negative, we add it to the enterprise value along with the book value of associates to<br />
arrive at the appraised value of SAR2,591mn. Dividing this by the total number of shares, we<br />
arrive at Extra’s appraised value of SAR107.9 per share.<br />
Figure 32 EV/EBITDA multiple approach<br />
Particulars<br />
SAR mn<br />
Extra's 2013E EBITDA 199.3<br />
EV/EBITDA multiple (x) 12.5<br />
Extra's enterprise value 2,482.5<br />
Value of non-core assets 0.3<br />
Value of debt 107.7<br />
Value of minorities 0.0<br />
Appraised value of the enterprise 2,590.5<br />
# of Shares (mn) 24.0<br />
Price per share (SAR) 107.9<br />
Source: Company data, <strong>Al</strong> <strong>Rajhi</strong> <strong>Capital</strong><br />
We arrive at a fair value of<br />
SAR103.3 per share for Extra<br />
based on comparative multiples<br />
The simple average of the appraised values arrived at using the P/E and EV/EBITDA<br />
multiples works out to SAR103.3 per share.<br />
Figure 33 Extra's value using relative valuation methods<br />
Particulars<br />
Appraised value using P/E multiple 107.9<br />
Appraised value using EV/EBITDA multiple 98.7<br />
SAR<br />
Fair value per share 103.3<br />
Source: <strong>Al</strong> <strong>Rajhi</strong> <strong>Capital</strong><br />
We arrive at a target price of<br />
SAR123.5per share for Extra<br />
combining valuation under both<br />
the methods<br />
Finally, we take the weighted valuation of the long-run EVA and comparative multiples<br />
analysis methods. We assign a 70% weight to the fair value arrived using the EVA method<br />
and a 30% weight to the fair value arrived using the comparative multiples method to arrive<br />
at the final fair value of Extra at SAR123.5per share, implying a 19% upside from the current<br />
market price. We believe this valuation as justified, given the positive outlook for the retail<br />
sector in the Kingdom and the growth prospects of the company.<br />
Disclosures Please refer to the important disclosures at the back of this report. 20
United Electronics Company<br />
<strong>Retail</strong> –Industrial<br />
05 January 2013<br />
We expect revenue to be<br />
around SAR2.8bn for 2012<br />
Income Statement (SARmn) 12/10A 12/11A 12/12A 12/13E 12/14E<br />
Revenue 1,778 2,462 2,850 3,302 3,830<br />
Cost of Goods Sold (1,456) (2,026) (2,350) (2,730) (3,175)<br />
Gross Profit 322 435 500 572 655<br />
Government Charges<br />
S.G. & A. Costs (223) (299) (348) (404) (475)<br />
Operating EBIT 99 136 152 168 180<br />
Cash Operating Costs (1,660) (2,304) (2,671) (3,103) (3,612)<br />
EBITDA 118 158 180 199 218<br />
Depreciation and Amortisation (19) (22) (28) (32) (38)<br />
Operating Profit 99 136 152 168 180<br />
Net financing income/(costs) (0) (0) (0) - -<br />
Forex and Related Gains - - - - -<br />
Provisions - - - - -<br />
Other Income 1 0 0 - -<br />
Other Expenses<br />
Net Profit Before Taxes 100 136 152 168 180<br />
Taxes (2) (3) (4) (4) (5)<br />
Minority Interests - - - - -<br />
Net profit available to shareholders 98 132 148 163 176<br />
Dividends - (60) (60) (60) (105)<br />
Transfer to <strong>Capital</strong> Reserve<br />
12/10A 12/11A 12/12A 12/13E 12/14E<br />
Adjusted Shares Out (mn) 24.00 24.00 24.00 24.00 24.00<br />
CFPS (SAR) 6.86 6.43 7.32 8.13 8.89<br />
EPS (SAR) 5.75 5.51 6.17 6.81 7.31<br />
DPS (SAR) 0.000 2.500 2.500 2.500 4.388<br />
Growth 12/10A 12/11A 12/12A 12/13E 12/14E<br />
Revenue Growth 23.5% 38.4% 15.8% 15.8% 16.0%<br />
Gross Profit Growth 42.8% 35.1% 14.8% 14.4% 14.5%<br />
EBITDA Growth 94.5% 33.6% 13.8% 10.9% 9.3%<br />
Operating Profit Growth 143.1% 36.7% 11.9% 10.2% 7.4%<br />
Net Profit Growth 138.1% 35.3% 12.0% 10.3% 7.4%<br />
EPS Growth 40.1% -4.2% 12.0% 10.3% 7.4%<br />
Margins 12/10A 12/11A 12/12A 12/13E 12/14E<br />
Gross profit margin 18.1% 17.7% 17.5% 17.3% 17.1%<br />
EBITDA margin 6.6% 6.4% 6.3% 6.0% 5.7%<br />
Operating Margin 5.6% 5.5% 5.3% 5.1% 4.7%<br />
Pretax profit margin 5.6% 5.5% 5.3% 5.1% 4.7%<br />
Net profit margin 5.5% 5.4% 5.2% 4.9% 4.6%<br />
Other Ratios 12/10A 12/11A 12/12A 12/13E 12/14E<br />
ROCE 37.9% 35.3% 32.4% 27.0% 25.6%<br />
ROIC 44.3% 56.7% 47.7% 46.1% 45.3%<br />
ROE 50.3% 42.7% 35.4% 31.8% 29.0%<br />
Effective Tax Rate 2.3% 2.5% 2.7% 2.5% 2.5%<br />
Capex/Sales 6.5% 2.9% 3.5% 3.5% 3.5%<br />
Dividend Payout Ratio 0.0% 45.4% 40.5% 36.7% 60.0%<br />
Extra trades at 2013 PE of<br />
15.2x<br />
Valuation Measures 12/10A 12/11A 12/12A 12/13E 12/14E<br />
P/E (x) 18.0 18.8 16.8 15.2 14.2<br />
P/CF (x) 15.1 16.1 14.2 12.8 11.7<br />
P/B (x) 10.2 6.6 5.4 4.4 3.8<br />
EV/Sales (x) 1.0 1.0 0.8 0.7 0.6<br />
EV/EBITDA (x) 14.8 15.3 13.2 11.6 10.3<br />
EV/EBIT (x) 17.7 17.8 15.7 13.8 12.5<br />
EV/IC (x) 10.6 7.8 6.7 6.0 5.6<br />
Dividend Yield 0.0% 2.4% 2.4% 2.4% 4.2%<br />
Source: Company data, <strong>Al</strong> <strong>Rajhi</strong> <strong>Capital</strong><br />
Disclosures Please refer to the important disclosures at the back of this report. 21
United Electronics Company<br />
<strong>Retail</strong> –Industrial<br />
05 January 2013<br />
Balance Sheet (SARmn) 12/10A 12/11A 12/12A 12/13E 12/14E<br />
Cash and Cash Equivalents 30 65 108 226 294<br />
Current Receivables 5 5 3 4 4<br />
Inventories 257 341 575 588 575<br />
Other current assets 30 46 91 91 91<br />
Total Current Assets 322 457 777 909 963<br />
Fixed Assets 267 317 388 472 568<br />
Investments 0 1 0 0 0<br />
Goodwill - - - - -<br />
Other Intangible Assets - - - - -<br />
Total Other Assets - - - - -<br />
Total Non-current Assets 267 318 388 472 569<br />
Total Assets 589 775 1,166 1,381 1,532<br />
Short Term Debt 9 - - - -<br />
Accounts Payable 304 370 671 735 804<br />
Accrued Expenses - - - - -<br />
Dividends Payable - - - - -<br />
Other Current Liabilities - - - - -<br />
Total Current Liabilities 313 370 671 735 804<br />
Long-Term Debt 12 - - 48 48<br />
Other LT Payables 7 9 8 8 8<br />
Provisions 14 21 25 25 25<br />
Total Non-current Liabilities 33 30 32 81 81<br />
Minority interests - - - - -<br />
Paid-up share capital 240 240 240 240 240<br />
Total Reserves 3 135 222 325 407<br />
Total Shareholders' Equity 243 375 462 565 647<br />
Total Equity 243 375 462 565 647<br />
Total Liabilities & Shareholders' Equity 589 775 1,166 1,381 1,532<br />
Ratios 12/10A 12/11A 12/12A 12/13E 12/14E<br />
Net Debt (SARmn) (9) (65) (108) (178) (246)<br />
Net Debt/EBITDA (x) (0.08) (0.41) (0.60) (0.89) (1.13)<br />
Net Debt to Equity -3.8% -17.2% -23.3% -31.5% -38.0%<br />
EBITDA Interest Cover (x) 686.5 354.0 1,436.6<br />
BVPS (SAR) 10.14 15.64 19.25 23.56 26.95<br />
Cashflow Statement (SARmn) 12/10A 12/11A 12/12A 12/13E 12/14E<br />
Net Income before Tax & Minority Interest 100 136 152 168 180<br />
Depreciation & Amortisation 19 22 28 32 38<br />
Decrease in Working <strong>Capital</strong> 71 (35) 25 51 83<br />
Other Operating Cashflow (187) 6 (2) (4) (5)<br />
Cashflow from Operations 3 129 203 246 296<br />
<strong>Capital</strong> Expenditure (115) (72) (99) (116) (134)<br />
New Investments 4 0 - - -<br />
Others 3 (0) - - -<br />
Cashflow from investing activities (108) (73) (99) (116) (134)<br />
Net Operating Cashflow (106) 56 104 130 162<br />
Dividends paid to ordinary shareholders - - (60) (60) (94)<br />
Proceeds from issue of shares - - - - -<br />
Effects of Exchange Rates on Cash - - (0) - -<br />
Other Financing Cashflow 191 (3) (1) - -<br />
Cashflow from financing activities 121 (22) (61) (12) (94)<br />
Total cash generated 16 34 43 118 68<br />
Cash at beginning of period 15 30 65 108 226<br />
Implied cash at end of year 30 65 108 226 294<br />
Ratios 12/10A 12/11A 12/12A 12/13E 12/14E<br />
Capex/Sales 6.5% 2.9% 3.5% 3.5% 3.5%<br />
Source: Company data, <strong>Al</strong> <strong>Rajhi</strong> <strong>Capital</strong><br />
Disclosures Please refer to the important disclosures at the back of this report. 22
RSI10<br />
Vol th<br />
Fawaz Abdulaziz <strong>Al</strong>hokair<br />
<strong>Retail</strong> –Industrial<br />
ALHOKAIR AB: Saudi Arabia<br />
05January 2013<br />
US$2.0bn 51% US$1.29mn<br />
Market cap Free float Avg. daily volume<br />
Target price 124.1 15 % over current<br />
Consensus price 120.45 12.8% over current<br />
Current price 107.5 as at 26/12/2012<br />
Research Department<br />
Majed <strong>Al</strong> Solaim<br />
Tel +966 1211 9471, alsolaimm@alrajhi-capital.com<br />
Underweight Neutral Overweight<br />
Overweight<br />
Key themes<br />
We expect the retail sector in Saudi Arabia to<br />
continue its growth momentum on the back of everincreasing<br />
population, improving education, and<br />
changing lifestyle. <strong>Al</strong>hokair holds a strong position in<br />
the Saudi fashion market. The company will continue<br />
to grow through M&A activities as well as roll out of<br />
new stores.<br />
Implications<br />
<strong>Al</strong>hokair is one of our preferred stocks in the retail<br />
sector. On the operational front, the company has<br />
been performing well with sound financials. We<br />
expect M&A activities, new store launches, and<br />
healthy same-store sales to drive the company’s<br />
growth over the near-term.<br />
Performance<br />
Earnings<br />
Period End (SAR) 03/11A 03/12A 03/13E 03/14E<br />
Revenue (mn) 2,575 3,203 4,327 5,149<br />
Revenue Growth 24.1% 24.4% 35.1% 19.0%<br />
EBITDA (mn) 307 545 739 830<br />
EBITDA Growth -3.3% 77.3% 35.8% 12.3%<br />
EPS 4.52 6.39 8.60 9.73<br />
EPS Growth 36.6% 41.4% 34.6% 13.1%<br />
Source: Company data, <strong>Al</strong> <strong>Rajhi</strong> <strong>Capital</strong><br />
Valuation<br />
16<br />
14<br />
12<br />
10<br />
8<br />
6<br />
4<br />
2<br />
113<br />
103<br />
93<br />
83<br />
73<br />
63<br />
53<br />
70<br />
30<br />
1000 -10<br />
500<br />
Price Close<br />
P/E (x)<br />
0<br />
01/09 01/10 01/11 01/12<br />
Source: Company data, <strong>Al</strong> <strong>Rajhi</strong> <strong>Capital</strong><br />
MAV10<br />
12/11 04/12 07/12 10/12<br />
Source: Bloomberg<br />
169<br />
154<br />
139<br />
124<br />
109<br />
94<br />
79<br />
<strong>Al</strong>hokair<br />
Upside potential<br />
<strong>Al</strong>hokair continued to deliver an impressive performance during the second<br />
quarter of 2012/2013 (its financial year ends March 31st) on the back of strong<br />
like-for-like sales and launch of new stores. The company was able to report<br />
37% and 25% y-o-y growth in its revenue and net profit respectively. Further,<br />
<strong>Al</strong>hokair finalized the acquisition of NESK Group, which contributed positively<br />
in the last quarter. International operations coupled with acquisition of local<br />
brands will spur the company’s near-term growth. We have revised our<br />
forecasts on the back of strong Q2 results to arrive at a new target price of<br />
SAR124.1 (old: SAR91.4). The new target price offers an upside potential of 15%<br />
due to which we upgrade our rating to Overweight.<br />
Solid revenue growth: <strong>Al</strong>hokair achieved 37% y-o-y growth in Q2, driven by<br />
the acquisition of NESK, a fast-growing apparel market in the Kingdom, launch<br />
of new stores, the Ramadan season and the start of the new academic year. The<br />
company’s same-store sales are expected to grow between 6-7% y-o-y in the<br />
second half of 2012. According to our estimates, <strong>Al</strong>hokair has so far achieved an<br />
organic growth of above 5.5% in 2012. We expect the company to achieve 35%<br />
sales growth this year to reach SAR4,327mn.<br />
Outstanding bottom-line: The company reported a net income of SAR252mn<br />
in Q2 beating our estimates of SAR223mn on the back of international<br />
operations and acquisition of new brands. We believe the company will continue<br />
its strong performance through various expansion programs locally and<br />
internationally.<br />
Higher dividends expected: We believe <strong>Al</strong>hokair’s bottom-line growth will<br />
enable the management to distribute higher dividends. The company distributed<br />
SAR2 per share in cash dividends for the year 2011/2012. We expect <strong>Al</strong>hokair to<br />
increase its dividends to SAR3 per share for this year on the back of a strong<br />
performance. According to our estimates, this implies a payout ratio of 35% and<br />
a dividend yield of 2.8%.<br />
Changes in calculation of gross margin: Starting from the last quarter,<br />
<strong>Al</strong>hokair has adopted the direct cost method by calculating gross margin after<br />
deducting the direct costs of all stores. The new presentation is aimed at<br />
controlling total costs at the store level. Therefore, we will see gross margin<br />
dropping by almost 50% offset by a corresponding decline in SG&A. Hence,<br />
when comparing with other companies, it will be useful to compare with EBIT<br />
margin of the company rather than gross margin.<br />
Valuation Given the impressive results, following the successful acquisition of<br />
NESK, as well as the ongoing store openings locally and internationally, we have<br />
revised our forecasts for <strong>Al</strong>hokair and increased our revenue and profit<br />
forecasts. We have set a new target price of SAR124.1(old target: SAR91.4). The<br />
target price offers an upside potential of 15%. Thus, we have upgraded our rating<br />
from Neutral to Overweight. <strong>Al</strong>hokair trades at a 2013 -2014 EV/EBITDA<br />
multiple of 9x and a PE ratio of 11x.<br />
Disclosures Please refer to the important disclosures at the back of this report.<br />
Powered by Enhanced Datasystems’ EFA Platform 23
Fawaz Abdulaziz <strong>Al</strong>hokair<br />
<strong>Retail</strong> –Industrial<br />
05 January 2013<br />
Corporate summary Share information Valuation<br />
Fawaz Abdulaziz <strong>Al</strong>hokair Company is<br />
a leading fashion retailer in Saudi<br />
Arabia, with a market capitalization of<br />
US$2bn. The company primarily sells a<br />
wide gamut of fashion items such as<br />
luxury apparel, sport wear, shoes,<br />
bags, and fashion accessories. <strong>Al</strong>hokair<br />
is a franchisee for 50 international<br />
brands such as Zara, Gap, Marks &<br />
Spencer, and <strong>Al</strong>do.<br />
Market cap (SAR/US$) 7.53bn / 2.007bn<br />
52-week range 62.50 - 107.5<br />
Daily avg volume (US$)<br />
1.220mn<br />
Shares outstanding<br />
70.00mn<br />
Free float (est) 30%<br />
Performance: 1M 3M 12M<br />
Absolute 10.5% 13.8% 66.7%<br />
Relative to index 7% 13.2% 58.2%<br />
Major Shareholder:<br />
Fas Company 49.0%<br />
Abdulmajeed Abdulaziz <strong>Al</strong>hokair 7.0%<br />
Source: Bloomberg, <strong>Al</strong> <strong>Rajhi</strong> <strong>Capital</strong><br />
Period End 03/11A 03/12A 03/13E 03/14E<br />
Revenue (SARmn) 2,575 3,203 4,327 5,149<br />
EBITDA (SARmn) 307 545 739 830<br />
Net Profit (SARmn) 316 447 602 681<br />
EPS (SAR) 4.52 6.39 8.60 9.73<br />
DPS (SAR) 2.50 2.00 3.00 4.50<br />
EPS Growth 36.6% 41.4% 34.6% 13.1%<br />
EV/EBITDA (x) 21.2 12.3 10.0 9.0<br />
P/E (x) 23.8 16.8 12.5 11.0<br />
P/B (x) 6.9 5.4 4.2 3.5<br />
Dividend Yield 2.3% 1.9% 2.8% 4.2%<br />
Source: Company data, <strong>Al</strong> <strong>Rajhi</strong> <strong>Capital</strong><br />
Expectations for Q3 2012/2013<br />
Decent results expected<br />
Figure 34 <strong>Al</strong>hokair : Q3 & FY2012/13 results estimates<br />
(SAR) mn 2011Q3A 2012Q3E YOY % chg. FY2011/12A FY2012/13E YOY % chg.<br />
Revenues 758.3 1,006.4 32.7% 3,202.7 4,327.4 35.1%<br />
EBITDA 107.9 140.9 544.5 739.4 35.8%<br />
EBITDA margin (%) 14.2% 14.0% 17.0% 17.1%<br />
Operating profit 74.7 98.7 32.1% 425.6 586.2 37.7%<br />
Operating profit margin (%) 9.9% 9.8% 13.3% 13.5%<br />
Net Income 76.5 101.3 32.4% 447.4 602.3 34.6%<br />
Source: Company data, <strong>Al</strong> <strong>Rajhi</strong> <strong>Capital</strong><br />
Disclosures Please refer to the important disclosures at the back of this report. 24
Fawaz Abdulaziz <strong>Al</strong>hokair<br />
<strong>Retail</strong> –Industrial<br />
05 January 2013<br />
Income Statement (SARmn) 03/10A 03/11A 03/12A 03/13E 03/14E<br />
Revenue 2,074 2,575 3,203 4,327 5,149<br />
Cost of Goods Sold (1,161) (1,435) (1,755) (3,093) (3,958)<br />
Gross Profit 914 1,139 1,447 1,235 1,190<br />
Government Charges<br />
S.G. & A. Costs (675) (877) (1,022) (649) (522)<br />
Operating EBIT 239 262 426 586 668<br />
Cash Operating Costs (1,757) (2,268) (2,658) (3,588) (4,319)<br />
EBITDA 318 307 545 739 830<br />
Depreciation and Amortisation (78) (45) (119) (153) (162)<br />
Operating Profit 239 262 426 586 668<br />
Net financing income/(costs) (43) (32) (18) (31) (28)<br />
Forex and Related Gains - - - - -<br />
Provisions - - - - -<br />
Other Income 45 105 76 79 79<br />
Other Expenses<br />
Net Profit Before Taxes 241 335 484 634 719<br />
Taxes (11) (15) (36) (33) (36)<br />
Minority Interests 1 (3) (1) 1 (2)<br />
Net profit available to shareholders 232 316 447 602 681<br />
Dividends (140) (175) (140) (210) (315)<br />
Transfer to <strong>Capital</strong> Reserve<br />
03/10A 03/11A 03/12A 03/13E 03/14E<br />
Adjusted Shares Out (mn) 70.00 70.00 70.00 70.00 70.00<br />
CFPS (SAR) 4.41 5.21 8.10 10.77 12.08<br />
EPS (SAR) 3.31 4.52 6.39 8.60 9.73<br />
DPS (SAR) 2.000 2.500 2.000 3.000 4.500<br />
We expect double digit revenue<br />
growth in the forecast period<br />
Growth 03/10A 03/11A 03/12A 03/13E 03/14E<br />
Revenue Growth 9.9% 24.1% 24.4% 35.1% 19.0%<br />
Gross Profit Growth 14.4% 24.7% 27.1% -14.7% -3.6%<br />
EBITDA Growth 87.7% -3.3% 77.3% 35.8% 12.3%<br />
Operating Profit Growth 128.9% 9.5% 62.5% 37.7% 14.0%<br />
Net Profit Growth 68.2% 36.6% 41.4% 34.6% 13.1%<br />
EPS Growth 68.2% 36.6% 41.4% 34.6% 13.1%<br />
Margins 03/10A 03/11A 03/12A 03/13E 03/14E<br />
Gross profit margin 44.1% 44.2% 45.2% 28.5% 23.1%<br />
EBITDA margin 15.3% 11.9% 17.0% 17.1% 16.1%<br />
Operating Margin 11.5% 10.2% 13.3% 13.5% 13.0%<br />
Pretax profit margin 11.6% 13.0% 15.1% 14.6% 14.0%<br />
Net profit margin 11.2% 12.3% 14.0% 13.9% 13.2%<br />
Other Ratios 03/10A 03/11A 03/12A 03/13E 03/14E<br />
ROCE 16.9% 19.4% 24.5% 22.7% 22.7%<br />
ROIC 27.0% 21.8% 33.2% 36.5% 27.1%<br />
ROE 23.7% 28.9% 35.8% 37.7% 34.4%<br />
Effective Tax Rate 4.4% 4.5% 7.4% 5.2% 5.0%<br />
Capex/Sales 6.0% 2.5% 8.6% 7.7% 4.9%<br />
Dividend Payout Ratio 60.5% 55.3% 31.3% 34.9% 46.2%<br />
Valuation Measures 03/10A 03/11A 03/12A 03/13E 03/14E<br />
P/E (x) 32.5 23.8 16.8 12.5 11.0<br />
P/CF (x) 24.4 20.6 13.3 10.0 8.9<br />
P/B (x) 6.9 6.9 5.4 4.2 3.5<br />
EV/Sales (x) 3.1 2.5 2.1 1.7 1.5<br />
EV/EBITDA (x) 19.9 21.2 12.3 10.0 9.0<br />
EV/EBIT (x) 26.5 24.9 15.7 12.6 11.2<br />
EV/IC (x) 5.5 5.5 4.4 3.1 2.8<br />
Dividend Yield 1.9% 2.3% 1.9% 2.8% 4.2%<br />
Source: Company data, <strong>Al</strong> <strong>Rajhi</strong> <strong>Capital</strong><br />
Disclosures Please refer to the important disclosures at the back of this report. 25
Fawaz Abdulaziz <strong>Al</strong>hokair<br />
<strong>Retail</strong> –Industrial<br />
05 January 2013<br />
Balance Sheet (SARmn) 03/10A 03/11A 03/12A 03/13E 03/14E<br />
Cash and Cash Equivalents 76 107 198 269 328<br />
Current Receivables - - - - -<br />
Inventories 476 599 746 1,017 1,179<br />
Other current assets 362 494 476 626 626<br />
Total Current Assets 914 1,199 1,420 1,912 2,132<br />
Fixed Assets 584 613 790 1,193 1,286<br />
Investments 260 219 245 245 245<br />
Goodwill 61 61 61 473 473<br />
Other Intangible Assets 78 81 78 93 93<br />
Total Other Assets - - - - -<br />
Total Non-current Assets 983 975 1,174 2,003 2,096<br />
Total Assets 1,897 2,174 2,594 3,915 4,229<br />
Short Term Debt 70 161 227 279 279<br />
Accounts Payable 149 285 249 429 374<br />
Accrued Expenses - - - - -<br />
Dividends Payable - - - - -<br />
Other Current Liabilities 224 335 332 563 563<br />
Total Current Liabilities 444 782 807 1,270 1,216<br />
Long-Term Debt 300 225 313 763 763<br />
Other LT Payables - - - - -<br />
Provisions 39 42 49 64 64<br />
Total Non-current Liabilities 339 267 362 827 827<br />
Minority interests 20 31 23 23 25<br />
Paid-up share capital 700 700 700 700 700<br />
Total Reserves 394 395 702 1,094 1,461<br />
Total Shareholders' Equity 1,094 1,095 1,402 1,794 2,161<br />
Total Equity 1,114 1,126 1,425 1,817 2,186<br />
Total Liabilities & Shareholders' Equity 1,897 2,174 2,594 3,915 4,229<br />
Ratios 03/10A 03/11A 03/12A 03/13E 03/14E<br />
Net Debt (SARmn) 294 279 341 773 715<br />
Net Debt/EBITDA (x) 0.93 0.91 0.63 1.05 0.86<br />
Net Debt to Equity 26.4% 24.7% 23.9% 42.5% 32.7%<br />
EBITDA Interest Cover (x) 7.4 9.6 30.7 23.8 30.2<br />
BVPS (SAR) 15.63 15.64 20.03 25.64 30.87<br />
Cashflow Statement (SARmn) 03/10A 03/11A 03/12A 03/13E 03/14E<br />
Net Income before Tax & Minority Interest 241 335 484 634 719<br />
Depreciation & Amortisation 78 45 119 153 162<br />
Decrease in Working <strong>Capital</strong> (88) (119) (181) (162) (217)<br />
Other Operating Cashflow 44 15 (23) (22) (36)<br />
Cashflow from Operations 276 276 400 604 628<br />
<strong>Capital</strong> Expenditure (124) (63) (276) (332) (255)<br />
New Investments (98) 30 (31) (479) -<br />
Others (6) 23 (6) (15) -<br />
Cashflow from investing activities (228) (9) (313) (826) (255)<br />
Net Operating Cashflow 48 267 86 (223) 373<br />
Dividends paid to ordinary shareholders - (261) (140) (210) (315)<br />
Proceeds from issue of shares - - - - -<br />
Effects of Exchange Rates on Cash - - - - -<br />
Other Financing Cashflow 3 9 (9) 1 -<br />
Cashflow from financing activities 3 (236) 5 294 (315)<br />
Total cash generated 52 31 91 71 58<br />
Cash at beginning of period 24 76 107 198 269<br />
Implied cash at end of year 76 107 198 269 328<br />
Ratios 03/10A 03/11A 03/12A 03/13E 03/14E<br />
Capex/Sales 6.0% 2.5% 8.6% 7.7% 4.9%<br />
Source: Company data, <strong>Al</strong> <strong>Rajhi</strong> <strong>Capital</strong><br />
Disclosures Please refer to the important disclosures at the back of this report. 26
RSI10<br />
Vol mn<br />
Abdullah <strong>Al</strong> Othaim Markets<br />
<strong>Retail</strong><br />
AOTHAIM AB: Saudi Arabia<br />
05 January 2013<br />
US$0.5bn 72% US$0.65mn<br />
Market cap Free float Avg. daily volume<br />
Target price 96.7 19% over current<br />
Consensus price 101.7 25%<br />
Current price 81.25 as at 02/01/2013<br />
Research Department<br />
Majed <strong>Al</strong>solaim<br />
+966 1211 9471, alsolaimm@alrajhi-capital.com<br />
Underweight Neutral Overweight<br />
Overweight<br />
Key themes<br />
We expect the retail sector in Saudi Arabia to<br />
continue on its growth path on the back of everincreasing<br />
population, improving education, and<br />
changing lifestyle. <strong>Al</strong>othaim enjoys a strong presence<br />
in the grocery market. We expect the company to<br />
continue its growth journey by opening new stores as<br />
well as benefiting from the changing lifestyle in the<br />
Kingdom.<br />
Implications<br />
<strong>Al</strong>othaim is well managed, both operationally and<br />
financially, which makes it attractive. In our view, the<br />
stock has potential for further upside, given the yearto-date<br />
dip in <strong>Al</strong>othaim’s share price.<br />
Performance<br />
108<br />
103<br />
98<br />
93<br />
88<br />
83<br />
78<br />
70<br />
30<br />
-102<br />
1<br />
1<br />
Earnings<br />
Period End (SAR) 12/11A 12/12E 12/13E 12/14E<br />
Revenue (mn) 4,091 4,326 4,592 5,090<br />
Revenue Growth 16.2% 5.7% 6.2% 10.9%<br />
EBITDA (mn) 233 234 294 325<br />
EBITDA Growth 22.4% 0.3% 25.7% 10.6%<br />
EPS 6.67 6.77 7.61 8.69<br />
EPS Growth -7.3% 1.5% 12.4% 14.2%<br />
Source: Company data, <strong>Al</strong> <strong>Rajhi</strong> <strong>Capital</strong><br />
Valuation<br />
Source: Bloomberg<br />
Price Close<br />
P/E (x)<br />
20<br />
18<br />
16<br />
14<br />
12<br />
10<br />
8<br />
6<br />
4<br />
2<br />
0<br />
01/09 01/10 01/11 01/12<br />
Source: Company data, <strong>Al</strong> <strong>Rajhi</strong> <strong>Capital</strong><br />
MAV10<br />
12/11 04/12 07/12 10/12<br />
107<br />
100<br />
92<br />
85<br />
77<br />
70<br />
62<br />
<strong>Al</strong>othaim<br />
Recovered in Q3<br />
<strong>Al</strong>othaim remains one of the attractive stocks in the Saudi retail industry. After<br />
a disappointing performance in the first half of 2012 (9% y-o-y decline in net<br />
profit), the company delivered a decent performance in Q3, reporting a growth<br />
of 13% y-o-y, reaching SAR40.7mn. One of <strong>Al</strong>othaim’s main challenges is to<br />
reduce high labor and marketing costs, which are pressurizing its profit<br />
margin. We believe the launch of new stores and improving same-store sales<br />
will enable the company to report decent results going forward. We remain<br />
Overweight on <strong>Al</strong>othaim, but due to its underperformance, especially in the<br />
first half of 2012, we have reduced our target price from SAR109.4 to SAR96.7.<br />
Slight growth in top-line <strong>Al</strong>othaim reported revenue growth of 3.5% y-o-y for<br />
the nine months ended September 2012, reaching SAR3,239mn, on the back of<br />
high volumes from same-store-sales (SSS) and leasing income. At the end of<br />
2012, we expect the company’s revenue to reach SAR4,325mn, reflecting a 5.7%<br />
y-o-y increase backed by healthy same-store sales growth and leasing income.<br />
We expect SSS to continue to grow by 3.5% y-o-y. Further, the leasing income<br />
from other retailers will contribute substantially to <strong>Al</strong>othaim’s Q4 revenue.<br />
Consequently, we believe the company will continue to maintain its 3.8% market<br />
share and position itself as the second-largest grocery retailer in Saudi Arabia.<br />
Significant labor cost effect: <strong>Al</strong>othaim has incurred high labor costs mainly<br />
due to the fact it has been incorporating the minimum wage of SAR3,000 since<br />
2011 coupled with high attrition. In addition, the labor cost has risen by SAR12-<br />
15mn as a result of the Ministry of Labor’s recent decision to hike work permit<br />
fees from SAR100 to SAR2,400 annually for private companies, who employ<br />
more foreigners than Saudis. We believe these higher costs will squeeze<br />
<strong>Al</strong>othaim’s profit margin.<br />
New stores expansion likely to gain pace: The company has ambitious plans<br />
to increase its selling area by focusing more on supermarkets and hypermarkets.<br />
<strong>Al</strong>othaim’s management plans to open around 10-15 stores in Saudi Arabia each<br />
year. However, <strong>Al</strong>othaim is very selective about choosing its store locations while<br />
looking out for the best prices. As a result, we believe the company will roll out<br />
7-9 outlets every year to reach 130 stores by 2014, with a total selling space of<br />
around 290,000 square meters.<br />
Valuation: We believe <strong>Al</strong>othaim will continue to report decent results based on<br />
its same-store sales growth, expansion plans, and rising population. Given the<br />
year-to-date dip in <strong>Al</strong>othaim’s share price (around 20%), we believe the<br />
company is attractive (current price SAR81.25). Thus, we reiterate our<br />
Overweight rating on the stock but have revised our target price downward from<br />
SAR109.4 to SAR96.7, implying an upside potential of 19%. <strong>Al</strong>othaim trades at a<br />
2013 EV/EBITDA multiple of 5.7x and a PE ratio of 10.7x.<br />
Disclosures Please refer to the important disclosures at the back of this report.<br />
Powered by Enhanced Datasystems’ EFA Platform 27
Abdullah <strong>Al</strong> Othaim Markets<br />
<strong>Retail</strong><br />
05 January 2013<br />
Corporate summary Share information Valuation<br />
Abdullah <strong>Al</strong> Othaim Markets is the<br />
second-largest grocery retailer in Saudi<br />
Arabia with a market capitalization of<br />
$US0.5bn. The company is an<br />
extension of Saleh <strong>Al</strong>-Othaim company,<br />
which was founded in 1957. <strong>Al</strong>othaim<br />
operates around 108 stores which sell<br />
food products & supplies, household<br />
equipments, electrical and mechanical<br />
equipments, cooked and non-cooked<br />
catering services and other products at<br />
wholesale and retail level. Furthermore,<br />
<strong>Al</strong>-Othaim owns private labels such as<br />
HALEY, Proof, SHERR, and REX.<br />
Market cap (SAR/US$) 1.851bn / 0.493bn<br />
52-week range 80.50 - 102.5<br />
Daily avg volume (US$)<br />
0.532mn<br />
Shares outstanding<br />
22.50mn<br />
Free float (est) 66%<br />
Performance: 1M 3M 12M<br />
Absolute 0.3% -7.1% -16.5%<br />
Relative to index -4.2% -6.9% -22.8%<br />
Major Shareholder:<br />
<strong>Al</strong>othaim company 27.6%<br />
Abdullah Saleh <strong>Al</strong>othaim 6.0%<br />
Source: Bloomberg, <strong>Al</strong> <strong>Rajhi</strong> <strong>Capital</strong><br />
Period End 12/11A 12/12A 12/13E 12/14E<br />
Revenue (SARmn) 4,091 4,326 4,592 5,090<br />
EBITDA (SARmn) 233 234 294 325<br />
Net Profit (SARmn) 150 152 171 196<br />
EPS (SAR) 6.67 6.77 7.61 8.69<br />
DPS (SAR) - 3.50 3.50 3.65<br />
EPS Growth -7.3% 1.5% 12.4% 14.2%<br />
EV/EBITDA (x) 7.3 7.1 5.7 5.1<br />
P/E (x) 12.2 12.0 10.7 9.4<br />
P/B (x) 3.4 2.7 2.4 2.1<br />
Dividend Yield 0.0% 4.3% 4.3% 4.5%<br />
Source: Company data, <strong>Al</strong> <strong>Rajhi</strong> <strong>Capital</strong><br />
Expectations for Q4 2012<br />
Marginal improvement<br />
We expect revenues to reach<br />
SAR4.3bn by the end of this<br />
year<br />
<strong>Al</strong>othaim is likely to report revenue of around SAR1.1bn for Q4 2012, indicating a 12.9% y-o-y<br />
growth, driven by higher same-store-sales and lease income. As a result, the revenue for 2012<br />
will stand at SAR4.3bn, reflecting an increase of 5.7% y-o-y. In Q4, we expect the company to<br />
report a double-digit y-o-y growth (19.2%) in EBITDA to reach SAR68.7mn. For Q4 and fullyear,<br />
the company’s EBITDA margin is estimated to be 6.3% and 5.4% respectively. We<br />
expect the Q4 net profit to reach SAR41mn, indicating an increase of 12.4% y-o-y. For 2012,<br />
<strong>Al</strong>othaim’s bottom-line is expected to grow by around 1.5% y-o-y, reaching SAR152.3mn. The<br />
slow growth in the company’s net profit for 2012 is primarily due to the lack of new store<br />
openings in 2012 and high labor costs.<br />
Figure35 <strong>Al</strong>othaim : Q4 & FY2012 results estimates<br />
(SAR) mn 2011Q4A 2012Q4E YOY % chg. FY2011A FY2012E YOY % chg.<br />
Revenues 963 1,087.1 12.9% 4,090.9 4,325.9 5.7%<br />
EBITDA 58 68.7 19.2% 232.9 233.6 0.3%<br />
EBITDA margin (%) 6.0% 6.3% 5.7% 5.4%<br />
Operating profit 38 43.5 14.0% 157.6 146.1 -7.3%<br />
Operating profit margin (%) 4.0% 4.0% 3.9% 3.4%<br />
Net Income 36 41 12.4% 150.1 152.3 1.5%<br />
Source: Company data, <strong>Al</strong> <strong>Rajhi</strong> <strong>Capital</strong><br />
Disclosures Please refer to the important disclosures at the back of this report. 28
Abdullah <strong>Al</strong> Othaim Markets<br />
<strong>Retail</strong><br />
05 January 2013<br />
We expect revenues to reach<br />
SAR4.3bn by the end of this<br />
year<br />
Income Statement (SARmn) 12/10A 12/11A 12/12A 12/13E 12/14E<br />
Revenue 3,521 4,091 4,326 4,592 5,090<br />
Cost of Goods Sold (3,242) (3,768) (4,005) (4,226) (4,683)<br />
Gross Profit 278 323 321 366 407<br />
Government Charges<br />
S.G. & A. Costs (138) (166) (175) (192) (214)<br />
Operating EBIT 141 158 146 175 193<br />
Cash Operating Costs (3,330) (3,858) (4,092) (4,298) (4,766)<br />
EBITDA 190 233 234 294 325<br />
Depreciation and Amortisation (50) (75) (88) (119) (131)<br />
Operating Profit 141 158 146 175 193<br />
Net financing income/(costs) 13 0 8 (1) 5<br />
Forex and Related Gains - - - - -<br />
Provisions - - - - -<br />
Other Income 13 (4) 2 2 2<br />
Other Expenses -<br />
Net Profit Before Taxes 166 154 156 176 201<br />
Taxes (4) (4) (4) (4) (5)<br />
Minority Interests - - - - -<br />
Net profit available to shareholders 162 150 152 171 196<br />
Dividends (68) - (79) (79) (82)<br />
Transfer to <strong>Capital</strong> Reserve<br />
12/10A 12/11A 12/12A 12/13E 12/14E<br />
Adjusted Shares Out (mn) 22.50 22.50 22.50 22.50 22.50<br />
CFPS (SAR) 9.40 10.02 10.66 12.90 14.52<br />
EPS (SAR) 7.20 6.67 6.77 7.61 8.69<br />
DPS (SAR) 3.000 0.000 3.500 3.500 3.649<br />
Growth 12/10A 12/11A 12/12A 12/13E 12/14E<br />
Revenue Growth 11.6% 16.2% 5.7% 6.2% 10.9%<br />
Gross Profit Growth 32.2% 16.1% -0.8% 14.2% 11.2%<br />
EBITDA Growth 42.7% 22.4% 0.3% 25.7% 10.6%<br />
Operating Profit Growth 57.7% 12.1% -7.3% 19.5% 10.8%<br />
Net Profit Growth 108.9% -7.3% 1.5% 12.4% 14.2%<br />
EPS Growth 108.9% -7.3% 1.5% 12.4% 14.2%<br />
Margins 12/10A 12/11A 12/12A 12/13E 12/14E<br />
Gross profit margin 7.9% 7.9% 7.4% 8.0% 8.0%<br />
EBITDA margin 5.4% 5.7% 5.4% 6.4% 6.4%<br />
Operating Margin 4.0% 3.9% 3.4% 3.8% 3.8%<br />
Pretax profit margin 4.7% 3.8% 3.6% 3.8% 3.9%<br />
Net profit margin 4.6% 3.7% 3.5% 3.7% 3.8%<br />
Other Ratios 12/10A 12/11A 12/12A 12/13E 12/14E<br />
ROCE 22.4% 22.6% 16.5% 17.9% 16.3%<br />
ROIC 29.0% 23.7% 20.4% 21.7% 22.4%<br />
ROE 40.9% 30.6% 25.1% 23.5% 23.5%<br />
Effective Tax Rate 2.5% 2.3% 2.4% 2.5% 2.5%<br />
Capex/Sales 7.9% 5.1% 3.3% 4.6% 4.5%<br />
Dividend Payout Ratio 41.7% 0.0% 51.7% 46.0% 42.0%<br />
Valuation Measures 12/10A 12/11A 12/12A 12/13E 12/14E<br />
P/E (x) 11.3 12.2 12.0 10.7 9.4<br />
P/CF (x) 8.6 8.1 7.6 6.3 5.6<br />
P/B (x) 4.1 3.4 2.7 2.4 2.1<br />
EV/Sales (x) 0.5 0.4 0.4 0.4 0.3<br />
EV/EBITDA (x) 9.0 7.3 7.1 5.7 5.1<br />
EV/EBIT (x) 12.1 10.8 11.3 9.5 8.6<br />
EV/IC (x) 2.6 2.4 2.1 2.0 1.8<br />
Dividend Yield 3.7% 0.0% 4.3% 4.3% 4.5%<br />
Source: Company data, <strong>Al</strong> <strong>Rajhi</strong> <strong>Capital</strong><br />
Disclosures Please refer to the important disclosures at the back of this report. 29
Abdullah <strong>Al</strong> Othaim Markets<br />
<strong>Retail</strong><br />
05 January 2013<br />
Balance Sheet (SARmn) 12/10A 12/11A 12/12A 12/13E 12/14E<br />
Cash and Cash Equivalents 45 44 121 156 306<br />
Current Receivables - - - - -<br />
Inventories 283 311 348 380 417<br />
Other current assets 82 97 90 90 90<br />
Total Current Assets 410 452 559 626 814<br />
Fixed Assets 948 1,083 1,137 1,229 1,327<br />
Investments 105 119 168 168 168<br />
Goodwill 15 13 12 12 12<br />
Other Intangible Assets - - - - -<br />
Total Other Assets - - - - -<br />
Total Non-current Assets 1,067 1,215 1,318 1,409 1,507<br />
Total Assets 1,478 1,667 1,877 2,036 2,321<br />
Short Term Debt 172 165 191 191 191<br />
Accounts Payable 552 686 652 718 789<br />
Accrued Expenses - - - - -<br />
Dividends Payable - - - - -<br />
Other Current Liabilities 98 83 111 111 111<br />
Total Current Liabilities 821 934 954 1,020 1,091<br />
Long-Term Debt 179 166 200 200 300<br />
Other LT Payables - - - - -<br />
Provisions 29 35 39 39 39<br />
Total Non-current Liabilities 208 202 239 239 339<br />
Minority interests - - - - -<br />
Paid-up share capital 225 225 225 225 225<br />
Total Reserves 224 306 458 551 665<br />
Total Shareholders' Equity 449 531 683 776 890<br />
Total Equity 449 531 683 776 890<br />
Total Liabilities & Shareholders' Equity 1,478 1,667 1,877 2,036 2,321<br />
We expect net debt to gradually<br />
decline over the forecast period<br />
Ratios 12/10A 12/11A 12/12A 12/13E 12/14E<br />
Net Debt (SARmn) 306 287 270 236 185<br />
Net Debt/EBITDA (x) 1.61 1.23 1.16 0.80 0.57<br />
Net Debt to Equity 68.1% 54.1% 39.5% 30.4% 20.8%<br />
EBITDA Interest Cover (x) (14.8) (1,670.3) (27.9) 507.9 (59.5)<br />
BVPS (SAR) 19.93 23.61 30.38 34.49 39.57<br />
Cashflow Statement (SARmn) 12/10A 12/11A 12/12A 12/13E 12/14E<br />
Net Income before Tax & Minority Interest 166 154 156 176 201<br />
Depreciation & Amortisation 50 75 88 119 131<br />
Decrease in Working <strong>Capital</strong> 55 73 (39) 34 34<br />
Other Operating Cashflow (7) (7) (14) (4) (5)<br />
Cashflow from Operations 263 295 190 324 360<br />
<strong>Capital</strong> Expenditure (277) (209) (143) (210) (229)<br />
New Investments - (1) (43) - -<br />
Others (7) - 13 - -<br />
Cashflow from investing activities (283) (209) (173) (210) (229)<br />
Net Operating Cashflow (20) 86 17 113 131<br />
Dividends paid to ordinary shareholders (56) (68) - (79) (81)<br />
Proceeds from issue of shares - - - - -<br />
Effects of Exchange Rates on Cash - - - - -<br />
Other Financing Cashflow - - - - -<br />
Cashflow from financing activities (42) (87) 60 (79) 19<br />
Total cash generated (62) (2) 78 35 150<br />
Cash at beginning of period 107 45 44 121 156<br />
Implied cash at end of year 45 44 121 156 306<br />
Ratios 12/10A 12/11A 12/12A 12/13E 12/14E<br />
Capex/Sales 7.9% 5.1% 3.3% 4.6% 4.5%<br />
Source: Company data, <strong>Al</strong> <strong>Rajhi</strong> <strong>Capital</strong><br />
Disclosures Please refer to the important disclosures at the back of this report. 30
RSI10<br />
Vol th<br />
Jarir Marketing Company<br />
<strong>Retail</strong> –Industrial<br />
JARIR AB: Saudi Arabia<br />
05 January 2013<br />
US$2.5bn 100% US$1.13mn<br />
Market cap Free float Avg. daily volume<br />
Target price 168.60 6.2% over current<br />
Consensus price 157.1 -0.4 below current<br />
Current price 158.75 as at 02/01/2013<br />
Research Department<br />
Majed <strong>Al</strong> Solaim,<br />
+966 1211 9471, alsolaimm@alrajhi-capital.com<br />
Neutral<br />
Underweight Neutral Overweight<br />
Key themes<br />
Driven by rising population, improving education, and<br />
changing lifestyle, we expect the retail sector in Saudi<br />
Arabia to continue growing. Jarir has a very strong<br />
position in books, office & school supplies, and<br />
electronics markets. Jarir should continue to grow by<br />
opening new stores and benefiting from new<br />
electronics segment growth.<br />
Implications<br />
Jarir is one of our preferred stocks in the retail sector.<br />
It has a unique business model with strong position in<br />
electronics and school supplies markets. However, its<br />
share price has performed well and, in our view, most<br />
of its positives have been priced in.<br />
Performance<br />
Earnings<br />
Period End (SAR) 12/11A 12/12E 12/13E 12/14E<br />
Revenue (mn) 4,147 4,681 5,383 6,029<br />
Revenue Growth 37.6% 12.9% 15.0% 12.0%<br />
EBITDA (mn) 527 610 644 736<br />
EBITDA Growth 26.9% 15.7% 5.6% 14.3%<br />
EPS 10.26 9.90 10.34 11.54<br />
EPS Growth 2.4% -3.5% 4.5% 11.6%<br />
Source: Company data, <strong>Al</strong> <strong>Rajhi</strong> <strong>Capital</strong><br />
Valuation<br />
18<br />
16<br />
14<br />
12<br />
10<br />
8<br />
6<br />
4<br />
2<br />
170<br />
160<br />
150<br />
140<br />
130<br />
70<br />
30<br />
600 -10<br />
400<br />
200<br />
Price Close<br />
P/E (x)<br />
MAV10<br />
12/11 04/12 07/12 10/12<br />
Source: Bloomberg<br />
0<br />
01/09 01/10 01/11 01/12<br />
Source: Company data, <strong>Al</strong> <strong>Rajhi</strong> <strong>Capital</strong><br />
114<br />
110<br />
107<br />
103<br />
99<br />
95<br />
92<br />
88<br />
84<br />
Jarir<br />
Limited upside potential<br />
Despite a slight decline in Q3 revenue (1.6% y-o-y), Jarir reported a top-line<br />
and bottom-line growth of 10.5% and 11.3% y-o-y respectively for the nine<br />
months ended September 2012. According to our estimates, same-store sales<br />
growth was low due to pressure in electronic margins and a delay in the<br />
launch of iPhone 5 this year, especially for Q3. Jarir was able to maintain gross<br />
margin levels of 15% for the first nine months of 2012, mainly due to the<br />
growth of non-electronic segment. We expect the company to report a sales<br />
growth of 19.9% y-o-y in Q4 driven by sales of tablets, iPhone 5 (and other<br />
smart phones) and sale of non-electronic items. Further, Jarir plans to open<br />
more than four stores every year. Given the 9M results, we have revised our<br />
forecasts and set a new target price of SAR168.6. However, as the share price<br />
currently offers an upside potential of only 6.2%, we remain Neutral.<br />
Still growing overall: Jarir reported y-o-y sales growth of 10.5% in the first 9<br />
months of 2012. We believe this sales growth was driven by all segments<br />
(especially school supplies and books), except smart phones. Jarir has only 10%<br />
market share in the smartphone market, which indicates that there is still<br />
potential for further growth. Additionally, the tablet market is developingrapidly<br />
and hence offers much more room for growth.<br />
Some concerns in margins: The slow growth in smart phones and tablet sales<br />
is affecting Jarir’s gross margin, but sales of non-electronic items such as school<br />
supplies and books, which deliver high profit margins, has enabled the company<br />
to maintain 15% gross margin for the first nine months of 2012. However, it’s<br />
worth noting that Jarir has been able to slightly reduce its SGA expenses as a<br />
proportion of sales. We expect the margin pressure to continue, but not in Q4<br />
considering the robust seasonal sales of school supplies.<br />
iPhone 5 likely to support same-store sales growth: Jarir continued to<br />
expand organically, adding two stores in Riyadh and Yanbu to take the store<br />
count to 32. The management believes the increase in the number of stores is<br />
one of the reasons for its bottom-line growth. The launch of the new iPhone is<br />
likely to support smartphone sales in Q4 and H1 2013. Further, tablets have<br />
created a new sub-market and the launch of new brands is expanding this<br />
market. Thus, we believe Jarir will report double-digit same-store sales growth<br />
for at least another 6 months.<br />
Generous dividends: Jarir distributed cash dividends of SAR5.9 per share for<br />
the first nine months of 2012. We expect a dividend of SAR1.8 for Q4, resulting<br />
in a full year dividend of SAR7.7, which implies a dividend yield of 5%.<br />
Conclusion: We have raised our target price to SAR168.6, given that we have<br />
marginally increased our earnings forecasts. Our new target price implies an<br />
upside potential of 6.2%. Therefore, we maintain our Neutral rating. Jarir<br />
currently trades at a 2013 EV/EBITDA multiple of 14.7x and a PE ratio of 15.4x.<br />
Disclosures Please refer to the important disclosures at the back of this report.<br />
Powered by Enhanced Datasystems’ EFA Platform 31
Jarir Marketing Company<br />
<strong>Retail</strong> –Industrial<br />
05 January 2013<br />
Corporate summary Share information Valuation<br />
Jarir Marketing Company is one of the<br />
leading retail companies in the GCC<br />
with a market capitalization of US$2.5.<br />
The company sells books, school<br />
supplies, office supplies, laptops,<br />
software, and other electronic products<br />
at both wholesale and retail levels. The<br />
retail sector of the company contributes<br />
to approximately 90% of the revenues.<br />
The company owns 32 branches, 27<br />
are in Saudi while the remaining four<br />
are in the GCC region.<br />
Market cap (SAR/US$) 9.52bn / 2.540bn<br />
52-week range 136.0 - 165.0<br />
Daily avg volume (US$)<br />
1.028mn<br />
Shares outstanding<br />
60.00mn<br />
Free float (est) 87%<br />
Performance: 1M 3M 12M<br />
Absolute 3.6% 1.8% 11.4%<br />
Relative to index 0.1% 1.2% 2.9%<br />
Major Shareholder:<br />
Jarir Investment company 12.0%<br />
Mohammed Abdulrahman <strong>Al</strong>aqeel 9.0%<br />
Source: Bloomberg, <strong>Al</strong> <strong>Rajhi</strong> <strong>Capital</strong><br />
Expectations for Q4 2012<br />
Period End 12/11A 12/12A 12/13E 12/14E<br />
Revenue (SARmn) 4,147 4,681 5,383 6,029<br />
EBITDA (SARmn) 527 610 644 736<br />
Net Profit (SARmn) 513 594 620 692<br />
EPS (SAR) 10.26 9.90 10.34 11.54<br />
DPS (SAR) 7.00 7.70 8.80 8.65<br />
EPS Growth 2.4% -3.5% 4.5% 11.6%<br />
EV/EBITDA (x) 14.8 15.5 14.7 13.2<br />
P/E (x) 15.5 16.0 15.4 13.8<br />
P/B (x) 10.5 9.1 8.2 7.1<br />
Dividend Yield 4.4% 4.9% 5.5% 5.4%<br />
Source: Company data, <strong>Al</strong> <strong>Rajhi</strong> <strong>Capital</strong><br />
Continuous success story<br />
Figure 36 Jarir : Q4 & FY201 results estimates<br />
(SAR) mn 2011Q4A 2012Q4E YOY % chg. FY2011 A FY2012E YOY % chg.<br />
Revenues 1,025 1,229 19.9% 4,147 4,681 12.9%<br />
EBITDA 129 167 527 610 15.7%<br />
EBITDA margin (%) 12.6% 13.6% 12.7% 13.0%<br />
Operating profit 123 160 29.8% 507 587 15.8%<br />
Operating profit margin (%) 12.0% 13.0% 12.2% 12.5%<br />
Net Income 125 162 29.7% 513 594 15.8%<br />
Source: Company data, <strong>Al</strong> <strong>Rajhi</strong> <strong>Capital</strong><br />
Disclosures Please refer to the important disclosures at the back of this report. 32
Jarir Marketing Company<br />
<strong>Retail</strong> –Industrial<br />
05 January 2013<br />
Income Statement (SARmn) 12/10A 12/11A 12/12A 12/13E 12/14E<br />
Revenue 3,015 4,147 4,681 5,383 6,029<br />
Cost of Goods Sold (2,513) (3,514) (3,957) (4,603) (5,154)<br />
Gross Profit 502 634 724 780 874<br />
Government Charges<br />
S.G. & A. Costs (106) (127) (137) (167) (187)<br />
Operating EBIT 396 507 587 613 687<br />
Cash Operating Costs (2,599) (3,620) (4,070) (4,739) (5,292)<br />
EBITDA 415 527 610 644 736<br />
Depreciation and Amortisation (20) (20) (23) (31) (49)<br />
Operating Profit 396 507 587 613 687<br />
Net financing income/(costs) (11) (7) (6) (7) (8)<br />
Forex and Related Gains - - - - -<br />
Provisions - - - - -<br />
Other Income 29 31 31 31 31<br />
Other Expenses<br />
Net Profit Before Taxes 413 531 612 636 710<br />
Taxes (12) (18) (18) (16) (18)<br />
Minority Interests - - - - -<br />
Net profit available to shareholders 401 513 594 620 692<br />
Dividends (314) (420) (462) (528) (519)<br />
Transfer to <strong>Capital</strong> Reserve<br />
12/10A 12/11A 12/12A 12/13E 12/14E<br />
Adjusted Shares Out (mn) 40.00 60.00 60.00 60.00 60.00<br />
CFPS (SAR) 10.51 10.67 10.29 10.86 12.35<br />
EPS (SAR) 10.02 10.26 9.90 10.34 11.54<br />
DPS (SAR) 7.85 7.00 7.70 8.80 8.65<br />
Growth 12/10A 12/11A 12/12A 12/13E 12/14E<br />
Revenue Growth 18.0% 37.6% 12.9% 15.0% 12.0%<br />
Gross Profit Growth 3.1% 26.4% 14.2% 7.8% 12.1%<br />
EBITDA Growth 3.0% 26.9% 15.7% 5.6% 14.3%<br />
Operating Profit Growth 2.9% 28.1% 15.8% 4.5% 12.1%<br />
Net Profit Growth 7.2% 28.0% 15.8% 4.5% 11.6%<br />
EPS Growth 7.2% 2.4% -3.5% 4.5% 11.6%<br />
We expect gross margin to<br />
remain above15% in 2012<br />
Margins 12/10A 12/11A 12/12A 12/13E 12/14E<br />
Gross profit margin 16.6% 15.3% 15.5% 14.5% 14.5%<br />
EBITDA margin 13.8% 12.7% 13.0% 12.0% 12.2%<br />
Operating Margin 13.1% 12.2% 12.5% 11.4% 11.4%<br />
Pretax profit margin 13.7% 12.8% 13.1% 11.8% 11.8%<br />
Net profit margin 13.3% 12.4% 12.7% 11.5% 11.5%<br />
Other Ratios 12/10A 12/11A 12/12A 12/13E 12/14E<br />
ROCE 44.1% 49.9% 46.9% 43.8% 38.8%<br />
ROIC 48.9% 57.0% 56.0% 50.4% 50.9%<br />
ROE 52.7% 60.2% 60.7% 56.0% 55.3%<br />
Effective Tax Rate 3.0% 3.3% 2.9% 2.5% 2.5%<br />
Capex/Sales 1.3% 5.0% 2.6% 3.2% 3.6%<br />
Dividend Payout Ratio 78.3% 81.9% 77.8% 85.1% 75.0%<br />
Valuation Measures 12/10A 12/11A 12/12A 12/13E 12/14E<br />
P/E (x) 15.8 15.5 16.0 15.4 13.8<br />
P/CF (x) 15.1 14.9 15.4 14.6 12.9<br />
P/B (x) 8.0 10.5 9.1 8.2 7.1<br />
EV/Sales (x) 2.1 1.9 2.0 1.8 1.6<br />
EV/EBITDA (x) 15.0 14.8 15.5 14.7 13.2<br />
EV/EBIT (x) 15.7 15.4 16.1 15.5 14.2<br />
EV/IC (x) 7.2 9.2 8.0 7.2 5.7<br />
Dividend Yield 4.9% 4.4% 4.9% 5.5% 5.4%<br />
Source: Company data, <strong>Al</strong> <strong>Rajhi</strong> <strong>Capital</strong><br />
Disclosures Please refer to the important disclosures at the back of this report. 33
Jarir Marketing Company<br />
<strong>Retail</strong> –Industrial<br />
05 January 2013<br />
Balance Sheet (SARmn) 12/10A 12/11A 12/12A 12/13E 12/14E<br />
Cash and Cash Equivalents 52 60 63 83 50<br />
Current Receivables 212 243 260 312 452<br />
Inventories 543 601 688 794 922<br />
Other current assets 36 39 37 37 37<br />
Total Current Assets 843 943 1,049 1,226 1,462<br />
Fixed Assets 555 742 841 982 1,150<br />
Investments 36 35 34 34 34<br />
Goodwill - - - - -<br />
Other Intangible Assets - - - - -<br />
Total Other Assets - - - - -<br />
Total Non-current Assets 591 777 875 1,016 1,184<br />
Total Assets 1,433 1,720 1,924 2,242 2,646<br />
Short Term Debt 50 96 33 33 33<br />
Accounts Payable 351 464 482 624 651<br />
Accrued Expenses 69 94 93 119 127<br />
Dividends Payable - - - - -<br />
Other Current Liabilities 31 10 11 11 11<br />
Total Current Liabilities 501 664 619 787 822<br />
Long-Term Debt 100 108 200 234 432<br />
Other LT Payables - - - - -<br />
Provisions 35 41 55 55 55<br />
Total Non-current Liabilities 135 149 255 289 487<br />
Minority interests - - - - -<br />
Paid-up share capital 400 600 600 600 600<br />
Total Reserves 398 307 450 567 738<br />
Total Shareholders' Equity 798 907 1,050 1,167 1,338<br />
Total Equity 798 907 1,050 1,167 1,338<br />
Total Liabilities & Shareholders' Equity 1,433 1,720 1,924 2,242 2,646<br />
Ratios 12/10A 12/11A 12/12A 12/13E 12/14E<br />
Net Debt (SARmn) 98 145 171 184 415<br />
Net Debt/EBITDA (x) 0.24 0.27 0.28 0.29 0.56<br />
Net Debt to Equity 12.3% 16.0% 16.2% 15.8% 31.0%<br />
EBITDA Interest Cover (x) 36.4 78.9 109.2 88.8 91.8<br />
BVPS (SAR) 19.94 15.11 17.51 19.45 22.29<br />
Cashflow Statement (SARmn) 12/10A 12/11A 12/12A 12/13E 12/14E<br />
Net Income before Tax & Minority Interest 413 531 612 636 710<br />
Depreciation & Amortisation 20 20 23 31 49<br />
Decrease in Working <strong>Capital</strong> (45) 24 (84) 11 (234)<br />
Other Operating Cashflow (23) 19 (34) (16) (18)<br />
Cashflow from Operations 364 594 517 663 507<br />
<strong>Capital</strong> Expenditure (39) (207) (122) (172) (217)<br />
New Investments - - - - -<br />
Others 0 0 - - -<br />
Cashflow from investing activities (39) (207) (122) (172) (217)<br />
Net Operating Cashflow 326 386 395 490 290<br />
Dividends paid to ordinary shareholders (326) (404) (450) (504) (521)<br />
Proceeds from issue of shares - - - - -<br />
Effects of Exchange Rates on Cash - - - - -<br />
Other Financing Cashflow - - - - -<br />
Cashflow from financing activities (313) (379) (392) (470) (323)<br />
Total cash generated 13 7 3 20 (33)<br />
Cash at beginning of period 40 52 60 63 83<br />
Implied cash at end of year 52 60 63 83 50<br />
Ratios 12/10A 12/11A 12/12A 12/13E 12/14E<br />
Capex/Sales 1.3% 5.0% 2.6% 3.2% 3.6%<br />
Source: Company data, <strong>Al</strong> <strong>Rajhi</strong> <strong>Capital</strong><br />
Disclosures Please refer to the important disclosures at the back of this report. 34
Jarir Marketing Company<br />
<strong>Retail</strong> –Industrial<br />
05 January 2013<br />
Disclaimer and additional disclosures for Equity Research<br />
Disclaimer<br />
This research document has been prepared by <strong>Al</strong> <strong>Rajhi</strong> <strong>Capital</strong> Company (“<strong>Al</strong> <strong>Rajhi</strong> <strong>Capital</strong>”) of Riyadh, Saudi Arabia. It has been prepared<br />
for the general use of <strong>Al</strong> <strong>Rajhi</strong> <strong>Capital</strong>’s clients and may not be redistributed, retransmitted or disclosed, in whole or in part, or in any form or<br />
manner, without the express written consent of <strong>Al</strong> <strong>Rajhi</strong> <strong>Capital</strong>. Receipt and review of this research document constitute your agreement not<br />
to redistribute, retransmit, or disclose to others the contents, opinions, conclusion, or information contained in this document prior to public<br />
disclosure of such information by <strong>Al</strong> <strong>Rajhi</strong> <strong>Capital</strong>. The information contained was obtained from various public sources believed to be reliable<br />
but we do not guarantee its accuracy. <strong>Al</strong> <strong>Rajhi</strong> <strong>Capital</strong> makes no representations or warranties (express or implied) regarding the data and<br />
information provided and <strong>Al</strong> <strong>Rajhi</strong> <strong>Capital</strong> does not represent that the information content of this document is complete, or free from any error,<br />
not misleading, or fit for any particular purpose. This research document provides general information only. Neither the information nor any<br />
opinion expressed constitutes an offer or an invitation to make an offer, to buy or sell any securities or other investment products related to<br />
such securities or investments. It is not intended to provide personal investment advice and it does not take into account the specific<br />
investment objectives, financial situation and the particular needs of any specific person who may receive this document.<br />
Investors should seek financial, legal or tax advice regarding the appropriateness of investing in any securities, other investment or<br />
investment strategies discussed or recommended in this document and should understand that statements regarding future prospects may<br />
not be realized. Investors should note that income from such securities or other investments, if any, may fluctuate and that the price or value<br />
of such securities and investments may rise or fall. Fluctuations in exchange rates could have adverse effects on the value of or price of, or<br />
income derived from, certain investments. Accordingly, investors may receive back less than originally invested. <strong>Al</strong> <strong>Rajhi</strong> <strong>Capital</strong> or its officers<br />
or one or more of its affiliates (including research analysts) may have a financial interest in securities of the issuer(s) or related investments,<br />
including long or short positions in securities, warrants, futures, options, derivatives, or other financial instruments. <strong>Al</strong> <strong>Rajhi</strong> <strong>Capital</strong> or its<br />
affiliates may from time to time perform investment banking or other services for, solicit investment banking or other business from, any<br />
company mentioned in this research document. <strong>Al</strong> <strong>Rajhi</strong> <strong>Capital</strong>, together with its affiliates and employees, shall not be liable for any direct,<br />
indirect or consequential loss or damages that may arise, directly or indirectly, from any use of the information contained in this research<br />
document.<br />
This research document and any recommendations contained are subject to change without prior notice. <strong>Al</strong> <strong>Rajhi</strong> <strong>Capital</strong> assumes no<br />
responsibility to update the information in this research document. Neither the whole nor any part of this research document may be altered,<br />
duplicated, transmitted or distributed in any form or by any means. This research document is not directed to, or intended for distribution to or<br />
use by, any person or entity who is a citizen or resident of or located in any locality, state, country or other jurisdiction where such distribution,<br />
publication, availability or use would be contrary to law or which would subject <strong>Al</strong> <strong>Rajhi</strong> <strong>Capital</strong> or any of its affiliates to any registration or<br />
licensing requirement within such jurisdiction.<br />
Additional disclosures<br />
1. Explanation of <strong>Al</strong> <strong>Rajhi</strong> <strong>Capital</strong>’s rating system<br />
<strong>Al</strong> <strong>Rajhi</strong> <strong>Capital</strong> uses a three-tier rating system based on absolute upside or downside potential for all stocks under its coverage<br />
except financial stocks and those few other companies not compliant with Islamic Shariah law:<br />
"Overweight": Our target price is more than 15% above the current share price, and we expect the share price to reach the target on a<br />
6-9 month time horizon.<br />
"Neutral": We expect the share price to settle at a level between 5% below the current share price and 15% above the current share<br />
price on a 6-9 month time horizon.<br />
"Underweight": Our target price is more than 5% below the current share price, and we expect the share price to reach the target on a<br />
6-9 month time horizon.<br />
2. Definitions<br />
"Time horizon": Our analysts make recommendations on a 6-9 month time horizon. In other words, they expect a given stock to reach their<br />
target price within that time.<br />
"Fair value": We estimate fair value per share for every stock we cover. This is normally based on widely accepted methods appropriate to<br />
the stock or sector under consideration, e.g. DCF (discounted cash flow) or SoTP (sum of the parts) analysis.<br />
"Target price": This may be identical to estimated fair value per share, but is not necessarily the same. There may be very good reasons<br />
why a share price is unlikely to reach fair value within our time horizon. In such a case we set a target price which differs from estimated fair<br />
value per share, and explain our reasons for doing so.<br />
Please note that the achievement of any price target may be impeded by general market and economic trends and other external factors, or if<br />
a company’s profits or operating performance exceed or fall short of our expectations.<br />
Contact us<br />
Research department<br />
Tel : +966 1 2119471<br />
research@alrajhi-capital.com<br />
<strong>Al</strong> <strong>Rajhi</strong> <strong>Capital</strong><br />
Research Department<br />
Head Office, King Fahad Road<br />
P.O. Box 5561<br />
Riyadh 11432<br />
Kingdom of Saudi Arabia<br />
Email: research@alrajhi-capital.com<br />
<strong>Al</strong> <strong>Rajhi</strong> <strong>Capital</strong> is licensed by the Saudi Arabian <strong>Capital</strong> Market Authority, License No. 07068/37.<br />
Disclosures Please refer to the important disclosures at the back of this report. 35