Savola Group Close to fair value - Al Rajhi Capital
Savola Group Close to fair value - Al Rajhi Capital
Savola Group Close to fair value - Al Rajhi Capital

You also want an ePaper? Increase the reach of your titles
YUMPU automatically turns print PDFs into web optimized ePapers that Google loves.
RSI10<br />
Vol mn<br />
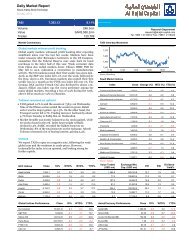
<strong>Savola</strong> <strong>Group</strong> Company<br />
Food-Diversified –Industrial<br />
SAVOLA AB: Saudi Arabia<br />
28 March 2012<br />
US$4.600bn 60.1% US$4.960mn<br />
Market cap Free float Avg. daily volume<br />
Target price 35.46 2.8% over current<br />
Consensus price 38.00 10.2% over current<br />
Current price 34.50 as at 27/3/2012<br />
Underweight Neutral Overweight<br />
Neutral<br />
Key themes<br />
We expect the food sec<strong>to</strong>r in Saudi Arabia <strong>to</strong><br />
continue growing on the back of ever-increasing<br />
population and improving education. A surge in<br />
shopping in supermarkets and hypermarkets should<br />
support food sales and benefit <strong>Savola</strong> with its<br />
presence in retail and food space.<br />
Implications<br />
<strong>Savola</strong> is one of our favourite companies in the food<br />
sec<strong>to</strong>r. It has a leading market share in nearly all the<br />
regions it operates in. However, our target price<br />
offers limited upside as <strong>Savola</strong> share price has<br />
recently rallied. In addition, the company has<br />
operations in unstable markets such as Iran and<br />
Egypt, which might affect its performance.<br />
Therefore, we downgrade our rating on the company<br />
<strong>to</strong> Neutral.<br />
Performance<br />
37<br />
32<br />
27<br />
22<br />
70<br />
30<br />
-10 4<br />
3<br />
2<br />
1<br />
Earnings<br />
Period End (SAR) 12/11A 12/12E 12/13E 12/14E<br />
Revenue (mn) 25,196 27,833 30,726 33,587<br />
Revenue Growth 20.1% 10.5% 10.4% 9.3%<br />
EBITDA (mn) 1,822 2,076 2,344 2,583<br />
EBITDA Growth 7.2% 14.0% 12.9% 10.2%<br />
EPS 2.40 2.85 2.92 3.36<br />
EPS Growth 35.6% 18.6% 2.5% 15.1%<br />
Source: Company data, <strong>Al</strong> <strong>Rajhi</strong> <strong>Capital</strong><br />
Valuation<br />
40<br />
35<br />
30<br />
25<br />
20<br />
15<br />
10<br />
5<br />
0<br />
Price <strong>Close</strong> MAV10 MAV50 Relative <strong>to</strong> SASEIDX (RHS)<br />
03/11 06/11 10/11 01/12<br />
Source: Bloomberg<br />
P/E (x)<br />
01/09 01/10 01/11 01/12<br />
Source: Company data, <strong>Al</strong> <strong>Rajhi</strong> <strong>Capital</strong><br />
120<br />
116<br />
113<br />
109<br />
105<br />
101<br />
98<br />
94<br />
90<br />
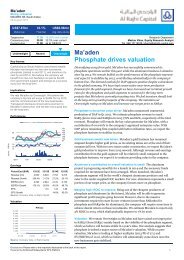
<strong>Savola</strong> <strong>Group</strong><br />
<strong>Close</strong> <strong>to</strong> <strong>fair</strong> <strong>value</strong><br />
Research Department<br />
Moath <strong>Al</strong> Shaikh, Majed <strong>Al</strong>-Solaim<br />
Tel 966 1211 9426, alshaikhma@alrajhi-capital.com<br />
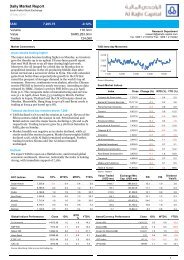
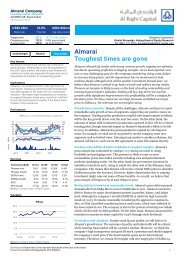
<strong>Savola</strong> posted outstanding results for 2011. Revenues were up by 20% y-o-y<br />
mainly on the back of a strong performance at its edible oil division. Though<br />
margins of edible oil and plastics divisions slipped, they were offset by better<br />
margins at sugar and retail segments. Operating profits, as a result, grew by<br />
43% y-o-y while net profits rose by 36% y-o-y (including capital gains of<br />
SAR135.5mn). We are concerned about the stability of operations and currency<br />
impact from Iran and Egypt; therefore, we have raised our WACC calculations<br />
in an attempt <strong>to</strong> reflect our view that inves<strong>to</strong>rs across the MENA region may<br />
demand a higher risk premium. We have also changed our valuation<br />
methodology and accordingly revised our target price <strong>to</strong> SAR35.4. We<br />
downgrade our rating <strong>to</strong> Neutral as our new target price offers limited upside.<br />
Food division delivers decent performance: Last year, the aggregate edible<br />
oil business, in both emerging and mature markets, delivered a remarkable <strong>to</strong>p<br />
line growth of 33%. However, margins <strong>to</strong>ok a beating last year as the gross<br />
margin declined by 300 bps reaching 14%. Saudi’s margins <strong>to</strong>ok a major hit as<br />
the company fixed the prices of its finished products in an attempt <strong>to</strong> stabilize<br />
them. This coupled with the poor performance in Iran and Egypt was the reason<br />
for the 7% y-o-y decline in operating profits in the mature markets. However, the<br />
emerging markets (mainly <strong>Al</strong>geria and Sudan) helped it offset this poor<br />
operating performance, resulting in an aggregate operating profits growth of<br />
14.5% y-o-y. On the other hand, the Sugar division clocked a respectable <strong>to</strong>p and<br />
bot<strong>to</strong>m-line growth in 2011 with revenues and profits up by 17% and 39% y-o-y<br />
respectively.<br />
Pasta, latest division in the food basket: Just after acquiring 80% of the two<br />
Egyptian pasta companies, <strong>Savola</strong> announced that it acquired the remaining<br />
20% stake. This acquisition might be termed as opportunistic, taking advantage<br />
of the weaker Egyptian pound. However, this increased the company exposure <strong>to</strong><br />
Egypt, adding <strong>to</strong> its risk profile. That said, we believe that moving one step<br />
further in the food <strong>value</strong> chain is in line with the group’s strategy <strong>to</strong> focus on<br />
core business.<br />
Retail revenues up 12%: Retail revenues rose by 12% y-o-y in 2011 with<br />
margins showing a noticeable improvement; net margin reached 2.2% as<br />
compared <strong>to</strong> 0.6% in 2010. Nevertheless, retail margins are still weak as<br />
compared <strong>to</strong> international peers. We don’t expect margins <strong>to</strong> improve<br />
significantly as the group has lined up an aggressive outlet expansion program.<br />
<strong>Savola</strong> operates in unstable markets: The year 2011 was an eventful year for<br />
the MENA region. Egypt (12% of revenues) witnessed a political unrest from<br />
which the country is yet <strong>to</strong> recover fully. Furthermore, the outlook for the<br />
political and economic situation in Iran (13% of revenues) remains negative.<br />
Valuation and summary: We like <strong>Savola</strong>’s business model, but we are<br />
concerned as the political and economic outlook in two of its key markets<br />
remains uncertain. As a result, we have raised our WACC calculation from 11.3%<br />
<strong>to</strong> 13%. We have also changed our valuation methodology and accordingly raised<br />
our target price <strong>to</strong> SAR35.4 (from SAR32.9). We downgrade our rating for<br />
<strong>Savola</strong> group <strong>to</strong> Neutral as our new target price offers limited upside potential.<br />
Disclosures Please refer <strong>to</strong> the important disclosures at the back of this report.<br />
Powered by Enhanced Datasystems’ EFA Platform 1
<strong>Savola</strong> <strong>Group</strong> Company<br />
Food-Diversified –Industrial<br />
28 March 2012<br />
Corporate summary Share information Valuation<br />
<strong>Savola</strong>, one of the leading companies<br />
in food and retail industries, is a group<br />
that holds several companies which<br />
operate in different industries. The<br />
<strong>Group</strong> operates its businesses through<br />
three Core Sec<strong>to</strong>rs; these are "<strong>Savola</strong><br />
Foods Sec<strong>to</strong>r", including Edible Oil,<br />
Sugar and Pasta, "<strong>Savola</strong> Retail<br />
Sec<strong>to</strong>r", including Retail (Panda - and<br />
Hyper Panda), and <strong>Savola</strong> Plastics<br />
Sec<strong>to</strong>r. Furthermore, <strong>Savola</strong> has a<br />
major investment in the leading dairy<br />
company in the GCC (<strong>Al</strong>marai) and in<br />
Herfy Foods Company with stakes of<br />
29.9% and 49% respectively.<br />
Edible oil was a key <strong>to</strong>p-line<br />
growth driver in 2011<br />
<strong>Savola</strong> added pasta <strong>to</strong> its<br />
product portfolio<br />
<strong>Savola</strong> expects capital gains of<br />
SAR231mn this year<br />
Market cap (SAR/US$) 17.25bn / 4.600bn<br />
52-week range 23.70 - 35.40<br />
Daily avg volume (US$)<br />
4.960mn<br />
Shares outstanding<br />
500.0mn<br />
Free float (est) 60.1%<br />
Performance: 1M 3M 12M<br />
Absolute 5.5% 21.5% 23.2%<br />
Relative <strong>to</strong> index -3.1% 0.1% 4.1%<br />
Major Shareholder:<br />
Masik Holding Company 12.0%<br />
General Organisation for Social Insurance 10.9%<br />
Source: Bloomberg, <strong>Al</strong> <strong>Rajhi</strong> <strong>Capital</strong><br />
Period End 12/11A 12/12E 12/13E 12/14E<br />
Revenue (SARmn) 25,196 27,833 30,726 33,587<br />
EBITDA (SARmn) 1,822 2,076 2,344 2,583<br />
Net Profit (SARmn) 1,202 1,426 1,461 1,682<br />
EPS (SAR) 2.40 2.85 2.92 3.36<br />
DPS (SAR) 1.30 1.30 1.30 1.35<br />
EPS Growth 35.6% 18.6% 2.5% 15.1%<br />
EV/EBITDA (x) 9.3 7.8 6.6 6.2<br />
P/E (x) 14.3 12.1 11.8 10.3<br />
P/B (x) 2.2 2.0 1.9 1.7<br />
Dividend Yield 3.8% 3.8% 3.8% 3.9%<br />
Source: Company data, <strong>Al</strong> <strong>Rajhi</strong> <strong>Capital</strong><br />
<strong>Savola</strong> <strong>Group</strong><br />
Positive outlook, concerns persist<br />
Creditable performance in 2011<br />
<strong>Savola</strong> ended 2011 with increases of 20% in revenues, 17.8% in gross profit, and 42.6% in<br />
operating profit. Excluding capital gains, net profits were up by almost 9.2% y-o-y, exceeding<br />
our as well as management’s expectations. The robust performance was mainly propelled by<br />
an exceptional performance from the edible oil division, with revenue growth of 33% y-o-y.<br />
Sugar, plastics, and retail divisions also fared well with revenues growing by 17%, 13% and<br />
12% y-o-y respectively. Margins of edible oil and plastics divisions slipped. However, they<br />
were offset by better margins at sugar and retail segments<br />
In 2011, <strong>Savola</strong> acquired two Egyptian pasta companies - <strong>Al</strong>-Farasha and <strong>Al</strong>- Malika - for a<br />
<strong>value</strong> of SAR713.5mn. Despite having limited information about both the companies, we<br />
believe that moving a step further in the food <strong>value</strong> chain is a significant development for the<br />
group and thereby diversifying its food basket.<br />
Further, <strong>Savola</strong> was able <strong>to</strong> turn its edible oil operation in <strong>Al</strong>geria in<strong>to</strong> a profitable business;<br />
the group recorded profits of SAR23.5mn versus a loss of SAR37.5 in 2010. Furthermore,<br />
<strong>Savola</strong> managed <strong>to</strong> sell lands in Riyadh and Jeddah last year, recording handsome capital<br />
gains of SAR153mn. <strong>Savola</strong> also signed a contract with Knowledge Economic City Company<br />
<strong>to</strong> sell its shares in a plot of land located in <strong>Al</strong> Madinah city. <strong>Savola</strong>, as a result, expects <strong>to</strong><br />
record capital gains of SAR231mn this year.<br />
Figure 1 <strong>Savola</strong>: 2011 vs. 2010<br />
(SAR) mn 2010 2011 %chg. Comments<br />
Revenues<br />
Edible oil 7,004 9,312 33.0% Outstanding revenue growth for the year from both mature (32%) and emerging markets (37%)<br />
Sugar 5,023 5,861 16.7% Solid performance for 2011; revenues from Saudi and Egypt rose by 15% and 20% respectively.<br />
Retail 8,183 9,182 12.2% Strong like for like growth of almost 7% in addition <strong>to</strong> opening 4 supermarkets and 3 hypermarkets during the year<br />
Plastics 884 1,002 13.3% Strong <strong>to</strong>p line performance driven by increasing prices and higher utilization rates<br />
Pasta 0 51 N/A Pasta acquisition was completed in Q4 2011<br />
Franchising 44 47 6.8% Company sold this business in 2011<br />
HQ/Elimination/Impairments -153 -259 N/M<br />
Total 20,985 25,196 20.1%<br />
Operating profits<br />
Edible oil 605 693 14.5% Despite having a decline in mature markets, emerging markets drove operating profit growth<br />
Sugar 216 327 51.4% The ability <strong>to</strong> pass higher prices in the local market helped improving the profitability of this division<br />
Retail 154 228 47.8% Solid improvements in margins as many hypermarkets and supermarkets are maturing<br />
Plastics 118 99 -16.1% Declines in operating profits as raw prices increased<br />
Pasta 0 8 N/M Pasta acquisition was completed in Q4 2011<br />
Franchising -1 7 N/M Company sold this business in 2011<br />
HQ/Elimination/Impairments -206 -98<br />
Total 886 1,263 42.6%<br />
Net income 887 1,202 35.6% Excluding capital gains, net profit were up by almost 9.25%<br />
CAPEX 478 453 -5.4% 2011 did not witness huge CAPEX compared <strong>to</strong> previous years<br />
CAPEX/Sales 2.3% 1.8% -0.5% As mentioned above<br />
Source: Company data, <strong>Al</strong> <strong>Rajhi</strong> <strong>Capital</strong><br />
Disclosures Please refer <strong>to</strong> the important disclosures at the back of this report. 2
<strong>Savola</strong> <strong>Group</strong> Company<br />
Food-Diversified –Industrial<br />
28 March 2012<br />
We are concerned about the<br />
economic outlook for Iran and<br />
Egypt this year<br />
<strong>Savola</strong> operates in unstable markets<br />
The year 2011 was an eventful year for the MENA region. Egypt - which accounts for almost<br />
12% of <strong>Savola</strong>’s revenues - witnessed a political unrest from which the country is yet <strong>to</strong><br />
recover fully. Furthermore, the outlook for the political and economic situation in Iran –<br />
another country contributing 13% <strong>to</strong> the <strong>to</strong>tal revenue- is negative. Many countries, including<br />
Europe and the US, have imposed an oil embargo on Iran. In our view, these developments<br />
will leave an impact on the economic situation in those countries.<br />
Figure 2 <strong>Savola</strong> <strong>Group</strong> geographic revenue breakdown<br />
Figure 3 <strong>Savola</strong> <strong>Group</strong> geographic net profit breakdown<br />
11.9%<br />
Title:<br />
Source:<br />
5.2%<br />
2.6%<br />
Please fill in the 8.2% <strong>value</strong>s above <strong>to</strong> have them entered in your report<br />
12.0%<br />
13.3%<br />
62.9%<br />
84.0%<br />
Saudi Iran revenues Egypt revenues Other<br />
Source: Company data, <strong>Al</strong> <strong>Rajhi</strong> <strong>Capital</strong><br />
Source: Company data, <strong>Al</strong> <strong>Rajhi</strong> <strong>Capital</strong><br />
Saudi Iran revenues Egypt revenues Other<br />
Market consensus suggests<br />
that further depreciation of<br />
Iranian Riyals and Egyptian<br />
Pounds is possible<br />
However, it is pertinent <strong>to</strong> mention that sugar and edible oil are essential products, and<br />
hence the prevailing economic situation should have a limited impact on their demand.<br />
Having said that, the problems in these countries have resulted in<strong>to</strong> a depreciation in their<br />
respective currencies against the US dollar (against the Saudi Riyal also as Riyal is pegged <strong>to</strong><br />
the dollar). Market consensus suggests the possibility of a further depreciation of their<br />
currencies. Therefore, <strong>Savola</strong>’s foreign earnings, in terms of Saudi Riyal, might be affected in<br />
the near future as further depreciation is expected.<br />
Figure 4 Iranian Riyal vs. US Dollars<br />
Figure 5 Egyptian Pounds vs. US Dollars<br />
15,000<br />
14,000<br />
13,000<br />
12,000<br />
6.1<br />
6<br />
5.9<br />
5.8<br />
5.7<br />
Title:<br />
Source:<br />
Please fill in the <strong>value</strong>s above <strong>to</strong> have them entered in your report<br />
11,000<br />
10,000<br />
5.6<br />
5.5<br />
5.4<br />
9,000<br />
Jan-10 Jul-10 Jan-11 Jul-11 Jan-12<br />
5.3<br />
Jan-10 Jul-10 Jan-11 Jul-11 Jan-12<br />
Source: Bloomberg, <strong>Al</strong> <strong>Rajhi</strong> <strong>Capital</strong><br />
IRR/USD<br />
Source: Bloomberg, <strong>Al</strong> <strong>Rajhi</strong> <strong>Capital</strong><br />
EGP/USD<br />
We have raised our WACC <strong>to</strong><br />
reflect inves<strong>to</strong>rs’ demand for<br />
risk premium<br />
In addition, we are concerned about the fund flow between Saudi Arabia and Iran. Though we<br />
are unaware whether <strong>Savola</strong> is facing problems in transferring and receiving its funds from<br />
Iran, we suspect that fund flow wouldn’t be as smooth as it is with other stable countries.<br />
Based on the above, we have raised our WACC for <strong>Savola</strong> from 11.3% previously <strong>to</strong> 13% now<br />
in a bid <strong>to</strong> reflect our view that inves<strong>to</strong>rs in the MENA region may demand a higher risk<br />
premium. We will discuss the WACC calculations in detail later in this report.<br />
Disclosures Please refer <strong>to</strong> the important disclosures at the back of this report. 3
<strong>Savola</strong> <strong>Group</strong> Company<br />
Food-Diversified –Industrial<br />
28 March 2012<br />
<strong>Savola</strong> now has pasta in its<br />
food basket<br />
<strong>Savola</strong> has also been growing<br />
organically in sugar and retail<br />
segments<br />
<strong>Savola</strong> is reducing its reliance<br />
on capital gains<br />
Expanding through organic and M&A routes<br />
In line with its recent strategy of focusing more closely on its core businesses, <strong>Savola</strong> has<br />
successfully wrapped up several acquisitions in food and retail categories. It has acquired<br />
minority stakes in Afia Egypt, New Marina Plastics Egypt, and Tate & Lyle in the sugar<br />
business. In addition <strong>to</strong> its 80% interest in Giant S<strong>to</strong>res Trading Company, <strong>Savola</strong> has<br />
completed a major retail acquisition by purchasing the assets of Saudi Geant (eleven s<strong>to</strong>res).<br />
The most recent acquisition - which <strong>to</strong>ok place in 2011 - was acquisition of <strong>Al</strong>-Malika and <strong>Al</strong>-<br />
Farasha companies. Both are Egypt-based companies and are specialized in manufacturing<br />
pasta. The aggregate capacity of both the fac<strong>to</strong>ries is 124,000 MT pa, with a market share of<br />
30%. In our view, this acquisition is an encouraging augury as it not only adds <strong>to</strong> the<br />
company’s basket, but also paves the way for further forward integration in <strong>Savola</strong>’s food<br />
division. We expect revenues from the pasta division <strong>to</strong> reach SAR199mn in 2012.<br />
<strong>Savola</strong> has also been expanding its footprint through the organic route. The company is<br />
carrying out construction work of a beet sugar refinery in <strong>Al</strong>exandria (Egypt) with a capacity<br />
of 0.18mn MT pa, which is scheduled <strong>to</strong> kick-start commercial production in Q1 2013. The<br />
group has also rolled out new Panda s<strong>to</strong>res last year (four hypermarkets and three<br />
supermarkets) and will continue opening new outlets in the coming years as part of its plan <strong>to</strong><br />
operate a <strong>to</strong>tal of 200 outlets by 2015.<br />
We believe that these accomplishments reflect <strong>Savola</strong>’s commitment <strong>to</strong> its strategy and<br />
confidence in its core business. For 2012, we expect profits from core operations of<br />
SAR1,258mn, we also expect <strong>Savola</strong> <strong>to</strong> lock capital gains of SAR168mn this year.<br />
Figure 6 <strong>Savola</strong>: reducing reliance on capital gains<br />
1600<br />
1400<br />
1200<br />
1000<br />
800<br />
660<br />
753<br />
97<br />
129<br />
168<br />
600<br />
400<br />
852<br />
933<br />
1,074<br />
1,258<br />
200<br />
488 477 496<br />
0<br />
-200<br />
-294<br />
-46<br />
-400<br />
2006 2007 2008 2009 2010 2011 2012E<br />
Net income before capital gain<br />
<strong>Capital</strong> gain<br />
Source: Company data, <strong>Al</strong> <strong>Rajhi</strong> <strong>Capital</strong><br />
Fruitful investments<br />
Last year, <strong>Savola</strong> posted respectable income of SAR463mn from its associates. Additionally,<br />
<strong>Savola</strong> recorded dividend income of SAR194mn from <strong>Al</strong>marai and Herfy. As the company<br />
uses equity reporting method for its associates (above 20%), we present below our forecasts<br />
for <strong>Savola</strong>’s income from its associates. In addition, we present the interest income<br />
(dividend) for the group (excluding capital gains) for the coming years. We have used our<br />
own forecasts for <strong>Al</strong>marai and Herfy, both of which are under our coverage. We have also<br />
forecasted dividend payments for both the companies. We further note that we did not<br />
forecast any dividend payment from <strong>Savola</strong>’s other associates (Kinan and others) as we have<br />
inadequate information about them.<br />
Figure 7 <strong>Savola</strong>: income from associates and interest income (mn SAR)<br />
Income from<br />
associates 2010 2011 2012 2013 2014 2015 2016<br />
<strong>Al</strong>marai 384 340 453 535 628 716 816<br />
Herfy 61 72 83 96 107 118 130<br />
Real estate 36 30 27 24 22 20 18<br />
Eliminations and other -19 -30 -39 -46 -53 -60 -67<br />
Total 462 412 524 610 704 794 897<br />
Interest income<br />
<strong>Al</strong>marai 155 155 155 175 201 229 261<br />
Herfy 39 44 44 44 67 67 74<br />
Total 194 199 199 219 267 296 335<br />
Source: Company data, <strong>Al</strong> <strong>Rajhi</strong> <strong>Capital</strong><br />
Disclosures Please refer <strong>to</strong> the important disclosures at the back of this report. 4
<strong>Savola</strong> <strong>Group</strong> Company<br />
Food-Diversified –Industrial<br />
28 March 2012<br />
Oil division<br />
Tough year ahead<br />
Emerging markets helped offset<br />
poor operating profits from<br />
mature markets<br />
Last year, the aggregate edible oil business, emerging as well as mature markets, posted an<br />
outstanding revenue growth of 33%. However, margins were severely impacted as the gross<br />
margin declined by 300 bps reaching 14%. The Saudi margins <strong>to</strong>ok a massive hit as the<br />
company fixed the prices of its finished products in an attempt <strong>to</strong> stabilize them. This<br />
impacted the margins severely as raw material prices fluctuated throughout the year.<br />
Additionally, Iran’s net margins also declined <strong>to</strong> 6.3% from 7.7% in 2010. This was mainly<br />
due <strong>to</strong> negative currency impact and higher logistics costs. The foregoing issues coupled with<br />
poor profit growth from Egypt and Turkey led <strong>to</strong> operating profits declining in the mature<br />
markets by 7%. However, the emerging markets (mainly <strong>Al</strong>geria and Sudan) helped offset<br />
this poor operating performance; operating profits grew <strong>to</strong> SAR109mn in 2011 as compared<br />
<strong>to</strong> losses of SAR23mn in 2010. This resulted in an aggregate operating profit growth of 14.5%.<br />
Figure 8 Edible oil geographical revenue breakdown (mn SAR)<br />
182<br />
595<br />
1,800<br />
847<br />
2,600<br />
Operations in Saudi, GCC, Yemen & Sham <strong>Savola</strong> Bahshahar Afia Egypt Yudium Turkey <strong>Savola</strong> Kazakhestan<br />
Source: Company data, <strong>Al</strong> <strong>Rajhi</strong> <strong>Capital</strong><br />
As a pure refiner, we question<br />
<strong>Savola</strong>’s decision <strong>to</strong> offer stable<br />
prices in the local market<br />
Declining margins in local market pose a concern<br />
Last year, the local operations chalked up an impressive revenue growth of 38%. However,<br />
the net profit declined by almost 9%. According <strong>to</strong> <strong>Savola</strong>’s annual report, the company<br />
wanted <strong>to</strong> stabilize oil prices in the market. We question <strong>Savola</strong>’s decision <strong>to</strong> do so as this will<br />
expose the company <strong>to</strong> any fluctuations in raw material prices and make the company’s<br />
future profits unstable. Looking ahead, we are unenthusiastic about the local operations<br />
despite having market consensus forecasts relatively lower commodity prices in 2012.<br />
Figure 9 Crude soybean prices (US$c/lb)<br />
65<br />
60<br />
55<br />
50<br />
45<br />
40<br />
35<br />
30<br />
14-Dec-09 14-Jun-10 14-Dec-10 14-Jun-11 14-Dec-11 14-Jun-12 14-Dec-12<br />
consesus estimates<br />
Crude soybean Usd/lb<br />
Source: Bloomberg, <strong>Al</strong> <strong>Rajhi</strong> <strong>Capital</strong><br />
Disclosures Please refer <strong>to</strong> the important disclosures at the back of this report. 5
<strong>Savola</strong> <strong>Group</strong> Company<br />
Food-Diversified –Industrial<br />
28 March 2012<br />
We expect the margin pressure<br />
<strong>to</strong> continue in Iran<br />
Uncertain outlook in Iran<br />
As mentioned earlier in this report, the outlook for Iran’s economy is uncertain. Many<br />
countries, including Europe and the US, have imposed an oil embargo on the country. This<br />
has resulted in a depreciation of Iran’s currency against the US dollar. Market consensus<br />
suggests the possibility of a further depreciation of its currency. Therefore, <strong>Savola</strong>’s foreign<br />
earnings, in terms of Saudi Riyal, might be affected in the near future. In addition, we are<br />
concerned about the fund flow between Saudi Arabia and Iran. Last year, revenues from Iran<br />
rose by 29%, while profits only grew by 5%. The management attributes weak profits mainly<br />
<strong>to</strong> currency devaluation and higher logistic costs. As edible oil is an essential product we<br />
expect revenues <strong>to</strong> remain strong; however, margins are likely <strong>to</strong> remain under pressure<br />
Weak profitability in Egypt<br />
Despite 24% hike in revenues, <strong>Savola</strong> did not report any profit growth from Egypt. Given the<br />
<strong>to</strong>ugh economic and political conditions in Egypt, we believe <strong>Savola</strong> managed its operations<br />
well. Looking ahead, we expect the operations in Egypt <strong>to</strong> fare well this year compared <strong>to</strong> last<br />
year. That said, profits will remain under pressure as the political and economic situation<br />
remains unstable.<br />
Emerging markets made the difference<br />
Last year, the company clocked an outstanding revenue and profit growth of 50% and 224%<br />
respectively in Sudan. <strong>Al</strong>geria also dished out a respectable performance as the company<br />
managed <strong>to</strong> turn around its fortunes. Revenues in <strong>Al</strong>geria grew by 46% while profits reached<br />
SAR23.5mn as compared <strong>to</strong> a loss of SAR37.5mn. These remarkable results helped offset the<br />
operating declines from the emerging markets. On the other hand, operations in Morocco<br />
continue <strong>to</strong> encounter problems as the company has failed <strong>to</strong> record profits since 2009.<br />
<strong>Savola</strong> is currently re-evaluating its operations, which implies that exiting this market is<br />
possible.<br />
We are expecting a revenue<br />
growth of 5.8% from the edible<br />
oil division<br />
2012; emerging markets <strong>to</strong> spur growth<br />
Looking ahead, we are not excited about the revenue growth from the mature markets as we<br />
expect it <strong>to</strong> grow by a modest 2.5%. We also expect the pressure on margins <strong>to</strong> continue,<br />
especially in Saudi and Iran. On the other hand, we are positive about the emerging markets<br />
(mainly <strong>Al</strong>geria and Sudan) and expect them <strong>to</strong> fuel growth this year. We expect revenues<br />
from the emerging markets <strong>to</strong> grow by 25%.<br />
We believe poor performance from mature markets will outweigh positive performance from<br />
emerging ones; hence, we expect operating profits from edible oil division <strong>to</strong> decline by 6.8%<br />
next year.<br />
Figure 10 Figure 8 Edible oil forecasts (mn SAR)<br />
(SAR mn) 2010A 2011A y-y% 2012E y-y%<br />
Revenues<br />
Global Afia (mature markets) 6,014 7,958 32.3% 8,153 2.5%<br />
Emerging markets 989 1,354 36.9% 1,695 25.2%<br />
Total 7,003 9,312 33.0% 9,848 5.8%<br />
Operating prift<br />
Global Afia (mature markets) 628 584 -7.0% 505 -13.4%<br />
Emerging markets -23 109 N/M 141 29.1%<br />
Total 605 693 14.5% 646 -6.8%<br />
EBIT% 8.6% 7.4% 6.6%<br />
Source: Company data, <strong>Al</strong> <strong>Rajhi</strong> <strong>Capital</strong><br />
Disclosures Please refer <strong>to</strong> the important disclosures at the back of this report. 6
<strong>Savola</strong> <strong>Group</strong> Company<br />
Food-Diversified –Industrial<br />
28 March 2012<br />
Saudi still imports refined sugar<br />
and we expect local refiners <strong>to</strong><br />
close this deficit<br />
Sugar division<br />
Saturated local market<br />
The Saudi sugar market is one of the biggest ones in the MENA region. According <strong>to</strong> the US<br />
Department of Agriculture, the <strong>to</strong>tal supply of refined sugar in the Saudi market was almost<br />
3mn MT in 2011. Out of the <strong>to</strong>tal supply, local production was almost 86%, which<br />
surprisingly implies that imported refined sugar is still considerably high (around 13%). This<br />
makes no sense as shipping refined sugar is very expensive as compared <strong>to</strong> shipping raw<br />
sugar. Similar <strong>to</strong> edible oil, shipping refined sugar requires hygienic conditions and care.<br />
Figure 11 Saudi sugar market <strong>to</strong>p view<br />
(000) MT 2006 2007 2008 2009 2010 2011 2012E 2013E 2014E 2015E 2016E<br />
Beginning s<strong>to</strong>ck 189 199 644 864 1,194 1,424 1,574 1,655 1,728 1,802 1,866<br />
Raw sugar imports 1,000 1,335 1,245 1,320 1,280 1,150 1,072 1,068 1,061 1,050 1,038<br />
Local production 1,189 1,534 1,889 2,184 2,474 2,574 2672 2759 2845 2926 3017<br />
y-y% 29.0% 23.1% 15.6% 13.3% 4.0% 3.8% 3.3% 3.1% 2.8% 3.1%<br />
Refined sugar imports 260 425 450 380 410 400 392 381 370 357 332<br />
% of <strong>to</strong>t supply 17.9% 21.7% 19.2% 14.8% 14.2% 13.4% 12.8% 12.1% 11.5% 10.9% 9.9%<br />
% of <strong>to</strong>t consumption 35.1% 54.8% 49.2% 42.2% 44.6% 42.1% 40.0% 38.0% 36.0% 34.0% 31.0%<br />
Total supply 1,449 1,959 2,339 2,564 2,884 2,974 3063 3140 3215 3283 3348<br />
Total exports 510 540 560 470 540 450 429 408 386 368 342<br />
Total consumption 740 775 915 900 920 950 979 1,003 1,027 1,049 1,070<br />
y-y% 4.7% 18.1% -1.6% 2.2% 3.3% 3.0% 2.5% 2.4% 2.1% 2.0%<br />
<strong>Savola</strong> local mrkt share% 69.9% 86.7% 84.8% 89.4% 89.0% 88.9% 89.0% 88.9% 89.6%<br />
Population (mn) 24.1 24.9 25.8 26.7 27.6 28.5 29.3 30.1 30.8 31.4 32.1<br />
Population growth 3.4% 3.4% 3.4% 3.4% 3.3% 3.0% 2.5% 2.4% 2.1% 2.0%<br />
consumption per capita (kg pa) 30.7 31.1 35.5 33.8 33.4 33.4 33.4 33.4 33.4 33.4 33.4<br />
Source: Bloomberg, USDA, CDSI, Company data, <strong>Al</strong> <strong>Rajhi</strong> <strong>Capital</strong><br />
Note: USDA figures are combined figure. i.e., it is based on real, estimated and forecasted figures<br />
We expect Saudi’s per capita<br />
sugar consumption <strong>to</strong> stabilize<br />
From a strategic <strong>to</strong>p-down view, we believe that the Saudi sugar market is saturated and<br />
apart from normal population growth, the sole room we see for growth is closing the<br />
imported refined sugar gap or deficit. To put this gap in<strong>to</strong> perspective, it is approximately<br />
40% of <strong>Savola</strong>’s local capacity. We believe in the long run, local refiners will close this gap<br />
gradually. That said, we don’t think <strong>Savola</strong> will expand their capacity as its market share,<br />
based on our calculations, is currently high (90%) and increasing it further might trigger<br />
monopolistic violations. <strong>Al</strong>so, the Saudi per capita consumption is within regional<br />
consumption rates, supporting our view that the Saudi market is mostly saturated.<br />
Figure 12 Global sugar consumption per capita (KG/capita)<br />
Figure 13 Local consumption ( 000 MT) and <strong>Savola</strong>’s market share<br />
60.0<br />
50.0<br />
40.0<br />
30.0<br />
20.0<br />
10.0<br />
0.0<br />
57<br />
45<br />
40 38<br />
35 35 33 33 32 32 32<br />
21 19<br />
10<br />
1,600<br />
1,400<br />
1,200<br />
1,000<br />
800<br />
600<br />
400<br />
200<br />
0<br />
Title:<br />
Source:<br />
95%<br />
90%<br />
Please fill in the <strong>value</strong>s above <strong>to</strong> have them entered in your report85%<br />
2008 2009 2010 2011 2012E 2013E 2014E 2015E 2016E<br />
80%<br />
75%<br />
70%<br />
65%<br />
60%<br />
55%<br />
50%<br />
Consumption/capita<br />
Refined sugar imports Total consumption <strong>Savola</strong> local mrkt share%<br />
Source: Bloomberg, USDA, CDSI, Company data, <strong>Al</strong> <strong>Rajhi</strong> <strong>Capital</strong><br />
Source: Bloomberg, USDA, CDSI, Company data, <strong>Al</strong> <strong>Rajhi</strong> <strong>Capital</strong><br />
Disclosures Please refer <strong>to</strong> the important disclosures at the back of this report. 7
<strong>Savola</strong> <strong>Group</strong> Company<br />
Food-Diversified –Industrial<br />
28 March 2012<br />
Problems faced by <strong>Savola</strong>’s sugar division<br />
<strong>Savola</strong> runs three distribution channels for their refined sugar. 1) industrial clients, and2)<br />
repackaging cus<strong>to</strong>mers, where the cost increasing or decreasing is transparent <strong>to</strong> both types<br />
and <strong>Savola</strong> does not face problems passing on any increases in raw cane prices <strong>to</strong> its<br />
cus<strong>to</strong>mers . Finally, 3) retail cus<strong>to</strong>mers, where most of <strong>Savola</strong>’s problems come from. Ideally,<br />
the highest margins for <strong>Savola</strong>’s sugar division should come from retail clients. <strong>Savola</strong> takes a<br />
small refiner premium from industrial and repackaging clients, while the highest margins<br />
accrue from branded refined sugar. However, <strong>Savola</strong> still finds it difficult <strong>to</strong> pass rising prices<br />
<strong>to</strong> retail cus<strong>to</strong>mers due <strong>to</strong> aggressive consumers’ reaction and governments’ restrictions. For<br />
instance, the Egyptian government has a cap on sugar prices. This creates an unlevelled<br />
playing field for <strong>Savola</strong> as they do not receive subsidies from the government like local<br />
players while they are not allowed <strong>to</strong> raise their prices either. The local market is favourable<br />
compared <strong>to</strong> the Egyptian market as we believe <strong>Savola</strong> can pass on most increases in prices <strong>to</strong><br />
its retail cus<strong>to</strong>mers more easily.<br />
We expect <strong>Savola</strong> <strong>to</strong> integrate<br />
its operations by crop growing<br />
and processing beet sugar in<br />
Egypt<br />
As refineries are operating at<br />
close <strong>to</strong> capacity rates, we do<br />
not expect much growth from<br />
the sugar division<br />
Integrated sugar business <strong>to</strong> ease pressure on margins<br />
In contrast <strong>to</strong> edible oil operations, <strong>Savola</strong> is moving <strong>to</strong>ward integrating its sugar business;<br />
the group announced its plan <strong>to</strong> refine beet sugar in Egypt. Until now, the group did not<br />
unveil any plans <strong>to</strong> crop grow or process beet in<strong>to</strong> raw sugar yet; however, we believe that it<br />
will happen soon given the fact that Egypt is considered a source land for beet sugar. Beet<br />
sugar prices are cheaper than cane sugar; therefore, producing beet sugar in a market like<br />
Egypt where the government has caps on refined sugar prices makes perfect sense. In<br />
addition, <strong>Savola</strong> is planning <strong>to</strong> export beet sugar <strong>to</strong> neighbouring countries. We are positive<br />
on the beet sugar plan as it will be easier for <strong>Savola</strong> <strong>to</strong> not only pass on fluctuations in raw<br />
beet prices <strong>to</strong> its cus<strong>to</strong>mers but also secure raw sugar on the long run. The proposed capacity<br />
for the beet refinery is 0.18mn MT pa; the group expects production <strong>to</strong> start in Q1 2013.<br />
Softening in sugar prices <strong>to</strong> boost margins<br />
Last year sugar division witnessed decent performance; revenues grew by almost 17% on the<br />
back of strong performance from Saudi and Egypt. This was mainly due <strong>to</strong> increases in prices<br />
especially in the local market. Bloomberg consensus forecast slightly lower prices for raw<br />
sugar of USd23.6/lb on average for 2012 compared <strong>to</strong> an average of USd26.85/lb in 2011.<br />
Further, the volatility of prices since the beginning of the year was low compared <strong>to</strong> the first<br />
quarter of 2011 and 2010. Therefore, we expect EBIT margins <strong>to</strong> improve from 5.6% levels in<br />
2011 <strong>to</strong> 6.1% in 2012. In addition, we expect a revenue growth of little roughly 3.8% this year<br />
as most refineries are running close <strong>to</strong> full capacity.<br />
Figure 14 Raw sugar prices and consensus estimates (US$c/lb)<br />
40<br />
35<br />
30<br />
25<br />
20<br />
15<br />
10<br />
5<br />
0<br />
02-Jan-09 02-Jul-09 02-Jan-10 02-Jul-10 02-Jan-11 02-Jul-11 02-Jan-12 02-Jul-12 02-Jan-13<br />
Consensus estimates<br />
Raw sugar prices (sugar#11)<br />
Source: Bloomberg, <strong>Al</strong> <strong>Rajhi</strong> <strong>Capital</strong><br />
Below we summarize our forecasts for sugar division<br />
Figure 15 <strong>Savola</strong> sugar division forecasts<br />
(SARmn) 2010A 2011A y-y% 2012E y-y%<br />
Revenues<br />
Saudi 3,541 4,082 15.3% 4,160 1.9%<br />
Egypt 1,482 1,779 20.0% 1,921 8.0%<br />
Total 5,023 5,861 16.7% 6,081 3.8%<br />
EBIT 216 327 51.4% 371 13.4%<br />
EBIT margin% 4.3% 5.6% 6.1%<br />
Source: Company data, <strong>Al</strong> <strong>Rajhi</strong> <strong>Capital</strong><br />
Disclosures Please refer <strong>to</strong> the important disclosures at the back of this report. 8
<strong>Savola</strong> <strong>Group</strong> Company<br />
Food-Diversified –Industrial<br />
28 March 2012<br />
Retail segment<br />
Margins <strong>to</strong> make the difference<br />
Boosted by ever-increasing population and changing shopping habits, the grocery retailing<br />
sec<strong>to</strong>r in Saudi Arabia is growing at a steady pace. We expect the grocery market <strong>to</strong> grow at a<br />
CAGR of 3.3% <strong>to</strong> reach SAR99bn by 2016. With a market share of about 10% as per our<br />
estimates, <strong>Al</strong>-Azizia Panda United (owned 74.4% by <strong>Savola</strong>) leads the grocery retail market,<br />
followed by <strong>Al</strong>othaim which occupies a market share of about 4.5%. While we believe that<br />
small convenience s<strong>to</strong>res will continue <strong>to</strong> dominate the market space, we see ample potential<br />
for hypermarkets and supermarkets <strong>to</strong> up its market share as a result of Saudis’ changing<br />
lifestyles and habits.<br />
Figure 16 Saudi grocery retail market size (mn SAR)<br />
Figure 17 Saudi grocery retail: dominated by small groceries<br />
60<br />
50<br />
46 47 48<br />
50<br />
51<br />
53 53 53<br />
Title:<br />
Source:<br />
Please fill in the <strong>value</strong>s above <strong>to</strong> have them entered in your report<br />
40<br />
30<br />
20<br />
15<br />
21<br />
21<br />
25<br />
10<br />
0<br />
FY09 FY10 FY11 FY12E FY13E FY14E FY15E FY16E<br />
Hyper markets Super markets small grocery & other<br />
Source: Euromoni<strong>to</strong>r, <strong>Al</strong> <strong>Rajhi</strong> <strong>Capital</strong> estimates<br />
Saudis’ changing lifestyle is<br />
favouring large retailers<br />
Source: Euromoni<strong>to</strong>r, <strong>Al</strong> <strong>Rajhi</strong> <strong>Capital</strong> estimates<br />
As mentioned earlier, the grocery retail market is still dominated by small grocery s<strong>to</strong>res. We<br />
estimate its share <strong>to</strong> be about 57%. Hypermarkets and supermarkets constitute around 18%<br />
and 25% respectively. Over the past few years, the hypermarkets clocked the highest growth<br />
rates; we estimate that it grew between 2008 and 2011 at a CAGR of 7.6%. Supermarkets<br />
come in second with a CAGR of 4%, while small groceries grew at a CAGR of only 2.25% over<br />
the same period.<br />
Low penetration for hyper and super markets<br />
We believe that Saudi shopping habits are undergoing a makeover and moving closer <strong>to</strong> a<br />
western pattern. This notion is supported by different facts. Firstly, Saudi Arabia has a young<br />
population which is increasingly shopping in supermarkets and hypermarkets rather than<br />
traditional ones. Secondly, even older people are changing their shopping habits given the<br />
comfortable experience such supermarkets and hypermarkets offer. Finally, as the Saudi<br />
society is generally conservative and places of entertainment are limited, supermarkets and<br />
hypermarkets are seen as a perfect destination <strong>to</strong> unwind. As a result, families tend <strong>to</strong> visit<br />
large s<strong>to</strong>res partly for entertainment. Compared <strong>to</strong> many local grocery retailers, <strong>Al</strong> Azizia<br />
outlets are well positioned as they offer a feel-good experience families are looking for.<br />
Figure 18 International retailing: sub-segment break down<br />
Figure 19 <strong>Savola</strong>: number of supermarkets and hypermarkets<br />
120%<br />
250<br />
Title:<br />
Source:<br />
100%<br />
200<br />
Please fill in the <strong>value</strong>s above <strong>to</strong> have them entered in your report<br />
80%<br />
60%<br />
40%<br />
150<br />
100<br />
81 85 87<br />
120<br />
126<br />
132<br />
139<br />
146<br />
20%<br />
0%<br />
United<br />
Kingdom<br />
Italy Spain United Arab<br />
Emirates<br />
Saudi Arabia<br />
50<br />
0<br />
47 48 51 54<br />
64<br />
1 3 5 8 16<br />
33 34 38 40 46 53 61 70<br />
Hyper markets Super markets small grocery & other<br />
Source: Euromoni<strong>to</strong>r, <strong>Al</strong> <strong>Rajhi</strong> <strong>Capital</strong><br />
Source: Company data, <strong>Al</strong> <strong>Rajhi</strong> <strong>Capital</strong><br />
Hypermarkets<br />
Supermarkets<br />
Disclosures Please refer <strong>to</strong> the important disclosures at the back of this report. 9
<strong>Savola</strong> <strong>Group</strong> Company<br />
Food-Diversified –Industrial<br />
28 March 2012<br />
We expect <strong>Savola</strong> <strong>to</strong> operate<br />
200 s<strong>to</strong>res by 2015<br />
More outlets are in the pipeline<br />
We assume that growth in supermarkets and hypermarket will outperform that of small<br />
convenience s<strong>to</strong>res. <strong>Al</strong> Azizia is leading this trend and has outlined a clear strategy of<br />
launching new supermarket and hypermarket outlets. <strong>Savola</strong> announced that it is planning <strong>to</strong><br />
operate a <strong>to</strong>tal of 200 outlets by 2015 (now 131). This aggressive expansion plan will ensure<br />
that Panda will be better placed <strong>to</strong> capture a higher market share in this space in the future.<br />
We estimate that if everything goes as planned, <strong>Savola</strong>’s market share will reach 14% by 2015.<br />
Figure 20 <strong>Savola</strong>: retail revenues vs. sales per sqm per week<br />
Figure 21 <strong>Savola</strong>: retail SSS and EBIT margins<br />
20,000<br />
18,000<br />
16,000<br />
14,000<br />
12,000<br />
10,000<br />
550<br />
500<br />
450<br />
400<br />
14.0%<br />
12.0%<br />
10.0%<br />
8.0%<br />
6.0%<br />
Title:<br />
Source:<br />
Please fill in the <strong>value</strong>s above <strong>to</strong> have them entered in your report<br />
450<br />
400<br />
350<br />
300<br />
250<br />
200<br />
8,000<br />
6,000<br />
4,000<br />
350<br />
300<br />
4.0%<br />
2.0%<br />
150<br />
100<br />
50<br />
2,000<br />
FY07 FY08 FY09 FY10 FY11 FY12E FY13E FY14E FY15E FY16E<br />
250<br />
0.0%<br />
FY08 FY09 FY10 FY11 FY12E FY13E FY14E FY15E FY16E<br />
0<br />
Retail revenues (SARmn)<br />
Source: Company data, <strong>Al</strong> <strong>Rajhi</strong> <strong>Capital</strong><br />
Sales per sqm (SAR per week) - RHS<br />
Source: Company data, <strong>Al</strong> <strong>Rajhi</strong> <strong>Capital</strong><br />
EBIT (SAR mn) - RHS SSS growth% EBIT margin%<br />
As much as this is encouraging, <strong>Savola</strong>’s retail margins are squeezed. Usually, new<br />
hypermarkets take between 3-4 years <strong>to</strong> reach full utilization, while supermarkets take only 1-<br />
2 years. During the past three years, we estimate that aggregate selling space grew by 13%;<br />
while hypermarkets’ selling space grew by 15% over the same period. Compared <strong>to</strong> 2010, last<br />
year’s retail margins have shown significant improvement. As <strong>Savola</strong> intends <strong>to</strong> embark on an<br />
aggressive expansion program for the next few years, we do not expect any major<br />
improvements in margins.<br />
As hypermarkets mature, we<br />
expect margins <strong>to</strong> improve<br />
Low efficiency compared <strong>to</strong> local and international players<br />
When we compare <strong>Savola</strong>’s retail division with its international peers, we can see its<br />
depressed efficiency ratios. That said, compared <strong>to</strong> local players such as <strong>Al</strong>othaim, Panda’s<br />
efficiency are decent. We believe the western lifestyle makes international players’ sales per<br />
sqm higher than the Saudi ones. In addition, online selling is a major sales channel for<br />
international retailers. Looking ahead, we believe efficiency will improve gradually as hyper<br />
and super markets mature. We expect sales per sqm <strong>to</strong> increase at a CAGR of 4% over the<br />
next 4-5 years.<br />
Figure 22 Comparing <strong>Savola</strong>’s (retail) sales per sqm per week with international peers<br />
1,400.0<br />
1,200.0<br />
1,000.0<br />
1,315<br />
6.0%<br />
5.5%<br />
5.0%<br />
800.0<br />
600.0<br />
689<br />
4.5%<br />
4.0%<br />
3.5%<br />
400.0<br />
383<br />
3.0%<br />
200.0<br />
2.5%<br />
0.0<br />
Tesco* Sainsbury's <strong>Savola</strong>**<br />
2.0%<br />
Sales per sq mt (SAR weekly)<br />
EBIT%<br />
Source: Companies data, <strong>Al</strong> <strong>Rajhi</strong> <strong>Capital</strong><br />
Disclosures Please refer <strong>to</strong> the important disclosures at the back of this report. 10
<strong>Savola</strong> <strong>Group</strong> Company<br />
Food-Diversified –Industrial<br />
28 March 2012<br />
Online selling is emerging as<br />
one of the major selling<br />
channels for international<br />
retailers<br />
More work needs <strong>to</strong> be done <strong>to</strong><br />
improve Panda labelling<br />
No movement <strong>to</strong>ward online selling<br />
With above 50% of the Saudi population under 18 years, we strongly believe that online<br />
selling will be one of the main selling channels in Saudi retail space. We have seen the<br />
banking sec<strong>to</strong>r investing heavily in building the adequate infrastructure for it and the number<br />
of online users is increasing rapidly. However, we do not see serious initiatives from most<br />
retailers in Saudi <strong>to</strong>ward improving this channel. We suppose the main reason is the lack of<br />
proper addressing systems. As much as we concur that this is a major concern, we strongly<br />
believe that such problems can be resolved through innovative ways. Online selling is now<br />
one of the major selling channels for international retailers, for example, Sainsbury’s online<br />
sales reached GBP1bn in 2011.<br />
A lot more needs <strong>to</strong> be done <strong>to</strong> improve Panda labelling<br />
Labelling accounted for almost 4-5% of <strong>Savola</strong>’s <strong>to</strong>p-line retail revenues in 2011. In our view,<br />
this is very low compared <strong>to</strong> international grocery retailers, for example, ASDA (UK grocery<br />
retailer) claims that 50% of its revenues are from their own labels. Given Panda’s long his<strong>to</strong>ry<br />
(established in 1978), we consider that Panda’s management was not successful in marketing<br />
their labelled products. We see that the effort Panda puts in expanding its outlets should at<br />
least match its efforts in promoting their own brands. This is critical considering <strong>Savola</strong>’s<br />
retail weak margin; we believe that developing this area coupled with improving efficiency<br />
ought <strong>to</strong> boost retail segment margin <strong>to</strong> a reasonable level compared <strong>to</strong> international peers<br />
2012: Retail is a key growth driver<br />
We expect the retail segment <strong>to</strong> continue its double-digit <strong>to</strong>p-line growth <strong>to</strong> reach SAR10.7bn<br />
(growth of 17%) in 2012. Furthermore, as the company announced its aggressive expansion<br />
plan for the next 3-5 years, we do not expect significant improvement in margins as the<br />
company’s focus is <strong>to</strong> gain market share. Furthermore, we expect sales per sqm <strong>to</strong> steadily<br />
improve over the next few years. Below we summarise our forecast for the retail division for<br />
the next four years.<br />
Figure 23 <strong>Savola</strong>: Retail division forecasts<br />
FY09 FY10 FY11 FY12E FY13E FY14E FY15E FY16E<br />
Hypermarkets 33 37 41 45 50 55 60 61<br />
Supermarkets 81 87 90 101 112 125 140 142<br />
Sales per sqm (SAR per week) 412.2 368.2 382.4 397.9 413.9 430.7 448.1 466.2<br />
Revenues (SAR mn) 7,356 8,183 9,182 10,737 11,741 12,792 13,946 14,711<br />
Revenue growth% 31.1% 11.2% 12.2% 16.9% 9.4% 8.9% 9.0% 5.5%<br />
Same s<strong>to</strong>res sales% 13.0% 5.0% 7.4% 5.9% 5.5% 5.0% 5.0% 5.0%<br />
EBIT% 1.0% 1.9% 2.5% 2.6% 2.7% 2.7% 2.7% 2.8%<br />
Source: Company data, <strong>Al</strong> <strong>Rajhi</strong> <strong>Capital</strong><br />
Disclosures Please refer <strong>to</strong> the important disclosures at the back of this report. 11
<strong>Savola</strong> <strong>Group</strong> Company<br />
Food-Diversified –Industrial<br />
28 March 2012<br />
Plastic division<br />
Charts steady growth path, margins <strong>to</strong><br />
improve<br />
<strong>Savola</strong>’s plastic division was established in 1980 as a supporting unit for the edible oil<br />
division. Currently, only 5% of this division’s revenues are from the edible oil business, while<br />
the remaining 95% is from external cus<strong>to</strong>mers. With a production capacity of about 140k MT<br />
per annum, <strong>Savola</strong>’s plastics division is one of the leaders in the region. <strong>Savola</strong> operates its<br />
plastic division through six manufacturing facilities (four in Saudi and two in Egypt). The<br />
output product range for this division includes film, packaging materials, bottles, closures,<br />
pre-forms, industrial containers, and crates.<br />
Last year, the plastics division witnessed a solid <strong>to</strong>p-line growth of 13%. However, the<br />
margins were squeezed as feeds<strong>to</strong>ck prices rose. This resulted in a decline of almost 9% in<br />
profits. Generally, passing any hikes in raw materials (petrochemical products) is not as<br />
difficult as it’s in sugar and edible oil segments due <strong>to</strong> the fact that the company has no retail<br />
clients for this division and price fluctuations are transparent <strong>to</strong> its clients. However, <strong>Savola</strong>’s<br />
plastics division is under clients’ pressure <strong>to</strong> lower its prices as those clients such as <strong>Al</strong>marai<br />
is unable <strong>to</strong> pass such increases <strong>to</strong> end consumers.<br />
Outlook for this year<br />
The plastics division’s margins are severely affected by rising raw material prices. In our<br />
latest petrochemical report (Diversified companies <strong>to</strong> outperform published on February 20,<br />
2012), we expect average prices for polyethylene and polypropylene in 2012 <strong>to</strong> be relatively<br />
lower than that seen in 2011, despite the recent rise in the last couple of weeks. Based on that,<br />
we expect slight improvement in margins. For <strong>to</strong>p-line growth, we believe revenues will<br />
slightly increase on higher utilization rates. Hence, we expect revenues <strong>to</strong> grow by 12%<br />
reaching SAR1,122mn. Below we summarize our forecasts.<br />
Figure 24 <strong>Savola</strong>: plastic division forecasts<br />
2010 2011 2012E 2013E 2014E 2015E 2016E<br />
Total production (MT pa) 99.0 101.0 106.9 112.8 118.0 122.7 127.7<br />
Utalization rate% 69.5% 70.9% 75.0% 79.1% 82.8% 86.1% 89.6%<br />
Revenues (mn SAR) 884 1,002 1,122 1,204 1,267 1,318 1,371<br />
y-y growth% 18.0% 13.3% 12.0% 7.3% 5.3% 4.0% 4.0%<br />
EBIT (mn SAR) 118 99 116 126 134 145 158<br />
EBIT% 13.3% 9.9% 10.3% 10.5% 10.6% 11.0% 11.5%<br />
Source: Company data, <strong>Al</strong> <strong>Rajhi</strong> <strong>Capital</strong><br />
Disclosures Please refer <strong>to</strong> the important disclosures at the back of this report. 12
<strong>Savola</strong> <strong>Group</strong> Company<br />
Food-Diversified –Industrial<br />
28 March 2012<br />
Valuation<br />
Previously, we <strong>value</strong>d <strong>Savola</strong> <strong>Group</strong> by using two methods - Long-Run DEP and comparative<br />
multiples. Now, we will replace the latter by Sum of The Parts (SoTP) approach. We believe<br />
that valuing each division of the group separately will be more appropriate for <strong>Savola</strong> given<br />
its diverse operations.<br />
For the long-run DEP method of estimating <strong>Savola</strong>’s <strong>fair</strong> <strong>value</strong>, we use a WACC of 13%. We<br />
calculate WACC as shown below.<br />
Figure 25 Cost of <strong>Capital</strong><br />
Risk-free Rate 2.4%<br />
Market Risk Premium 14.2%<br />
Adjusted Beta 0.98<br />
Cost of Equity 16.3%<br />
Pre-tax Cost of Debt 6.2%<br />
Effective Tax rate 13.6%<br />
After-tax Cost of Debt 5.4%<br />
Target D/(D+E) 30.0%<br />
WACC 13.0%<br />
Source: Bloomberg, <strong>Al</strong> <strong>Rajhi</strong> <strong>Capital</strong><br />
We have decreased our previous assumption of a 30-year period of competitive advantage<br />
when we first initiated coverage of <strong>Savola</strong> in 2010 <strong>to</strong> 28 years now. On this basis, we estimate<br />
the <strong>fair</strong> <strong>value</strong> per share at SAR31.<br />
The SoTP approach attempts <strong>to</strong> <strong>value</strong> the constituent segments of <strong>Savola</strong> separately. In an<br />
ideal case, we would use the long-run DCF or DEP analysis for all segments of the business.<br />
However, the fact that many of <strong>Savola</strong>’s companies are unlisted and hence financial<br />
information on these companies as well as overseas operations is limited.<br />
We have therefore decided <strong>to</strong> <strong>value</strong> <strong>Savola</strong>‘s various operations – including its domestic<br />
business – on a comparative basis, using aggregate EV/EBITDA multiples for peer companies<br />
<strong>to</strong> estimate a <strong>fair</strong> enterprise <strong>value</strong> for <strong>Savola</strong>‘s constituent parts. We believe this method<br />
provides a practical and speedy way of valuing <strong>Savola</strong>‘s constituent parts. We have always<br />
preferred EV/EBITDA <strong>to</strong> PE as a valuation measure since it is not affected by differences in<br />
financial structure or tax rate.<br />
Edible oil<br />
We have used a selection of international companies as a base of comparison with <strong>Savola</strong>’s<br />
Edible oil division.<br />
Figure 26 <strong>Savola</strong>: comparables for edible oil business<br />
Comparables Bloomberg Ticker Market Cap (mn SAR) Country name EV (mn SAR) EBITDA (mn SAR) EV/EBITDA<br />
2011A 2012E 2011A 2012E<br />
Tiger Brands LTD TBS SJ Equity 24,780 Johannseburg 25,734 1,958 2,066 13.1 12.5<br />
Archer Daniels Midland ADM US Equity 79,501 New York 107,914 12,320 12,190 8.8 8.9<br />
China Agri-Industries 606 HK Equity 10,354 Hong Kong 25,560 2,119 2,503 12.1 10.2<br />
Aggregate 159,208 16,397 16,758 9.7 9.5<br />
Source: Bloomberg, <strong>Al</strong> <strong>Rajhi</strong> <strong>Capital</strong>, as of 26 th March, 2012<br />
Sugar<br />
We have used a selection of international companies as a base of comparison with <strong>Savola</strong>’s<br />
Sugar division.<br />
Disclosures Please refer <strong>to</strong> the important disclosures at the back of this report. 13
<strong>Savola</strong> <strong>Group</strong> Company<br />
Food-Diversified –Industrial<br />
28 March 2012<br />
Figure 27 <strong>Savola</strong>: comparables for sugar business<br />
Comparables Bloomberg Ticker Market Cap (mn SAR) Country name EV (mn SAR)<br />
2011A 2012E 2011A 2012E<br />
Tongaat Hulett TON SJ Equity 5,376 Johannseburg 8,218 943 994 8.7 8.3<br />
Suedzucker AG SZU GY Equity 22,422 Germany 33,136 5,092 5,035 6.5 6.6<br />
TATE & LYLE PLC TATE LN Equity 19,943 London 22,631 3,186 2,697 7.1 8.4<br />
Cosan SA Industria CSAN3 BZ Equity 29,098 Brazil 37,938 4,468 5,474 8.5 6.9<br />
Aggregate 101,922 13,689 14,200 7.4 7.2<br />
Source: Bloomberg, <strong>Al</strong> <strong>Rajhi</strong> <strong>Capital</strong>, as of 26 th March, 2012<br />
Figure 28 <strong>Savola</strong>: comparables for plastic business<br />
EBITDA (mn SAR)<br />
EV/EBITDA<br />
Plastics<br />
We have used a selection of international companies as a base of comparison with <strong>Savola</strong>’s<br />
Plastic division. We have also included Takween (which was recently added <strong>to</strong> the Saudi s<strong>to</strong>ck<br />
market) in<strong>to</strong> our comparison universe.<br />
Comparables Bloomberg Ticker Market Cap (mn SAR) Country name EV (mn SAR)<br />
2011A 2012E 2011A 2012E<br />
Takween TAKWEEN AB Equity 1,913 Saudi 2,153 131 N/A 16.4 N/A<br />
Ball Corp BLL US Equity 24,316 New York 36,081 4,381 4,591 8.2 7.9<br />
Amcor LTD AMCRY US Equity 34,213 Australia 47,874 4,824 6,143 9.9 7.8<br />
Aggregate 86,108 9,336 10,734 9.2 8.0<br />
Source: Bloomberg, <strong>Al</strong> <strong>Rajhi</strong> <strong>Capital</strong>, as of 26 th March, 2012<br />
Figure 29 <strong>Savola</strong>: comparables for retail business<br />
EBITDA (mn SAR) EV/EBITDA<br />
Retail<br />
<strong>Savola</strong>’s biggest division in terms of revenue share is retail. It is considered the leader in the<br />
Saudi market and has minor retail operations outside the Kingdom. It has one s<strong>to</strong>re in the<br />
UAE and eleven s<strong>to</strong>res in Lebanon. Saudi operations account for 94% of the <strong>to</strong>tal retail<br />
turnover. We have used a selection of companies in the local and international markets as a<br />
base of comparison with <strong>Savola</strong>’s retail division.<br />
Comparables Bloomberg Ticker Market Cap (mn SAR) Country name EV (mn SAR)<br />
2011A 2012E 2011A 2012E<br />
<strong>Al</strong>othaim Markets AOTHAIM AB Equity 2,070 Saudi 2,357 219 266 10.7 8.9<br />
Tesco PLC TSCO LN Equity 163,074 London 217,825 30,320 31,437 7.2 6.9<br />
Wall-Mart WMT US Equity 786,031 New York 978,518 130,090 136,242 7.5 7.2<br />
Sainsbury PLC SBRY LN Equity 35,910 London 48,697 7,130 7,751 6.8 6.3<br />
Aggregate 1,247,398 167,759 175,696 7.4 7.1<br />
Source: Company data, <strong>Al</strong> <strong>Rajhi</strong> <strong>Capital</strong><br />
Figure 30 <strong>Savola</strong>: comparables for pasta business<br />
EBITDA (mn SAR) EV/EBITDA<br />
Pasta<br />
We have used a selection of international companies as a base of comparison with <strong>Savola</strong>’s<br />
pasta division.<br />
Comparables Bloomberg Ticker Market Cap (mn SAR) Country name EV (mn SAR)<br />
2011A 2012E 2011A 2012E<br />
Ebro Foods Sa EBRO SM Equity 11,082 Spain 12,917 1,519 1,541 8.5 8.4<br />
M Dias Branco SA MDIA3 BZ Equity 11,230 Brazil 12,173 1,081 1,263 11.3 9.6<br />
Aggregate 25,090 2,601 2,804 9.6 8.9<br />
Source: Company data, <strong>Al</strong> <strong>Rajhi</strong> <strong>Capital</strong><br />
EBITDA (mn SAR) EV/EBITDA<br />
Investments<br />
<strong>Savola</strong>’s main investments are in <strong>Al</strong>marai and Herfy; both companies are listed on the Saudi<br />
S<strong>to</strong>ck exchange and will be included in our valuations at their market <strong>value</strong>. Currently, we are<br />
Overweight on <strong>Al</strong>marai and Neutral on Herfy. Had we rated any of these investments as<br />
underweight, we would have used our estimated <strong>fair</strong> <strong>value</strong> for it. Other <strong>Savola</strong>’s investments<br />
include real estate and private equity investments. We will include these investments as their<br />
book <strong>value</strong>s due <strong>to</strong> limited available information.<br />
Disclosures Please refer <strong>to</strong> the important disclosures at the back of this report. 14
<strong>Savola</strong> <strong>Group</strong> Company<br />
Food-Diversified –Industrial<br />
28 March 2012<br />
<strong>Savola</strong>: Sum of the parts (SoTP) valuation<br />
Using the above basis of comparison, we calculate SoTP <strong>fair</strong> <strong>value</strong> for <strong>Savola</strong> as follows:<br />
Figure 31 <strong>Savola</strong>: SoTP valuation<br />
EBITDA 2011 2012<br />
Enterprise Value<br />
(SAR mn) Method 2011 2012E (x) (x) Interest in EV 2011 2012E<br />
Retail business Comparables 483.0 553.4 7.4 7.1 74.4% 2,672.0 2,922.9<br />
Oil business Comparables 809.0 823.5 9.7 9.5 86.7% 6,814.3 6,786.4<br />
Sugar business Comparables 417.0 462.2 7.4 7.2 72.9% 2,263.8 2,418.7<br />
Plastics business Comparables 153.0 182.9 9.2 8.0 100% 1,411.1 1,467.2<br />
Pasta business Comparables (started Q4 2011) 8.0 31.2 9.6 8.9 100% 77.2 279.4<br />
Total Enterprise Value 13,238.4 13,874.7<br />
Associates Method Ownership Value<br />
<strong>Al</strong>marai Market price (SAR111.75) 29.9% 7,685.0<br />
Herfy Market price (SAR88.5) 49.0% 1,301.0<br />
Kinan Real Estate Devalopment Book <strong>value</strong> at 1.0x 30.0% 507.6<br />
Other Book <strong>value</strong> at 1.0x <strong>value</strong> at YE 2011 832.8<br />
Enterprise Value YE 2011 13,238.4 13,874.7<br />
Net debt 5,019 4,233<br />
Equity <strong>value</strong> at YE 2011 8,219.4 9,641.3<br />
Associates and other investments 10,326.4 10,326.4<br />
Total Equity Value 18,545.8 19,967.7<br />
Shares outstanding (mn) 500 500<br />
Price per Share 37.1 39.9<br />
Source: <strong>Al</strong> <strong>Rajhi</strong> <strong>Capital</strong><br />
<strong>Al</strong>marai and Herfy 26 th March closing prices<br />
On SoTP basis, we estimate<br />
<strong>fair</strong> <strong>value</strong> at SAR39.9<br />
On a comparative SoTP basis, we therefore estimate the <strong>fair</strong> <strong>value</strong> per share for <strong>Savola</strong> at<br />
SAR39.9. As mentioned earlier, we are Overweight on <strong>Al</strong>marai and Neutral on Herfy, had we<br />
been underweight on any of them we would have replaced the market <strong>value</strong> with our<br />
estimated <strong>fair</strong> <strong>value</strong>. We believe our calculations represent a <strong>fair</strong> <strong>value</strong> of <strong>Savola</strong>’s share price.<br />
The chart below presents a breakdown of our estimated <strong>fair</strong> enterprise <strong>value</strong> for <strong>Savola</strong>.<br />
Figure 32 breakdown of estimated <strong>fair</strong> enterprise <strong>value</strong> using SoTP<br />
2.0%<br />
10.6%<br />
21.1%<br />
17.4%<br />
48.9%<br />
Source: <strong>Al</strong> <strong>Rajhi</strong> <strong>Capital</strong><br />
Retail business Oil business Sugar business Plastics business Pasta business<br />
To recap, we estimate the <strong>fair</strong> <strong>value</strong> per share for <strong>Savola</strong> on a long-run DEP basis at SAR31,<br />
but on a SoTP basis at SAR39.9. The two methods are both valid, thus we gave an equal<br />
weight for both. Our new target price for <strong>Savola</strong> is SAR35.47.<br />
Our new target offers limited upside potential <strong>to</strong> the current price; therefore we change our<br />
rating <strong>to</strong> Neutral. We further note the group trades at an EV/EBITDA of 7.8 and P/E multiple<br />
of 12.1.<br />
Disclosures Please refer <strong>to</strong> the important disclosures at the back of this report. 15
<strong>Savola</strong> <strong>Group</strong> Company<br />
Food-Diversified –Industrial<br />
28 March 2012<br />
We are expecting revenues for<br />
2012 <strong>to</strong> reach SAR27.8mn<br />
Income Statement (SARmn) 12/10A 12/11A 12/12E 12/13E 12/14E<br />
Revenue 20,985 25,196 27,833 30,726 33,587<br />
Cost of Goods Sold (17,614) (21,225) (23,357) (25,578) (28,104)<br />
Gross Profit 3,370 3,971 4,475 5,148 5,483<br />
Government Charges<br />
S.G. & A. Costs (2,485) (2,707) (3,062) (3,533) (3,695)<br />
Operating EBIT 886 1,263 1,414 1,615 1,788<br />
Cash Operating Costs (19,286) (23,374) (25,756) (28,382) (31,003)<br />
EBITDA 1,699 1,822 2,076 2,344 2,583<br />
Depreciation and Amortisation (813) (558) (662) (729) (795)<br />
Operating Profit 886 1,263 1,414 1,615 1,788<br />
Net financing income/(costs) (218) (317) (388) (376) (376)<br />
Forex and Related Gains - - - - -<br />
Provisions - - - - -<br />
Other Income 782 690 926 798 934<br />
Other Expenses (284) (35) - - -<br />
Net Profit Before Taxes 1,166 1,601 1,951 2,037 2,347<br />
Taxes (140) (132) (190) (199) (219)<br />
Minority Interests (139) (266) (336) (377) (446)<br />
Net profit available <strong>to</strong> shareholders 887 1,202 1,426 1,461 1,682<br />
Dividends (625) (650) (650) (650) (673)<br />
Transfer <strong>to</strong> <strong>Capital</strong> Reserve - - - - -<br />
We assume a dividend payout<br />
ratio above 40% for the next<br />
three year<br />
We are expecting net profit<br />
growth of 18.6% this year<br />
We expect improvement in<br />
retail and sugar margins <strong>to</strong><br />
boost overall margins<br />
12/10A 12/11A 12/12E 12/13E 12/14E<br />
Adjusted Shares Out (mn) 500.0 500.0 500.0 500.0 500.0<br />
CFPS (SAR) 3.68 4.05 4.85 5.13 5.85<br />
EPS (SAR) 1.773 2.405 2.852 2.922 3.364<br />
DPS (SAR) 1.250 1.300 1.300 1.300 1.346<br />
Growth 12/10A 12/11A 12/12E 12/13E 12/14E<br />
Revenue Growth 17.1% 20.1% 10.5% 10.4% 9.3%<br />
Gross Profit Growth 8.5% 17.8% 12.7% 15.0% 6.5%<br />
EBITDA Growth 19.6% 7.2% 14.0% 12.9% 10.2%<br />
Operating Profit Growth -6.3% 42.6% 11.9% 14.2% 10.8%<br />
Net Profit Growth -6.8% 35.6% 18.6% 2.5% 15.1%<br />
EPS Growth -6.8% 35.6% 18.6% 2.5% 15.1%<br />
Margins 12/10A 12/11A 12/12E 12/13E 12/14E<br />
Gross profit margin 16.1% 15.8% 16.1% 16.8% 16.3%<br />
EBITDA margin 8.1% 7.2% 7.5% 7.6% 7.7%<br />
Operating Margin 4.2% 5.0% 5.1% 5.3% 5.3%<br />
Pretax profit margin 5.6% 6.4% 7.0% 6.6% 7.0%<br />
Net profit margin 4.2% 4.8% 5.1% 4.8% 5.0%<br />
Other Ratios 12/10A 12/11A 12/12E 12/13E 12/14E<br />
ROCE 8.1% 10.6% 10.6% 11.1% 11.2%<br />
ROIC 10.5% 17.2% 14.6% 16.9% 18.7%<br />
ROE 12.7% 16.3% 17.6% 16.5% 17.2%<br />
Effective Tax Rate 12.0% 8.2% 9.7% 9.8% 9.3%<br />
Capex/Sales 2.3% 4.1% 3.8% 4.7% 4.8%<br />
Dividend Payout Ratio 70.5% 54.1% 45.6% 44.5% 40.0%<br />
<strong>Savola</strong> trades on a forward PE<br />
of 12.1<br />
Valuation Measures 12/10A 12/11A 12/12E 12/13E 12/14E<br />
P/E (x) 19.5 14.3 12.1 11.8 10.3<br />
P/CF (x) 9.4 8.5 7.1 6.7 5.9<br />
P/B (x) 2.5 2.2 2.0 1.9 1.7<br />
EV/Sales (x) 0.8 0.7 0.6 0.5 0.5<br />
EV/EBITDA (x) 9.3 9.3 7.8 6.6 6.2<br />
EV/EBIT (x) 17.8 13.5 11.4 9.6 9.0<br />
EV/IC (x) 2.3 1.9 1.9 1.8 1.5<br />
Dividend Yield 3.6% 3.8% 3.8% 3.8% 3.9%<br />
Source: Company data, <strong>Al</strong> <strong>Rajhi</strong> <strong>Capital</strong><br />
Disclosures Please refer <strong>to</strong> the important disclosures at the back of this report. 16
<strong>Savola</strong> <strong>Group</strong> Company<br />
Food-Diversified –Industrial<br />
28 March 2012<br />
<strong>Savola</strong>’s balance sheet is<br />
expanding<br />
Balance Sheet (SARmn) 12/10A 12/11A 12/12E 12/13E 12/14E<br />
Cash and Cash Equivalents 533 1,214 2,028 3,141 2,916<br />
Current Receivables 1,503 1,816 1,928 2,128 3,090<br />
Inven<strong>to</strong>ries 2,527 3,152 3,262 3,078 3,359<br />
Other current assets 1,348 1,592 1,432 1,432 1,432<br />
Total Current Assets 5,911 7,774 8,651 9,780 10,798<br />
Fixed Assets 4,739 5,384 5,660 6,377 7,194<br />
Investments 6,107 5,332 5,804 5,804 5,804<br />
Goodwill 1,025 1,302 1,341 1,341 1,341<br />
Other Intangible Assets - - - - -<br />
Total Other Assets - 309 309 309 309<br />
Total Non-current Assets 11,871 12,328 13,114 13,831 14,648<br />
Total Assets 17,782 20,101 21,765 23,610 25,446<br />
Short Term Debt 2,779 3,412 3,410 3,410 3,410<br />
Accounts Payable 2,076 2,719 2,847 3,241 3,493<br />
Accrued Expenses 1,550 1,429 1,898 2,161 2,284<br />
Dividends Payable - - - - -<br />
Other Current Liabilities 200 181 - - -<br />
Total Current Liabilities 6,605 7,740 8,155 8,812 9,187<br />
Long-Term Debt 2,395 2,821 2,852 2,852 2,852<br />
Other LT Payables 292 58 284 284 284<br />
Provisions 276 410 307 307 307<br />
Total Non-current Liabilities 2,962 3,290 3,442 3,442 3,442<br />
Minority interests 1,195 1,348 1,699 2,076 2,522<br />
Paid-up share capital 5,000 5,000 5,000 5,000 5,000<br />
Total Reserves 2,020 2,722 3,468 4,280 5,295<br />
Total Shareholders' Equity 7,020 7,722 8,468 9,280 10,295<br />
Total Equity 8,215 9,071 10,167 11,356 12,816<br />
Total Liabilities & Shareholders' Equity 17,782 20,101 21,765 23,610 25,446<br />
Ratios 12/10A 12/11A 12/12E 12/13E 12/14E<br />
Net Debt (SARmn) 4,641 5,019 4,233 3,121 3,345<br />
Net Debt/EBITDA (x) 2.73 2.76 2.04 1.33 1.29<br />
Net Debt <strong>to</strong> Equity 56.5% 55.3% 41.6% 27.5% 26.1%<br />
EBITDA Interest Cover (x) 7.8 5.7 5.3 6.2 6.9<br />
BVPS (SAR) 14.04 15.44 16.94 18.56 20.59<br />
Cashflow Statement (SARmn) 12/10A 12/11A 12/12E 12/13E 12/14E<br />
Net Income before Tax & Minority Interest 1,166 1,601 1,951 2,037 2,347<br />
Depreciation & Amortisation 813 558 662 729 795<br />
Decrease in Working <strong>Capital</strong> (137) (187) 116 641 (868)<br />
Other Operating Cashflow 12 (398) (190) (199) (219)<br />
Cashflow from Operations 1,853 1,573 2,540 3,208 2,055<br />
<strong>Capital</strong> Expenditure (478) (1,025) (1,056) (1,446) (1,612)<br />
New Investments (497) 152 - - -<br />
Others (164) 104 - - -<br />
Cashflow from investing activities (1,139) (768) (1,056) (1,446) (1,612)<br />
Net Operating Cashflow 714 805 1,483 1,763 443<br />
Dividends paid <strong>to</strong> ordinary shareholders (623) (498) (650) (650) (667)<br />
Proceeds from issue of shares - - - - -<br />
Effects of Exchange Rates on Cash - - - - -<br />
Other Financing Cashflow (689) (385) - - -<br />
Cashflow from financing activities (1,138) (124) (650) (650) (667)<br />
Total cash generated (424) 682 833 1,113 (225)<br />
Cash at beginning of period 1,001 533 1,214 2,028 3,141<br />
Implied cash at end of year 577 1,215 2,047 3,141 2,916<br />
We expect Capex/sales ratio <strong>to</strong><br />
remain relatively low<br />
Ratios 12/10A 12/11A 12/12E 12/13E 12/14E<br />
Capex/Sales 2.3% 4.1% 3.8% 4.7% 4.8%<br />
Source: Company data, <strong>Al</strong> <strong>Rajhi</strong> <strong>Capital</strong><br />
Disclosures Please refer <strong>to</strong> the important disclosures at the back of this report. 17
<strong>Savola</strong> <strong>Group</strong> Company<br />
Food-Diversified –Industrial<br />
28 March 2012<br />
Disclaimer and additional disclosures for Equity Research<br />
Disclaimer<br />
This research document has been prepared by <strong>Al</strong> <strong>Rajhi</strong> <strong>Capital</strong> Company (“<strong>Al</strong> <strong>Rajhi</strong> <strong>Capital</strong>”) of Riyadh, Saudi Arabia. It has been<br />
prepared for the general use of <strong>Al</strong> <strong>Rajhi</strong> <strong>Capital</strong>’s clients and may not be redistributed, retransmitted or disclosed, in whole or in<br />
part, or in any form or manner, without the express written consent of <strong>Al</strong> <strong>Rajhi</strong> <strong>Capital</strong>. Receipt and review of this research<br />
document constitute your agreement not <strong>to</strong> redistribute, retransmit, or disclose <strong>to</strong> others the contents, opinions, conclusion, or<br />
information contained in this document prior <strong>to</strong> public disclosure of such information by <strong>Al</strong> <strong>Rajhi</strong> <strong>Capital</strong>. The information<br />
contained was obtained from various public sources believed <strong>to</strong> be reliable but we do not guarantee its accuracy. <strong>Al</strong> <strong>Rajhi</strong> <strong>Capital</strong><br />
makes no representations or warranties (express or implied) regarding the data and information provided and <strong>Al</strong> <strong>Rajhi</strong> <strong>Capital</strong><br />
does not represent that the information content of this document is complete, or free from any error, not misleading, or fit for any<br />
particular purpose. This research document provides general information only. Neither the information nor any opinion expressed<br />
constitutes an offer or an invitation <strong>to</strong> make an offer, <strong>to</strong> buy or sell any securities or other investment products related <strong>to</strong> such<br />
securities or investments. It is not intended <strong>to</strong> provide personal investment advice and it does not take in<strong>to</strong> account the specific<br />
investment objectives, financial situation and the particular needs of any specific person who may receive this document.<br />
Inves<strong>to</strong>rs should seek financial, legal or tax advice regarding the appropriateness of investing in any securities, other investment<br />
or investment strategies discussed or recommended in this document and should understand that statements regarding future<br />
prospects may not be realized. Inves<strong>to</strong>rs should note that income from such securities or other investments, if any, may fluctuate<br />
and that the price or <strong>value</strong> of such securities and investments may rise or fall. Fluctuations in exchange rates could have adverse<br />
effects on the <strong>value</strong> of or price of, or income derived from, certain investments. Accordingly, inves<strong>to</strong>rs may receive back less than<br />
originally invested. <strong>Al</strong> <strong>Rajhi</strong> <strong>Capital</strong> or its officers or one or more of its affiliates (including research analysts) may have a financial<br />
interest in securities of the issuer(s) or related investments, including long or short positions in securities, warrants, futures,<br />
options, derivatives, or other financial instruments. <strong>Al</strong> <strong>Rajhi</strong> <strong>Capital</strong> or its affiliates may from time <strong>to</strong> time perform investment<br />
banking or other services for, solicit investment banking or other business from, any company mentioned in this research<br />
document. <strong>Al</strong> <strong>Rajhi</strong> <strong>Capital</strong>, <strong>to</strong>gether with its affiliates and employees, shall not be liable for any direct, indirect or consequential<br />
loss or damages that may arise, directly or indirectly, from any use of the information contained in this research document.<br />
This research document and any recommendations contained are subject <strong>to</strong> change without prior notice. <strong>Al</strong> <strong>Rajhi</strong> <strong>Capital</strong><br />
assumes no responsibility <strong>to</strong> update the information in this research document. Neither the whole nor any part of this research<br />
document may be altered, duplicated, transmitted or distributed in any form or by any means. This research document is not<br />
directed <strong>to</strong>, or intended for distribution <strong>to</strong> or use by, any person or entity who is a citizen or resident of or located in any locality,<br />
state, country or other jurisdiction where such distribution, publication, availability or use would be contrary <strong>to</strong> law or which<br />
would subject <strong>Al</strong> <strong>Rajhi</strong> <strong>Capital</strong> or any of its affiliates <strong>to</strong> any registration or licensing requirement within such jurisdiction.<br />
Additional disclosures<br />
1. Explanation of <strong>Al</strong> <strong>Rajhi</strong> <strong>Capital</strong>’s rating system<br />
<strong>Al</strong> <strong>Rajhi</strong> <strong>Capital</strong> uses a three-tier rating system based on absolute upside or downside potential for all s<strong>to</strong>cks under its coverage<br />
except financial s<strong>to</strong>cks and those few other companies not compliant with Islamic Shariah law:<br />
"Overweight": Our target price is more than 15% above the current share price, and we expect the share price <strong>to</strong> reach the target<br />
on a 6-9 month time horizon.<br />
"Neutral": We expect the share price <strong>to</strong> settle at a level between 5% below the current share price and 15% above the current share<br />
price on a 6-9 month time horizon.<br />
"Underweight": Our target price is more than 5% below the current share price, and we expect the share price <strong>to</strong> reach the target on<br />
a 6-9 month time horizon.<br />
2. Definitions<br />
"Time horizon": Our analysts make recommendations on a 6-9 month time horizon. In other words, they expect a given s<strong>to</strong>ck <strong>to</strong> reach their<br />
target price within that time.<br />
"Fair <strong>value</strong>": We estimate <strong>fair</strong> <strong>value</strong> per share for every s<strong>to</strong>ck we cover. This is normally based on widely accepted methods appropriate <strong>to</strong><br />
the s<strong>to</strong>ck or sec<strong>to</strong>r under consideration, e.g. DCF (discounted cash flow) or SoTP (sum of the parts) analysis.<br />
"Target price": This may be identical <strong>to</strong> estimated <strong>fair</strong> <strong>value</strong> per share, but is not necessarily the same. There may be very good reasons<br />
why a share price is unlikely <strong>to</strong> reach <strong>fair</strong> <strong>value</strong> within our time horizon. In such a case we set a target price which differs from estimated <strong>fair</strong><br />
<strong>value</strong> per share, and explain our reasons for doing so.<br />
Please note that the achievement of any price target may be impeded by general market and economic trends and other external fac<strong>to</strong>rs, or<br />
if a company’s profits or operating performance exceed or fall short of our expectations.<br />
Contact us<br />
Dr. Saleh <strong>Al</strong>suhaibani<br />
Khalid <strong>Al</strong>ruwaigh<br />
Head of Research<br />
Head of Equity Research<br />
Tel : +966 1 2119434 Tel: +966 1 2119310<br />
alsuhaibanis@alrajhi-capital.com<br />
alruwaighka@alrajhi-capital.com<br />
<strong>Al</strong> <strong>Rajhi</strong> <strong>Capital</strong><br />
Research Department<br />
Head Office, King Fahad Road<br />
P.O. Box 5561<br />
Riyadh 11432<br />
Kingdom of Saudi Arabia<br />
Email: research@alrajhi-capital.com<br />
<strong>Al</strong> <strong>Rajhi</strong> <strong>Capital</strong>, a subsidiary of <strong>Al</strong> <strong>Rajhi</strong> Bank, is licensed by the Saudi Arabian <strong>Capital</strong> Market<br />
Authority, License No. 07068/37.<br />
Disclosures Please refer <strong>to</strong> the important disclosures at the back of this report. 18