Savola Group Close to fair value - Al Rajhi Capital
Savola Group Close to fair value - Al Rajhi Capital
Savola Group Close to fair value - Al Rajhi Capital

Create successful ePaper yourself
Turn your PDF publications into a flip-book with our unique Google optimized e-Paper software.
<strong>Savola</strong> <strong>Group</strong> Company<br />
Food-Diversified –Industrial<br />
28 March 2012<br />
Corporate summary Share information Valuation<br />
<strong>Savola</strong>, one of the leading companies<br />
in food and retail industries, is a group<br />
that holds several companies which<br />
operate in different industries. The<br />
<strong>Group</strong> operates its businesses through<br />
three Core Sec<strong>to</strong>rs; these are "<strong>Savola</strong><br />
Foods Sec<strong>to</strong>r", including Edible Oil,<br />
Sugar and Pasta, "<strong>Savola</strong> Retail<br />
Sec<strong>to</strong>r", including Retail (Panda - and<br />
Hyper Panda), and <strong>Savola</strong> Plastics<br />
Sec<strong>to</strong>r. Furthermore, <strong>Savola</strong> has a<br />
major investment in the leading dairy<br />
company in the GCC (<strong>Al</strong>marai) and in<br />
Herfy Foods Company with stakes of<br />
29.9% and 49% respectively.<br />
Edible oil was a key <strong>to</strong>p-line<br />
growth driver in 2011<br />
<strong>Savola</strong> added pasta <strong>to</strong> its<br />
product portfolio<br />
<strong>Savola</strong> expects capital gains of<br />
SAR231mn this year<br />
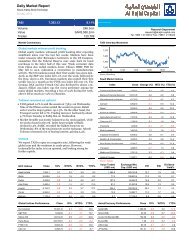
Market cap (SAR/US$) 17.25bn / 4.600bn<br />
52-week range 23.70 - 35.40<br />
Daily avg volume (US$)<br />
4.960mn<br />
Shares outstanding<br />
500.0mn<br />
Free float (est) 60.1%<br />
Performance: 1M 3M 12M<br />
Absolute 5.5% 21.5% 23.2%<br />
Relative <strong>to</strong> index -3.1% 0.1% 4.1%<br />
Major Shareholder:<br />
Masik Holding Company 12.0%<br />
General Organisation for Social Insurance 10.9%<br />
Source: Bloomberg, <strong>Al</strong> <strong>Rajhi</strong> <strong>Capital</strong><br />
Period End 12/11A 12/12E 12/13E 12/14E<br />
Revenue (SARmn) 25,196 27,833 30,726 33,587<br />
EBITDA (SARmn) 1,822 2,076 2,344 2,583<br />
Net Profit (SARmn) 1,202 1,426 1,461 1,682<br />
EPS (SAR) 2.40 2.85 2.92 3.36<br />
DPS (SAR) 1.30 1.30 1.30 1.35<br />
EPS Growth 35.6% 18.6% 2.5% 15.1%<br />
EV/EBITDA (x) 9.3 7.8 6.6 6.2<br />
P/E (x) 14.3 12.1 11.8 10.3<br />
P/B (x) 2.2 2.0 1.9 1.7<br />
Dividend Yield 3.8% 3.8% 3.8% 3.9%<br />
Source: Company data, <strong>Al</strong> <strong>Rajhi</strong> <strong>Capital</strong><br />
<strong>Savola</strong> <strong>Group</strong><br />
Positive outlook, concerns persist<br />
Creditable performance in 2011<br />
<strong>Savola</strong> ended 2011 with increases of 20% in revenues, 17.8% in gross profit, and 42.6% in<br />
operating profit. Excluding capital gains, net profits were up by almost 9.2% y-o-y, exceeding<br />
our as well as management’s expectations. The robust performance was mainly propelled by<br />
an exceptional performance from the edible oil division, with revenue growth of 33% y-o-y.<br />
Sugar, plastics, and retail divisions also fared well with revenues growing by 17%, 13% and<br />
12% y-o-y respectively. Margins of edible oil and plastics divisions slipped. However, they<br />
were offset by better margins at sugar and retail segments<br />
In 2011, <strong>Savola</strong> acquired two Egyptian pasta companies - <strong>Al</strong>-Farasha and <strong>Al</strong>- Malika - for a<br />
<strong>value</strong> of SAR713.5mn. Despite having limited information about both the companies, we<br />
believe that moving a step further in the food <strong>value</strong> chain is a significant development for the<br />
group and thereby diversifying its food basket.<br />
Further, <strong>Savola</strong> was able <strong>to</strong> turn its edible oil operation in <strong>Al</strong>geria in<strong>to</strong> a profitable business;<br />
the group recorded profits of SAR23.5mn versus a loss of SAR37.5 in 2010. Furthermore,<br />
<strong>Savola</strong> managed <strong>to</strong> sell lands in Riyadh and Jeddah last year, recording handsome capital<br />
gains of SAR153mn. <strong>Savola</strong> also signed a contract with Knowledge Economic City Company<br />
<strong>to</strong> sell its shares in a plot of land located in <strong>Al</strong> Madinah city. <strong>Savola</strong>, as a result, expects <strong>to</strong><br />
record capital gains of SAR231mn this year.<br />
Figure 1 <strong>Savola</strong>: 2011 vs. 2010<br />
(SAR) mn 2010 2011 %chg. Comments<br />
Revenues<br />
Edible oil 7,004 9,312 33.0% Outstanding revenue growth for the year from both mature (32%) and emerging markets (37%)<br />
Sugar 5,023 5,861 16.7% Solid performance for 2011; revenues from Saudi and Egypt rose by 15% and 20% respectively.<br />
Retail 8,183 9,182 12.2% Strong like for like growth of almost 7% in addition <strong>to</strong> opening 4 supermarkets and 3 hypermarkets during the year<br />
Plastics 884 1,002 13.3% Strong <strong>to</strong>p line performance driven by increasing prices and higher utilization rates<br />
Pasta 0 51 N/A Pasta acquisition was completed in Q4 2011<br />
Franchising 44 47 6.8% Company sold this business in 2011<br />
HQ/Elimination/Impairments -153 -259 N/M<br />
Total 20,985 25,196 20.1%<br />
Operating profits<br />
Edible oil 605 693 14.5% Despite having a decline in mature markets, emerging markets drove operating profit growth<br />
Sugar 216 327 51.4% The ability <strong>to</strong> pass higher prices in the local market helped improving the profitability of this division<br />
Retail 154 228 47.8% Solid improvements in margins as many hypermarkets and supermarkets are maturing<br />
Plastics 118 99 -16.1% Declines in operating profits as raw prices increased<br />
Pasta 0 8 N/M Pasta acquisition was completed in Q4 2011<br />
Franchising -1 7 N/M Company sold this business in 2011<br />
HQ/Elimination/Impairments -206 -98<br />
Total 886 1,263 42.6%<br />
Net income 887 1,202 35.6% Excluding capital gains, net profit were up by almost 9.25%<br />
CAPEX 478 453 -5.4% 2011 did not witness huge CAPEX compared <strong>to</strong> previous years<br />
CAPEX/Sales 2.3% 1.8% -0.5% As mentioned above<br />
Source: Company data, <strong>Al</strong> <strong>Rajhi</strong> <strong>Capital</strong><br />
Disclosures Please refer <strong>to</strong> the important disclosures at the back of this report. 2