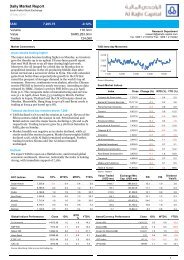
Retail Sector Report - Al Rajhi Capital
Retail Sector Report - Al Rajhi Capital
Retail Sector Report - Al Rajhi Capital

Create successful ePaper yourself
Turn your PDF publications into a flip-book with our unique Google optimized e-Paper software.
Abdullah <strong>Al</strong> Othaim Markets<br />
<strong>Retail</strong><br />
05 January 2013<br />
Balance Sheet (SARmn) 12/10A 12/11A 12/12A 12/13E 12/14E<br />
Cash and Cash Equivalents 45 44 121 156 306<br />
Current Receivables - - - - -<br />
Inventories 283 311 348 380 417<br />
Other current assets 82 97 90 90 90<br />
Total Current Assets 410 452 559 626 814<br />
Fixed Assets 948 1,083 1,137 1,229 1,327<br />
Investments 105 119 168 168 168<br />
Goodwill 15 13 12 12 12<br />
Other Intangible Assets - - - - -<br />
Total Other Assets - - - - -<br />
Total Non-current Assets 1,067 1,215 1,318 1,409 1,507<br />
Total Assets 1,478 1,667 1,877 2,036 2,321<br />
Short Term Debt 172 165 191 191 191<br />
Accounts Payable 552 686 652 718 789<br />
Accrued Expenses - - - - -<br />
Dividends Payable - - - - -<br />
Other Current Liabilities 98 83 111 111 111<br />
Total Current Liabilities 821 934 954 1,020 1,091<br />
Long-Term Debt 179 166 200 200 300<br />
Other LT Payables - - - - -<br />
Provisions 29 35 39 39 39<br />
Total Non-current Liabilities 208 202 239 239 339<br />
Minority interests - - - - -<br />
Paid-up share capital 225 225 225 225 225<br />
Total Reserves 224 306 458 551 665<br />
Total Shareholders' Equity 449 531 683 776 890<br />
Total Equity 449 531 683 776 890<br />
Total Liabilities & Shareholders' Equity 1,478 1,667 1,877 2,036 2,321<br />
We expect net debt to gradually<br />
decline over the forecast period<br />
Ratios 12/10A 12/11A 12/12A 12/13E 12/14E<br />
Net Debt (SARmn) 306 287 270 236 185<br />
Net Debt/EBITDA (x) 1.61 1.23 1.16 0.80 0.57<br />
Net Debt to Equity 68.1% 54.1% 39.5% 30.4% 20.8%<br />
EBITDA Interest Cover (x) (14.8) (1,670.3) (27.9) 507.9 (59.5)<br />
BVPS (SAR) 19.93 23.61 30.38 34.49 39.57<br />
Cashflow Statement (SARmn) 12/10A 12/11A 12/12A 12/13E 12/14E<br />
Net Income before Tax & Minority Interest 166 154 156 176 201<br />
Depreciation & Amortisation 50 75 88 119 131<br />
Decrease in Working <strong>Capital</strong> 55 73 (39) 34 34<br />
Other Operating Cashflow (7) (7) (14) (4) (5)<br />
Cashflow from Operations 263 295 190 324 360<br />
<strong>Capital</strong> Expenditure (277) (209) (143) (210) (229)<br />
New Investments - (1) (43) - -<br />
Others (7) - 13 - -<br />
Cashflow from investing activities (283) (209) (173) (210) (229)<br />
Net Operating Cashflow (20) 86 17 113 131<br />
Dividends paid to ordinary shareholders (56) (68) - (79) (81)<br />
Proceeds from issue of shares - - - - -<br />
Effects of Exchange Rates on Cash - - - - -<br />
Other Financing Cashflow - - - - -<br />
Cashflow from financing activities (42) (87) 60 (79) 19<br />
Total cash generated (62) (2) 78 35 150<br />
Cash at beginning of period 107 45 44 121 156<br />
Implied cash at end of year 45 44 121 156 306<br />
Ratios 12/10A 12/11A 12/12A 12/13E 12/14E<br />
Capex/Sales 7.9% 5.1% 3.3% 4.6% 4.5%<br />
Source: Company data, <strong>Al</strong> <strong>Rajhi</strong> <strong>Capital</strong><br />
Disclosures Please refer to the important disclosures at the back of this report. 30