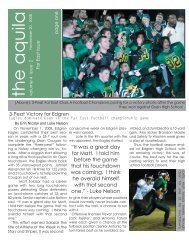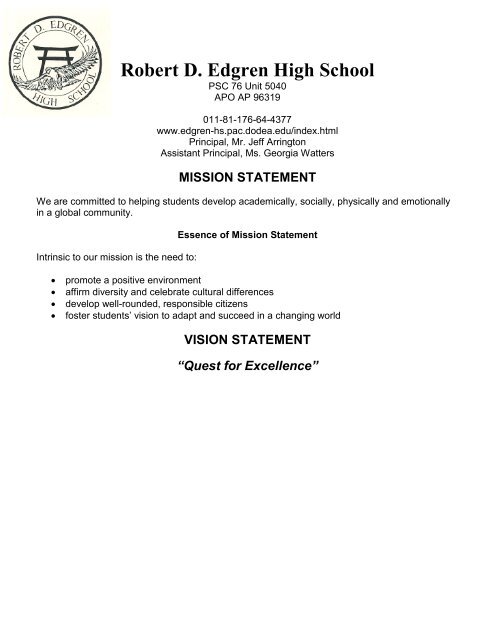
Robert D. Edgren High School - Edgren High School EagleNet ...
Robert D. Edgren High School - Edgren High School EagleNet ...
Robert D. Edgren High School - Edgren High School EagleNet ...

You also want an ePaper? Increase the reach of your titles
YUMPU automatically turns print PDFs into web optimized ePapers that Google loves.
<strong>Robert</strong> D. <strong>Edgren</strong> <strong>High</strong> <strong>School</strong><br />
PSC 76 Unit 5040<br />
APO AP 96319<br />
011-81-176-64-4377<br />
www.edgren-hs.pac.dodea.edu/index.html<br />
Principal, Mr. Jeff Arrington<br />
Assistant Principal, Ms. Georgia Watters<br />
MISSION STATEMENT<br />
We are committed to helping students develop academically, socially, physically and emotionally<br />
in a global community.<br />
Intrinsic to our mission is the need to:<br />
Essence of Mission Statement<br />
• promote a positive environment<br />
• affirm diversity and celebrate cultural differences<br />
• develop well-rounded, responsible citizens<br />
• foster students’ vision to adapt and succeed in a changing world<br />
VISION STATEMENT<br />
“Quest for Excellence”
<strong>Edgren</strong> <strong>High</strong> <strong>School</strong><br />
Description of Data:<br />
The TerraNova Multiple Assessments 2 nd Edition is a system-wide, norm –referenced assessment given to<br />
all students in grades 7 – 11. TerraNova focuses on reading, language, math, science and social studies.<br />
The table above shows the percentage of students scoring in the top two national quarters.<br />
Analysis of Data:<br />
The DoDEA goal is that 75% of all students tested score in the top two national quarters on TerraNova.<br />
The data suggests that, with the exceptions of grade level 7, <strong>Edgren</strong> <strong>High</strong> <strong>School</strong> is close to meeting the<br />
DoDEA goal, especially at the 10 th grade level. The vast majority of <strong>Edgren</strong> students need instruction that<br />
improves performance beyond the minimal standard.<br />
Presentation/Analysis of Data: TerraNova 2 nd Edition<br />
1
<strong>Edgren</strong> <strong>High</strong> <strong>School</strong><br />
Description of Data:<br />
The TerraNova Multiple Assessments 2 nd Edition is a system-wide, norm –referenced assessment given to<br />
all students in grades 7 – 11. TerraNova focuses on reading, language, math, science and social studies.<br />
The table above shows the percentage of students scoring in the bottom national quarter.<br />
Analysis of Data:<br />
The DoDEA goal is that fewer than 8% of students tested score in the bottom national quarter on<br />
TerraNova. The data suggests that, with the exceptions of grade level 7 and grade level 11, <strong>Edgren</strong> <strong>High</strong><br />
<strong>School</strong> is close to meeting the DoDEA goal, especially at the 8 th and 10 th grade level. The places for<br />
improvement appear to occur in the language and math sections, but even so, we are very close to<br />
meeting the DoDEA goal.<br />
2
<strong>Edgren</strong> <strong>High</strong> <strong>School</strong><br />
Presentation/Analysis of Data: PSAT<br />
Description of Data:<br />
PSAT focuses on Reading, Mathematics and Writing. The chart above shows the performance of <strong>Edgren</strong><br />
students on the PSAT reading section for grades 10 and 11 in year 2006.<br />
Analysis of Data:<br />
Most of our students are falling in the 30-59 range for PSAT Reading. There is a better bell-shaped curve<br />
for the 10 th and 11 th graders, but still most students are falling in the middle range for PSAT. Writing scores<br />
are skewed more toward the lower end than Reading and Mathematics.<br />
2008 PSAT Reading Scores<br />
Percent of<br />
Students<br />
40%<br />
35%<br />
30%<br />
25%<br />
20%<br />
15%<br />
10%<br />
5%<br />
0%<br />
20-29 30-39 40-49 50-59 60-69 70-80<br />
Score on PSAT<br />
10th and<br />
11th Grade<br />
Students<br />
3
<strong>Edgren</strong> <strong>High</strong> <strong>School</strong><br />
2008 PSAT Math Scores<br />
Percent of<br />
Students<br />
40%<br />
35%<br />
30%<br />
25%<br />
20%<br />
15%<br />
10%<br />
5%<br />
0%<br />
20-29 30-39 40-49 50-59 60-69 70-80<br />
Score on PSAT<br />
10th and<br />
11th Grade<br />
Students<br />
2008 PSAT Writing Scores<br />
Percent of<br />
Students<br />
40%<br />
35%<br />
30%<br />
25%<br />
20%<br />
15%<br />
10%<br />
5%<br />
0%<br />
20-29 30-39 40-49 50-59 60-69 70-80<br />
Score on PSAT<br />
10th and<br />
11th Grade<br />
Students<br />
4
<strong>Edgren</strong> <strong>High</strong> <strong>School</strong><br />
Existing <strong>School</strong> Data: Community Data and Information<br />
Data Collection Instrument(s)<br />
We selected the following instruments to collect data regarding Community Data and Information:<br />
SIS Data<br />
• Enrollment by Agency<br />
• Enrollment by Sponsor Rank/Pay Grade<br />
• Enrollment by Ethnic Group<br />
• Enrollment by ESL<br />
• Enrollment by Receiving Special Services<br />
• Enrollment by Math Lab<br />
• Enrollment by AVID<br />
Presentation of Data: Unique Local Insights–Community Data and Information 2006-2007<br />
Description of Data:<br />
Student demographic data has been disaggregated according to department or agency sponsorship, ethnic<br />
groups, ESL enrollment and students receiving special services.<br />
Analysis of Data:<br />
There is no correlation between military/civilian sponsorship and student performance.<br />
Enrollment By Sponsor's Employment<br />
Other, 18, 4%<br />
Army, 5, 1%<br />
Navy , 69, 14%<br />
Civilian, 73,<br />
15%<br />
Army<br />
Navy<br />
Air Force<br />
Civilian<br />
Other<br />
Air Force, 332,<br />
66%<br />
5
<strong>Edgren</strong> <strong>High</strong> <strong>School</strong><br />
No Information, 2,<br />
0%<br />
(Multi-Race) / >1<br />
Race, 89, 18%<br />
Student Enrollment By Race and<br />
Ethnicity<br />
American Indian<br />
or Alaskan Native,<br />
4, 1%<br />
American Indian &<br />
Pacific Islander, 0,<br />
0%<br />
Asian, 64, 13%<br />
Black / African<br />
American, 67,<br />
13%<br />
American Indian or<br />
Alaskan Native<br />
American Indian &<br />
Pacific Islander<br />
Asian<br />
Black / African<br />
American<br />
Declined to State<br />
Hawaiian or Pacific<br />
Islander<br />
White<br />
White, 253, 51%<br />
Hawaiian or<br />
Pacific Islander,<br />
10, 2%<br />
Declined to State,<br />
10, 2%<br />
(Multi-Race) / >1<br />
Race<br />
No Information<br />
English Language Learner Population<br />
ESL/ELL<br />
Students,<br />
43, 9%<br />
Non-ESL/ELL<br />
Students<br />
ESL/ELL Students<br />
Non-<br />
ESL/ELL<br />
Students,<br />
456, 91%<br />
6
<strong>Edgren</strong> <strong>High</strong> <strong>School</strong><br />
English Language Learner Levels<br />
Level 1, 1, 2%<br />
Level 2, 3, 7%<br />
Level 5, 30,<br />
70%<br />
Level 3, 4, 9%<br />
Level 4, 5, 12%<br />
Level 1<br />
Level 2<br />
Level 3<br />
Level 4<br />
Level 5<br />
Students receiving<br />
Specialized Services<br />
11% 11% 37%<br />
8th Grade<br />
9th Grade<br />
7th Grade<br />
16%<br />
10th Grade<br />
3% 22%<br />
11th Grade<br />
12th Grade<br />
7