Download - National Environmental Services Center - West Virginia ...
Download - National Environmental Services Center - West Virginia ...
Download - National Environmental Services Center - West Virginia ...

You also want an ePaper? Increase the reach of your titles
YUMPU automatically turns print PDFs into web optimized ePapers that Google loves.
J U R I E D A R T I C L E<br />
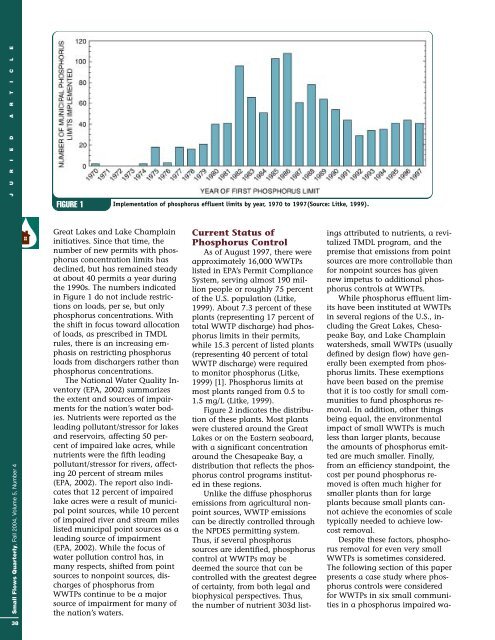
FIGURE 1<br />
Implementation of phosphorus effluent limits by year, 1970 to 1997(Source: Litke, 1999).<br />
Small Flows Quarterly, Fall 2004, Volume 5, Number 4<br />
Great Lakes and Lake Champlain<br />
initiatives. Since that time, the<br />
number of new permits with phosphorus<br />
concentration limits has<br />
declined, but has remained steady<br />
at about 40 permits a year during<br />
the 1990s. The numbers indicated<br />
in Figure 1 do not include restrictions<br />
on loads, per se, but only<br />
phosphorus concentrations. With<br />
the shift in focus toward allocation<br />
of loads, as prescribed in TMDL<br />
rules, there is an increasing emphasis<br />
on restricting phosphorus<br />
loads from dischargers rather than<br />
phosphorus concentrations.<br />
The <strong>National</strong> Water Quality Inventory<br />
(EPA, 2002) summarizes<br />
the extent and sources of impairments<br />
for the nation’s water bodies.<br />
Nutrients were reported as the<br />
leading pollutant/stressor for lakes<br />
and reservoirs, affecting 50 percent<br />
of impaired lake acres, while<br />
nutrients were the fifth leading<br />
pollutant/stressor for rivers, affecting<br />
20 percent of stream miles<br />
(EPA, 2002). The report also indicates<br />
that 12 percent of impaired<br />
lake acres were a result of municipal<br />
point sources, while 10 percent<br />
of impaired river and stream miles<br />
listed municipal point sources as a<br />
leading source of impairment<br />
(EPA, 2002). While the focus of<br />
water pollution control has, in<br />
many respects, shifted from point<br />
sources to nonpoint sources, discharges<br />
of phosphorus from<br />
WWTPs continue to be a major<br />
source of impairment for many of<br />
the nation’s waters.<br />
Current Status of<br />
Phosphorus Control<br />
As of August 1997, there were<br />
approximately 16,000 WWTPs<br />
listed in EPA’s Permit Compliance<br />
System, serving almost 190 million<br />
people or roughly 75 percent<br />
of the U.S. population (Litke,<br />
1999). About 7.3 percent of these<br />
plants (representing 17 percent of<br />
total WWTP discharge) had phosphorus<br />
limits in their permits,<br />
while 15.3 percent of listed plants<br />
(representing 40 percent of total<br />
WWTP discharge) were required<br />
to monitor phosphorus (Litke,<br />
1999) [1]. Phosphorus limits at<br />
most plants ranged from 0.5 to<br />
1.5 mg/L (Litke, 1999).<br />
Figure 2 indicates the distribution<br />
of these plants. Most plants<br />
were clustered around the Great<br />
Lakes or on the Eastern seaboard,<br />
with a significant concentration<br />
around the Chesapeake Bay, a<br />
distribution that reflects the phosphorus<br />
control programs instituted<br />
in these regions.<br />
Unlike the diffuse phosphorus<br />
emissions from agricultural nonpoint<br />
sources, WWTP emissions<br />
can be directly controlled through<br />
the NPDES permitting system.<br />
Thus, if several phosphorus<br />
sources are identified, phosphorus<br />
control at WWTPs may be<br />
deemed the source that can be<br />
controlled with the greatest degree<br />
of certainty, from both legal and<br />
biophysical perspectives. Thus,<br />
the number of nutrient 303d list-<br />
ings attributed to nutrients, a revitalized<br />
TMDL program, and the<br />
premise that emissions from point<br />
sources are more controllable than<br />
for nonpoint sources has given<br />
new impetus to additional phosphorus<br />
controls at WWTPs.<br />
While phosphorus effluent limits<br />
have been instituted at WWTPs<br />
in several regions of the U.S., including<br />
the Great Lakes, Chesapeake<br />
Bay, and Lake Champlain<br />
watersheds, small WWTPs (usually<br />
defined by design flow) have generally<br />
been exempted from phosphorus<br />
limits. These exemptions<br />
have been based on the premise<br />
that it is too costly for small communities<br />
to fund phosphorus removal.<br />
In addition, other things<br />
being equal, the environmental<br />
impact of small WWTPs is much<br />
less than larger plants, because<br />
the amounts of phosphorus emitted<br />
are much smaller. Finally,<br />
from an efficiency standpoint, the<br />
cost per pound phosphorus removed<br />
is often much higher for<br />
smaller plants than for large<br />
plants because small plants cannot<br />
achieve the economies of scale<br />
typically needed to achieve lowcost<br />
removal.<br />
Despite these factors, phosphorus<br />
removal for even very small<br />
WWTPs is sometimes considered.<br />
The following section of this paper<br />
presents a case study where phosphorus<br />
controls were considered<br />
for WWTPs in six small communities<br />
in a phosphorus impaired wa-<br />
38