

MDG Midterm Report: The case of Ifugao - Social Watch
MDG Midterm Report: The case of Ifugao - Social Watch
MDG Midterm Report: The case of Ifugao - Social Watch

Create successful ePaper yourself
Turn your PDF publications into a flip-book with our unique Google optimized e-Paper software.
Missing Targets: An alternative <strong>MDG</strong> midterm report<br />
<strong>MDG</strong> MIDTERM REPORT:<br />
<strong>The</strong> <strong>case</strong> <strong>of</strong> <strong>Ifugao</strong>*<br />
By Shubert l. ciencia**<br />
Introduction<br />
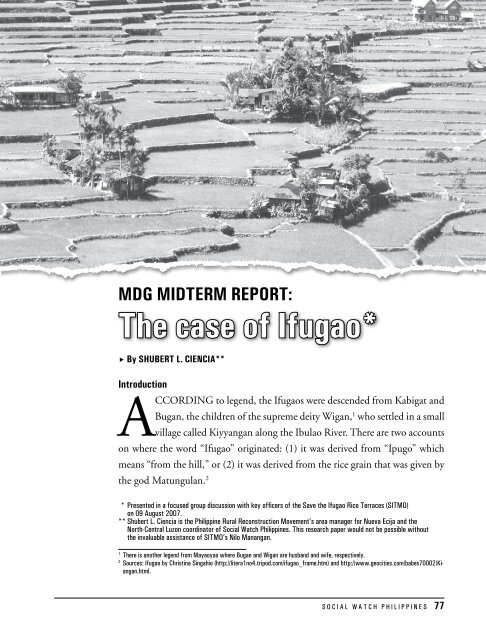
ACCORDING to legend, the <strong>Ifugao</strong>s were descended from Kabigat and<br />
Bugan, the children <strong>of</strong> the supreme deity Wigan, 1 who settled in a small<br />
village called Kiyyangan along the Ibulao River. <strong>The</strong>re are two accounts<br />
on where the word “<strong>Ifugao</strong>” originated: (1) it was derived from “Ipugo” which<br />
means “from the hill,” or (2) it was derived from the rice grain that was given by<br />
the god Matungulan. 2<br />
* Presented in a focused group discussion with key <strong>of</strong>ficers <strong>of</strong> the Save the <strong>Ifugao</strong> Rice Terraces (SITMO)<br />
on 09 August 2007.<br />
** Shubert L. Ciencia is the Philippine Rural Reconstruction Movement’s area manager for Nueva Ecija and the<br />
North-Central Luzon coordinator <strong>of</strong> <strong>Social</strong> <strong>Watch</strong> Philippines. This research paper would not be possible without<br />
the invaluable assistance <strong>of</strong> SITMO’s Nilo Manangan.<br />
1<br />
<strong>The</strong>re is another legend from Mayaoyao where Bugan and Wigan are husband and wife, respectively.<br />
2<br />
Sources: <strong>Ifugao</strong> by Christina Singahio (http://litera1no4.tripod.com/ifugao_frame.htm) and http://www.geocities.com/babes70002/Kiangan.html.<br />
S O C I A L W A T C H P H I L I P P I N E S 77
Missing Targets: An alternative <strong>MDG</strong> midterm report<br />
Present-day <strong>Ifugao</strong> province’s story, however,<br />
began with the establishment in 1889 <strong>of</strong> the Commandancia<br />
Politico-Militar de Quingan by the<br />
Spanish colonial government as a means <strong>of</strong> subduing<br />
the <strong>Ifugao</strong>s and placing them under Spanish rule.<br />
During the American colonial period, <strong>Ifugao</strong> was a<br />
subprovince <strong>of</strong> Nueva Vizcaya from 1902 until 1905<br />
before being integrated as yet another subprovince in<br />
1906 <strong>of</strong> the newly-created Mt. Province. On June 18,<br />
1966, <strong>Ifugao</strong> finally became a province by virtue <strong>of</strong><br />
Republic Act 4695 which is known as the “Division<br />
Law <strong>of</strong> Mt. Province.” 3<br />
<strong>Ifugao</strong> remained until 2003 to be one <strong>of</strong> the<br />
Philippines’ poorest provinces, the poorest in Northern<br />
Luzon, and the poorest among the four Luzon provinces<br />
(after Camarines Norte, Occidental Mindoro<br />
and Marinduque) in the list <strong>of</strong> the top 15 poorest<br />
provinces. 4<br />
As such, it becomes a logical and automatic priority<br />
for <strong>MDG</strong>-related projects.<br />
<strong>Ifugao</strong> as once the poorest province <strong>of</strong> the<br />
Northern Luzon area will be the <strong>case</strong> in point for<br />
this review. <strong>The</strong> methodology will be simple: review<br />
what has changed between 2000 and 2007,<br />
evaluate key efforts from both the national and<br />
local governments, look at civil society initiatives,<br />
and formulate conclusions and recommendations.<br />
Local data will be mostly referred to in order to help<br />
pinpoint the realities that are <strong>of</strong>ten glossed over by<br />
national statistics.<br />
Assessment <strong>of</strong> status and progress<br />
Poverty and hunger<br />
A comparison <strong>of</strong> data from the 2000 and 2007 <strong>Ifugao</strong><br />
Provincial Socioeconomic Pr<strong>of</strong>iles (SEP) has shown<br />
a remarkable decrease in poverty incidence among<br />
families from 74.60 percent in 1991 to 28.10 percent<br />
in 2003. This is further illustrated in the decrease in<br />
the number <strong>of</strong> families below the poverty threshold 5<br />
from 17,423 in 1997 to 9,069 in 2003, in the income<br />
gap 6 from 39.00 percent in 1997 to 27.20 percent in<br />
Table1: Comparison <strong>of</strong> Selected Poverty Indicators<br />
Base<br />
Years<br />
Poverty<br />
Incidence Income Gap Poverty Gap<br />
1991 74.60 n/a n/a<br />
1994 72.10 n/a n/a<br />
1997 61.00 39.00 22.35<br />
2000 55.57 33.00 18.24<br />
2003 28.10 27.20 7.60<br />
Source: 2000 and 2007 <strong>Ifugao</strong> Socioeconomic Pr<strong>of</strong>iles<br />
Table2: Comparison <strong>of</strong> Nutritional Status <strong>of</strong> Pre<br />
and Elementary School Children<br />
1 st -3 rd<br />
Degree<br />
2000 SY 2005-2006<br />
2 nd & 3 rd<br />
Degrees<br />
Below<br />
Normal BNVL BNL<br />
Preschool Children (0-6 Years Old/0-71 Months Old)<br />
97 1,562<br />
20.89 3.23 7.42 <strong>case</strong>s <strong>case</strong>s<br />
Elementary School Children<br />
18.62 5.03 8.77 n/a n/a<br />
Source: 2000 and 2007 <strong>Ifugao</strong> Socioeconomic Pr<strong>of</strong>iles<br />
2003, and in the poverty gap 7 from 22.35 percent in<br />
1997 to 7.60 percent in 2003.<br />
In terms <strong>of</strong> nutrition, 20.89 percent <strong>of</strong> preschoolers<br />
(i.e. 0-6 years old) weighed in 2000 were malnourished<br />
although only 3.23 percent belonged to the<br />
2nd- and 3rd-degree categories; the rest or 4,170 are<br />
mildly malnourished. Elementary school children also<br />
registered an 18.62-percent malnourishment rate in the<br />
same year—where 5.03 percent is 2nd and 3rd- degree<br />
malnourished while 3,946 are mildly malnourished.<br />
In 2006, the malnourishment rate for preschoolers<br />
(i.e. 0-71 months old) using the International Reference<br />
Standard (IRS) is 7.42 percent where there are<br />
97 in the Below Normal Very Low (BNVL) category<br />
and 1,562 in the Below Normal Low (BNL) category.<br />
On the other hand, 8.77 percent <strong>of</strong> elementary schoolchildren<br />
from School Year 2005-2006 are below the<br />
normal weight.<br />
3<br />
Draft 2007 <strong>Ifugao</strong> Socio-economic Pr<strong>of</strong>ile, pages 1-4 (<strong>Ifugao</strong> Provincial Government).<br />
4<br />
A Civil Society Perspective: Reviewing Progress on the <strong>MDG</strong>s, powerpoint presentation (<strong>Social</strong> <strong>Watch</strong> Philippines, no date listed).<br />
5<br />
Defined in the 2007 <strong>Ifugao</strong> Sep as “individuals and families whose incomes fall below the <strong>of</strong>ficial poverty threshold as defined by the government and/or cannot<br />
afford to provide in a sustained manner for their minimum basic needs for food, heslth, education, housing, and other social amenities <strong>of</strong> life”.<br />
6<br />
Defined in the 2007 <strong>Ifugao</strong>SEP as “the average income shortfall (expressed in proportion to the poverty line) <strong>of</strong> those below the poverty threshold”<br />
7<br />
Defined in the 2007 <strong>Ifugao</strong> SEP as “the income shortfall (expressed in proportion to the poverty line) <strong>of</strong> those with income below the poverty line over the whole<br />
population”.<br />
8<br />
2000 <strong>Ifugao</strong> Socio-economic Pr<strong>of</strong>ile, page 55.<br />
78 S O C I A L W A T C H P H I L I P P I N E S
Missing Targets: An alternative <strong>MDG</strong> midterm report<br />
Education and gender equality<br />
It is difficult to exactly pinpoint the performance<br />
<strong>of</strong> primary education in <strong>Ifugao</strong> because <strong>of</strong> the lack <strong>of</strong> a<br />
matching data set between 2000 and 2007. It is, however,<br />
possible to establish a partial trend in elementary<br />
survival rate by comparing the 31,155 total elementary<br />
school enrolment to the 11,595 total secondary school<br />
enrolment <strong>of</strong> SY 2000-2001 8 which indicates a possible<br />
37.21-percent elementary education completion rate;<br />
and the 29,213 total elementary school enrolment to<br />
the 13,704 total secondary school enrolment <strong>of</strong> SY<br />
2005-2006 9 showing a possible and higher 46.91-percent<br />
elementary completion rate—which is close to the<br />
school year’s cohort survival rate <strong>of</strong> 50.78 percent. 10<br />
<strong>The</strong>se partial trends may indicate a downward<br />
slant in elementary enrolment (i.e. 31,155 enrollees<br />
in SY 2000-2001 versus 29,213 enrollees in SY 2005-<br />
2006) and improvement in the cohort survival rate<br />
(i.e., 37.21-percent possible completion rate <strong>of</strong> SY<br />
2000-2001 versus 46.91-percent possible completion<br />
rate <strong>of</strong> SY 2005-2006 plus the school year’s 50.78-percent<br />
cohort survival rate). A comparison between SY<br />
2004-2005’s 55.57-percent elementary achievement<br />
rate with SY 2005-2006’s 62.79 11 percent also suggests<br />
an upward trend.<br />
<strong>The</strong>re are also no data in the <strong>Ifugao</strong> SEPs about<br />
promoting gender equality, but a comparison <strong>of</strong> the<br />
elementary female pupils’ enrollment status <strong>of</strong> 13,726<br />
in SY 2004-2005 with the 14,118 12 <strong>of</strong> SY 2006-2007<br />
suggests an increasing number <strong>of</strong> female enrollees.<br />
<strong>The</strong> female cohort survival rate <strong>of</strong> 65.46 percent <strong>of</strong> SY<br />
2006-2007 is also higher than the male cohort survival<br />
rate <strong>of</strong> 43.87 percent.<br />
Health<br />
A remarkable improvement in infant mortality rate<br />
(IMR) was registered in <strong>Ifugao</strong> from 17.39 per thousand<br />
live births in 1999 to 9.66 in year 2006. However,<br />
a slow and fluctuating increase is observed in the crude<br />
birth rate (CBR) at 22.88 per thousand population in<br />
year 1999 to 23.20 in year 2006; and crude death rate<br />
(CDR) per thousand population at 3.72 in year 2000<br />
to 3.86 in year 2006. It was also observed that low birth<br />
Table 3: Comparison <strong>of</strong> Vital Health Indicators<br />
Base<br />
Year<br />
Infant<br />
Mortality<br />
Rate<br />
Crude<br />
Birth<br />
Rate<br />
Crude<br />
Death<br />
Rate<br />
Maternal<br />
Mortality<br />
Rate<br />
1999 17.39 22.88 3.72 1.07<br />
2000 18.08 24.19 3.52 1.73<br />
2001 14.38 23.66 3.98 2.62<br />
2002 8.74 23.35 4.02 0.26<br />
2003 12.78 22.81 3.73 0.26<br />
2004 12.68 24.19 3.44 0.48<br />
2005 9.02 21.46 3.62 0.53<br />
2006 9.66 23.20 3.86 1.20<br />
Source: 2007 <strong>Ifugao</strong> Socio-Economic Pr<strong>of</strong>ile<br />
Table 4: Comparison <strong>of</strong> Government Health<br />
Personnel Ratio to Population<br />
Indicators 2000 Ratio 2006 Ratio<br />
Physicians 1:5,573 1:16,228<br />
Nurses 1:2,099 1:16,228<br />
Midwives 1:1,405 1:1,700<br />
Dentists 1:40,406 1:29,757<br />
Rural Sanitary Inspectors 1:13,469 1:17,854<br />
Medical Technologists 1:11,545 1:11,903<br />
Dietician/Nutritionists 1:80,812 1:178,540<br />
Health Educators 1:161,623 1:178,540<br />
Source: 2000 and 2007 <strong>Ifugao</strong> Socio-Economic Pr<strong>of</strong>iles<br />
weight among newborns significantly increased from<br />
6.18 percent in 2005 to 33.70 in 2006. 13<br />
<strong>The</strong> maternal mortality rate (MMR) per thousand<br />
live births also increased from 1.07 in 1999 to 2.62 in<br />
2001, then steeply plunging to 0.26 in 2002 and 2003,<br />
before slowly abut steadily climbing to 1.20 by 2006.<br />
<strong>The</strong>re is also a steady decrease in the number <strong>of</strong> current<br />
contraceptive users from 9,402 in 2001 to 7,894<br />
in 2006—resulting in the decrease in the contraceptive<br />
prevalence rate (CPR) from 47.76 percent in 2001 to<br />
43.92 percent in 2006. 14<br />
A comparison <strong>of</strong> data between the 2000 and<br />
2007 <strong>Ifugao</strong> SEPs showed that the population ratio<br />
to health personnel (i.e. physicians, nurses, midwives,<br />
9<br />
2007 <strong>Ifugao</strong> Socio-economic Pr<strong>of</strong>ile, page 74.<br />
10<br />
Ibid, page 67.<br />
11<br />
Ibid, page 69.<br />
12<br />
Ibid, page 74.<br />
13<br />
Ibid, page 100.<br />
14<br />
Ibid, page 101.<br />
S O C I A L W A T C H P H I L I P P I N E S 79
Missing Targets: An alternative <strong>MDG</strong> midterm report<br />
rural sanitary inspectors, medical technologists, dietician/nutritionists,<br />
health educators) has substantially<br />
increased except that for dentists which has significantly<br />
decreased.<br />
In 2006, the top 5 leading causes <strong>of</strong> morbidity are<br />
ALRTI/pneumonia, bronchitis, acute watery diarrhea,<br />
hypertension/myocardial infarction/cardiovascular<br />
disease, and influenza.<br />
<strong>The</strong> top 5 leading causes <strong>of</strong> mortality are pneumonia,<br />
hypertension/myocardial infarction/cardio vascular<br />
disease, bleeding peptic ulcer, cancer (all forms), and<br />
accident (all forms). 15 This indicates that malaria and<br />
tuberculosis, once the scourge <strong>of</strong> remote upland rural<br />
areas like <strong>Ifugao</strong>, are no longer prevalent and threatening.<br />
<strong>The</strong>re are no reported incidences <strong>of</strong> HIV/AIDS<br />
<strong>case</strong>s in <strong>Ifugao</strong>.<br />
Environment<br />
Both the 2000 and 2007 <strong>Ifugao</strong> SEPs did not report<br />
on the environmental condition <strong>of</strong> the province.<br />
Data on existing land use which could have provided a<br />
land use trend (e.g. increasing agricultural, residential<br />
and commercial areas versus decreasing woodland and<br />
increasing grassland/shrubland) has not been updated<br />
since 1988. However, the condition <strong>of</strong> <strong>Ifugao</strong>’s most<br />
valuable possession—the world- famous rice terraces—can<br />
provide a glimpse <strong>of</strong> how the environment<br />
is faring in the province.<br />
Dating back to 1,000 BC, the <strong>Ifugao</strong> rice terraces<br />
is a complex system <strong>of</strong> interconnected ecosystems,<br />
architecture, and spirituality. It was inscribed in the<br />
Unesco World Heritage Site List in 1995 because<br />
<strong>of</strong> its outstanding universal value as a living cultural<br />
landscape. However, the low productivity level <strong>of</strong> the<br />
terraces and agriculture in general has encouraged <strong>Ifugao</strong><br />
farmers to abandon their rice terraces that are now<br />
being converted into other uses. Today, around 25 to<br />
30 percent <strong>of</strong> the rice terraces have been abandoned,<br />
and only half <strong>of</strong> its 15,000 hectares <strong>of</strong> total land area<br />
more than 50 years ago remain. 16<br />
<strong>The</strong> 2007 <strong>Ifugao</strong> SEP, citing the result report <strong>of</strong> a<br />
Population and Housing survey in 2000, also reported<br />
that most <strong>Ifugao</strong>s have and own their houses. 17<br />
Partnerships and ODA<br />
In 1989, the European Union (EU)-supported<br />
integrated rural development project called Central<br />
Cordillera Agricultural Program (Cecap) was launched<br />
in the Cordillera provinces <strong>of</strong> <strong>Ifugao</strong>, Mt. Province,<br />
Kalinga and Abra. Cecap’s main objective is to provide<br />
assistance in raising local incomes and living standards<br />
in the 25 municipalities, 341 barangays and 49,000<br />
households. <strong>The</strong> 27.5-million- Euro, 2-phased project<br />
that ended in 2003 has six components: agricultural<br />
Table 5: Summary <strong>of</strong> Cecap-Supported Projects in <strong>Ifugao</strong><br />
Number Of Micro-Projects<br />
Project Areas Agriculture NRM Infrastructure Marketing RF ID Cost (in pesos)<br />
Asipulo 45 19 10 5 4 17 16,277,666.00<br />
Aguinaldo 28 19 16 8 6 9 20,234,769.00<br />
Banaue 30 17 13 2 13 13 13,807,112.30<br />
Hingyon 42 18 9 2 8 10 14,422,585.00<br />
Hungduan 23 12 13 3 10 12 10,586,006.00<br />
Kiangan 45 18 6 6 8 13 14,443,398.52<br />
Lagawe 30 16 11 3 9 14 5,482,680.03<br />
Lamut 23 11 6 2 7 8 7,891,053.00<br />
Mayoyao 29 22 18 3 9 14 11,845,810.18<br />
Tinoc 20 18 13 6 5 18 18,734,170.15<br />
TOTAL 313 171 113 40 83 159 133,725,250.18<br />
15<br />
Ibid, pages 94-95.<br />
16<br />
“Fighting Back: Citizen’s Response to Development Aggression” in “Race for Survival: Hurdles on the Road to Meeting the <strong>MDG</strong>s in 2015”, pages 44-45<br />
(Shubert L. Ciencia, 2005).<br />
17<br />
2007 <strong>Ifugao</strong> Socio-economic Pr<strong>of</strong>ile, page 115.<br />
80 S O C I A L W A T C H P H I L I P P I N E S
Missing Targets: An alternative <strong>MDG</strong> midterm report<br />
development, natural resource management,<br />
marketing assistance, infrastructure development,<br />
rural financing and institutional<br />
development. 18<br />
Fo r I f u g a o a l o n e , a t o t a l o f<br />
P133,725,250.18 was spent on 879 microprojects<br />
from July 1996 to June 2003 in<br />
10 <strong>of</strong> <strong>Ifugao</strong>’s 11 municipalities. In 1997,<br />
the poverty incidence in <strong>Ifugao</strong> was at 61<br />
percent. It stood at 28.10 percent after the<br />
Cecap ended in 2003.<br />
Another major ODA-supported project<br />
in the province is the <strong>Ifugao</strong> Rural Water<br />
Supply and Sanitation Project that was<br />
spearheaded by the DILG and supported by<br />
the GTZ. <strong>The</strong> project aims to provide safe<br />
water in selected pilot areas in <strong>Ifugao</strong> from<br />
2000 to 2004. As <strong>of</strong> 2003, the project was<br />
able to build three water supply systems in Hungduan,<br />
Lagawe and Tinoc; two almost completed in Asipulo<br />
and Mayoyao; and three starting in Hungduan, Mayoyao<br />
and Tinoc. 19<br />
Government programs<br />
From 2002 to 2006, the <strong>Ifugao</strong> provincial government<br />
initiated a poverty alleviation program called the<br />
Health and Nutrition Status and Improvement-Poverty<br />
Alleviation Program (Hensi-PAP). <strong>The</strong> project was<br />
implemented in 23 most nutritionally and economically-depressed<br />
barangays across <strong>Ifugao</strong>. It has three<br />
components: health and nutrition, livelihood and<br />
income improvement, and institutional development<br />
and support services. 20<br />
<strong>The</strong> project was implemented with a total cost <strong>of</strong><br />
P2,707,096 mostly from the provincial government.<br />
Since 2000, Hensi-PAP is the most <strong>MDG</strong>-sensitive<br />
project undertaken by the <strong>Ifugao</strong> provincial government.<br />
It featured two key innovations: the use <strong>of</strong><br />
the convergence approach to bring together all the<br />
stakeholders, and the institutionalization <strong>of</strong> the project<br />
in the barangay development plans to ensure sustainability.<br />
21<br />
CSO initiatives<br />
<strong>The</strong> Save the <strong>Ifugao</strong> Terraces Movement<br />
(Sitmo) was organized in 2000 by the Philippine<br />
Rural Reconstruction Movement to advocate for the<br />
rehabilitation and protection <strong>of</strong> the <strong>Ifugao</strong> rice terraces<br />
by improving the quality <strong>of</strong> life <strong>of</strong> <strong>Ifugao</strong> farmers<br />
through a sustainable development approach, and<br />
linking with national and international support institutions<br />
and networks. 22 Among its trailblazing projects<br />
are on renewable energy: it won an International Ashden<br />
Award for Renewable Energy in July 2005; and<br />
saving the rice terraces through sustainable agriculture,<br />
which won a grand prize in the 2006 Panibagong<br />
Paraan Development Innovation Marketplace. Sitmo<br />
also develops and implements community-based<br />
models on natural resource management, livelihood<br />
development, indigenous knowledge transmission and<br />
land use mapping. 23<br />
Another pioneering Sitmo initiative is ecocultural<br />
tourism that <strong>of</strong>fers an alternative tourism package<br />
for the purpose <strong>of</strong> providing supplemental income to<br />
host communities, while promoting a deeper appreciation<br />
<strong>of</strong> the rich <strong>Ifugao</strong> heritage through community<br />
18<br />
Final <strong>Report</strong> to the Central Cordillera Public, pages 6-7 (CECAP, no date listed).<br />
19<br />
Program Assessment and Plan <strong>of</strong> Operation Workshop (DILG-GTZ Water Program, 16-18 September 2004).<br />
20<br />
HENSI-PAP Completion <strong>Report</strong> (Powerpoint presentation, June 2006).<br />
21<br />
HENSI-PAP Completion <strong>Report</strong> (Powerpoint presentation, no date listed).<br />
22<br />
Kiphodan di Payo, Kiphodan di Muyong (SITMO, October 2006).<br />
23<br />
3rd SITMO General Conference (Powerpoint presentation, 26 July 2006).<br />
S O C I A L W A T C H P H I L I P P I N E S 81
Missing Targets: An alternative <strong>MDG</strong> midterm report<br />
immersions. 24 Sitmo also operates a community<br />
e-center and is an active advocate <strong>of</strong> the Globally<br />
important Ingenious Agricultural Heritage Systems<br />
(GIAHS) and the <strong>MDG</strong>s.<br />
Analysis and conclusion<br />
In 2003, <strong>Ifugao</strong> along with six other provinces<br />
finally graduated from the list <strong>of</strong> the country’s top 10<br />
poorest provinces, according to the National Statistical<br />
Coordination Board (NSCB). It is indeed a moment<br />
for celebration for a province where almost 75 percent<br />
<strong>of</strong> the population was impoverished 12 years earlier.<br />
However, a closer look at this amazing run will show<br />
that this might be just a bubble that could burst at<br />
any time.<br />
Table 6: Comparison Income, Investments<br />
and Employment<br />
Base Year Total Investments Total Employment<br />
1998-2000 322,350,000 25 4,533<br />
2000 n/a n/a<br />
2001 n/a n/a<br />
2002 n/a n/a<br />
2003 n/a n/a<br />
2004 161,252,298 1,471<br />
2005 146,568,739 1,143<br />
2006 165,539,270 827<br />
Source: 2000 and 2007 <strong>Ifugao</strong> Socioeconomic Pr<strong>of</strong>iles<br />
Table 6 shows that although investments increased<br />
in <strong>Ifugao</strong> by 58 percent in 2006 since the 1998-2000<br />
period, 26 the employment rate ironically decreased by<br />
45 percent. It is important to note that 77 percent <strong>of</strong><br />
the total investments from the 1998-2000 27 and 2004-<br />
2006 period are from trading and services 28 which<br />
indicates that money may actually be flowing out <strong>of</strong> the<br />
province and may be the reason for the decrease in the<br />
employment rate. In fact, for the 2004-2006 period,<br />
the second most-invested area is construction services<br />
which accounts for 12 percent <strong>of</strong> the total. 29<br />
<strong>The</strong> fact is there is hardly any investment in the<br />
sectors that matters most like agri-based production and<br />
enterprises, where 14,816 <strong>of</strong> 18,475 families 30 depend<br />
for their main source <strong>of</strong> income. <strong>The</strong> province’s 2002<br />
and 2007 socioeconomic pr<strong>of</strong>ile also reported tourist<br />
arrivals rising from 49,441 in 2000 to 90,874 in 2005;<br />
but it failed to indicate actual investments placed in this<br />
sector which could be an epicenter <strong>of</strong> local economic<br />
development. As host <strong>of</strong> the fabled rice terraces and<br />
the watershed <strong>of</strong> a major river system, the significance<br />
<strong>of</strong> <strong>Ifugao</strong>’s natural and cultural resources should be<br />
seriously considered in both local and national development<br />
plans.<br />
<strong>The</strong> decreasing trend in malnourishment and the<br />
increasing elementary school enrolment and cohort<br />
survival rates are laudable and encouraging. On the<br />
other hand, the increasing trend in maternal deaths 31 is<br />
alarming and might be linked to the steady decrease in<br />
the CPR from 47.76 percent in 2001 to 36.85 percent<br />
in 2006. 32<br />
Certainly, it was the huge amount <strong>of</strong> ODA<br />
money infused in <strong>Ifugao</strong> that has mainly fueled the<br />
growth in the province. But aid money will not last<br />
forever and at this time, the fluctuating economic<br />
and social indicators might signal the tapering <strong>of</strong>f<br />
<strong>of</strong> the effect. Mechanisms for strategic sustainability<br />
must therefore be installed for the long haul. And<br />
<strong>Ifugao</strong> is not lacking in these. Sitmo’s innovative<br />
models on community development are inspiring.<br />
Much can be learned too and replicated from the<br />
Hensi-PAP experience, which might have generated<br />
more impact had it been sustained and expanded<br />
beyond the term limits <strong>of</strong> local politicians. And<br />
there is definitely something to be built on from the<br />
Cecap project. <strong>The</strong> challenge is building on these<br />
best practices.<br />
<strong>The</strong> way forward then is graduating from the<br />
bubble into sustainable development and staying that<br />
way, and addressing the remaining 28.10 percent <strong>of</strong><br />
24<br />
SITMO’s Eco-cultural Tourism (undated brochure).<br />
25<br />
<strong>The</strong> total investment for the cited period equally divided be P107,450,000 generating employment for 1,511 persons every year.<br />
26<br />
2002 <strong>Ifugao</strong> Socio-economic Pr<strong>of</strong>ile, page 45.<br />
27<br />
Ibid.<br />
28<br />
2007 <strong>Ifugao</strong> Socio-economic Pr<strong>of</strong>ile, page 58.<br />
29<br />
Ibid.<br />
30<br />
Ibid, pages 41-42.<br />
31<br />
Ibid, page 92.<br />
32<br />
Ibid, page 101.<br />
82 S O C I A L W A T C H P H I L I P P I N E S
Missing Targets: An alternative <strong>MDG</strong> midterm report<br />
the population still mired in poverty. But eradicating<br />
poverty and staying out <strong>of</strong> it requires resources. This is<br />
a big challenge for a province that is 95-percent dependent<br />
on its Internal Revenue Allocation. 33<br />
Recommendations<br />
Based on the current state <strong>of</strong> realizing the <strong>MDG</strong>s<br />
in <strong>Ifugao</strong>, this paper presents the following recommendations:<br />
Tracking and doing development. It is necessary<br />
at this time to take stock <strong>of</strong> the present to be able<br />
to determine the future. A comprehensive data base<br />
will be helpful in pinpointing where things stand at<br />
the moment; what are the specific gaps, how much<br />
is needed for these, and where to get the resources<br />
required. A solid information base can also facilitate<br />
the formulation <strong>of</strong> area-specific interventions in<br />
the Hensi-PAP mode, and measuring how progress<br />
is being made from these interventions. Parallel<br />
to this will be a capacity-development process on<br />
data base management, project development and<br />
social marketing, and project management for the<br />
implementers.<br />
Attracting momentum-sustaining investments.<br />
<strong>Ifugao</strong> must break through beyond being largely IRAdependent<br />
to be able to sustain what seemed to be<br />
an ODA-driven momentum. Sure, ODA funds can<br />
help but these are mostly for start-ups. A campaign<br />
to attract the right and hard investments, focusing on<br />
stimulating the local economy and local growth, will<br />
be timely. Since majority <strong>of</strong> <strong>Ifugao</strong> families depend<br />
on agriculture as their main source <strong>of</strong> income, these<br />
investments should logically add value to the province’s<br />
agricultural production and the tourism sector, too. It is<br />
noted in this paper that the number <strong>of</strong> idle agricultural<br />
lands is increasing. 34<br />
Maximizing the convergence approach. Limited<br />
resources from the local government units can only<br />
do so much. <strong>The</strong> development and expansion <strong>of</strong> community-based<br />
systems, especially in the health sector,<br />
can complement government services as illustrated by<br />
the Hensi-PAP experience.<br />
Strengthening CSO participation. As always,<br />
participation must always be encouraged specially<br />
from the primary stakeholders. <strong>The</strong> lesson from nearby<br />
Nueva Vizcaya’s experience also shows that drawing in,<br />
expanding and maximizing CSO participation in local<br />
development can transcend the political dynamics<br />
<strong>of</strong> local governments. <strong>The</strong>y can also be effective (and<br />
sometimes pesky) advocates.<br />
<strong>The</strong> Cordillera context<br />
<strong>The</strong> Cordillera Administrative Region (CAR) is<br />
composed <strong>of</strong> the provinces <strong>of</strong> Abra, Benguet, Kalinga,<br />
Apayao, <strong>Ifugao</strong> and Mt. Province with Baguio City as<br />
the regional capital. It is the Philippines’ only landlocked<br />
region and covers one-sixth <strong>of</strong> the whole Luzon<br />
island. It has a population <strong>of</strong> around 1.1 million mostly<br />
from the following indigenous ethnolinguistic groups:<br />
Table 7: Comparison <strong>of</strong> CAR Poverty Incidence<br />
Between 1997 and 2003<br />
Poverty Incidence 2003 Hdi<br />
Province<br />
1997 2003 Rank<br />
Benguet 19.7 12.3 1<br />
Abra 22.0 13.4 22<br />
<strong>Ifugao</strong> 31.3 10.9 24<br />
Kalinga 16.3 18.5 39<br />
Mt. Province 31.4 33.1 40<br />
Apayao 19.7 1.2 43<br />
Source: NSCB<br />
Kalinga, Isneg, Tingguian, Bontoc, Kankanaey, Ibaloi<br />
and <strong>Ifugao</strong>.<br />
Except for Kalinga and the Mt. Province, all CAR<br />
provinces registered an improvement in their respective<br />
poverty incidences since 1997. <strong>The</strong> Human Development<br />
Index (HDI), however, varies with Benguet at<br />
the top in the national hierarchy, Abra and <strong>Ifugao</strong><br />
in the upper bracket, and the rest in the middle-lower<br />
brackets. In 2000, four— Abra, <strong>Ifugao</strong>, Kalinga and<br />
Mt. Province 35 —<strong>of</strong> the five CAR provinces belonged<br />
to the 44 poorest provinces in the Philippines. But by<br />
2003, <strong>Ifugao</strong> had tremendously improved to 54th from<br />
4th in 2000 in the Philippine poverty hierarchy. Mt.<br />
Province, however, slipped to 8th in 2003 from 15th in<br />
2000 to represent CAR in the 10 poorest provinces club<br />
<strong>of</strong> the Philippines. <strong>The</strong> province, together with Biliran<br />
33<br />
Ibid, page 46.<br />
34<br />
Ibid, page 49.<br />
35<br />
NSCB <strong>Social</strong> Sectors B Division.<br />
S O C I A L W A T C H P H I L I P P I N E S 83
Missing Targets: An alternative <strong>MDG</strong> midterm report<br />
Table 8: Summary <strong>of</strong> CAR Performance on Health,<br />
Hunger, Poverty, Environment and Gender<br />
<strong>MDG</strong> Indicator<br />
Source: NSCB<br />
Prevalence<br />
(% Of<br />
Population)<br />
Rank<br />
Nationwide<br />
Poverty (2003) 31.2 11/17<br />
Malnutrition (2003) 16.3 17/17<br />
Maternal Deaths Rate (2005) 0.8 9-11/17<br />
Infants Death Rate (2005) 10.7 5/17<br />
Access to Safe Water (2005) 88.8 5/17<br />
(ranked 9th) and Masbate (ranked 3rd), are the only<br />
non-Mindanaoan provinces in the 2003 top ten. 36<br />
In the regional poverty hierarchy, CAR is ranked<br />
11th among the 17 regions and registered the least<br />
malnourishment rate. However, it is within the top 5<br />
in the infant death rate hierarchy and in the middle in<br />
the maternal death rate hierarchy. Like its HDI, the<br />
Quality <strong>of</strong> Life Index (QLI) among the CAR provinces<br />
also varies, with Benguet in the top 20 (0.81, ranked 8),<br />
Abra and Mt. Province in the top 20 (0.726/ranked 21<br />
and 0.691/ranked 26, respectively), <strong>Ifugao</strong> in the top 30<br />
(0.655, ranked 31), Apayao in the top (0.603, ranked<br />
45), and Kalinga in the top 50 (0.588, ranked 54). 37<br />
<strong>The</strong> varying degrees <strong>of</strong> the HDI and QLI among<br />
the CAR provinces show a skewed distribution <strong>of</strong><br />
wealth despite their relative contiguousness. This seems<br />
to favor provinces with highly urbanizing centers like<br />
Benguet which hosts Baguio City and the center <strong>of</strong> the<br />
region’s mining industry. Table 6 shows that poverty<br />
increases as one moves from the Benguet gateway into<br />
the “inner” provinces.<br />
In terms <strong>of</strong> natural resources, CAR is one <strong>of</strong> the<br />
richest regions in the Philippines and represents 11<br />
percent <strong>of</strong> the country’s agricultural land which produces<br />
60 percent <strong>of</strong> the country’s temperate vegetables.<br />
Around 80 percent <strong>of</strong> the total Philippine gold production<br />
is mined from the region’s mighty Cordillera<br />
mountain range which also serves as the headwaters <strong>of</strong><br />
Northern Luzon’s major river systems. <strong>The</strong> potential<br />
electrical capacity <strong>of</strong> these rivers is estimated to be at<br />
least 5 million kilowatts or 56 percent <strong>of</strong> the country’s<br />
total electric need.<br />
But like <strong>Ifugao</strong>, CAR has failed to capitalize on<br />
those resources. In fact, these resources are being siphoned<br />
out—as in the <strong>case</strong> <strong>of</strong> the mining companies<br />
that are mostly foreign-owned, and the hydroelectric<br />
dams that power Luzon’s cities and industries— at the<br />
cost <strong>of</strong> the environment and the region’s diverse cultural<br />
heritage. This irony is illustrated in the region’s l<strong>of</strong>ty<br />
rank in the poverty index (i.e. the 11th poorest or the<br />
7th richest among the 17 regions) but relatively low<br />
ranking <strong>of</strong> most <strong>of</strong> its province’s in terms <strong>of</strong> the HDI<br />
and QLI. •<br />
36<br />
NSCB.<br />
37<br />
Field Health Service Information System Annual <strong>Report</strong> 2005.<br />
84 S O C I A L W A T C H P H I L I P P I N E S


