Designing a Machine Translation System for Canadian Weather ...
Designing a Machine Translation System for Canadian Weather ...
Designing a Machine Translation System for Canadian Weather ...

You also want an ePaper? Increase the reach of your titles
YUMPU automatically turns print PDFs into web optimized ePapers that Google loves.
minima in the parameter space <strong>for</strong> the same tuning corpus. Although the tuning scores<br />
converge <strong>for</strong> a given configuration, the test scores are different between MERT tuning results.<br />
This phenomenon is illustrated in Figure 7, showing 5 different tuning runs, <strong>for</strong> the configuration<br />
French-to-English, integral, msd. While tuning does converge nicely to reach an average of BLEU<br />
= 74.7%, the test results (Figure 7’s legend) vary more significantly, with a mean BLEU score of<br />
76.7% (standard deviation of 0.4%). There<strong>for</strong>e, the standard deviation (in the <strong>for</strong>m of an error<br />
on the measure) factors in when comparing configurations.<br />
BLEU score (%)<br />
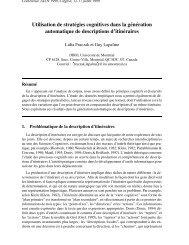
Figure 7 – MERT tuning results, <strong>for</strong> 5 different runs, <strong>for</strong> the configuration French-to-English, integral,<br />
msd. The progression of the tune score is shown with each iteration. While the tuning converges to an<br />
average of BLEU = 74.7%, the BLEU test results shown in parentheses vary more significantly, average<br />
BLEU = 76.7%, stdev = 0.4%. The number of MERT iterations needed varies between 6 and 17.<br />
<strong>Designing</strong> a <strong>Weather</strong> Warning <strong>Translation</strong> <strong>System</strong> 18<br />
75.0<br />
74.5<br />
74.6<br />
74.7<br />
74.7<br />
74.6<br />
74.8<br />
74.0<br />
run1 (Test: 77.1)<br />
73.5<br />
run2 (Test: 76.3)<br />
run3 (Test: 77.1)<br />
73.0<br />
run4 (Test: 77.0)<br />
72.5<br />
run5 (Test: 77.3)<br />
72.0<br />
1 2 3 4 5 6 7 8 9 10 11 12 13 14 15 16 17 18<br />
MERT tuning iteration<br />
Fig. 5. We MERT decided to tuning take this results, instability <strong>for</strong> into account five different by running runs, each MERT <strong>for</strong> optimization the configuration 5 times in French–<br />
to-English, order integral, to obtain msd. a mean The and progression standard deviation of on the the tune end BLEU score test isresults. shown The with comparison each iteration.<br />
While thebetween tuningconfigurations convergescan tothen an average be made on ofthe BLEU basis of = the 74.7%, BLEU score thebut BLEU also according test results to shown<br />
in parentheses vary more<br />
RALI <strong>Designing</strong> significantly, A <strong>Machine</strong> <strong>Translation</strong> average <strong>System</strong> BLEU For <strong>Canadian</strong> = 76.9%, <strong>Weather</strong> stdev Warnings = 0.4%. 17 The number<br />
of MERT iterations needed varies between 6 and 17 here.<br />
MERT tuning relies on a pseudo-random component and often finds different<br />
local minima in the parameter space <strong>for</strong> the same tuning corpus. Although the<br />
tuning scores converge <strong>for</strong> a given configuration, the test scores are different between<br />
MERT tuning results. This phenomenon is illustrated in Fig. 5, showing five<br />
different tuning runs, <strong>for</strong> the configuration French-to-English, integral, msd. While<br />
tuning does converge nicely to reach an average of BLEU = 74.7%, the test results<br />
(Fig. 5’s legend) vary more significantly, with a mean BLEU score of 76.9% (standard<br />
deviation of 0.4%). There<strong>for</strong>e, the standard deviation (in the <strong>for</strong>m of an error<br />
on the measure) must be factored in when comparing configurations.<br />
To compensate <strong>for</strong> optimizer instability when comparing experimental results,<br />
we took to heart some of the suggestions made by (Clark et al. 2011) and ran each<br />
MERT optimization five times in order to obtain a mean and standard deviation<br />
on the final BLEU test results. The comparison between configurations can then<br />
be made on the basis of the BLEU score but also according to potential error<br />
represented by the standard deviation. The test results measured with BLEU are<br />
shown in Fig. 6 when English is the source language and in Fig. 7 <strong>for</strong> French.<br />
For the English-to-French translation direction (Fig. 6), the BLEU score hovers<br />
around 78.5 when not using the maxdelta4 filtering, and 75 when using it. Clearly,<br />
the latter is too heavy-handed a technique and should be discarded. That being<br />
said, a BLEU score of 78.5 is very high <strong>for</strong> an MT task. Our results are comparable<br />
to those reported by (Langlais et al. 2005), <strong>for</strong> a similar task, where they obtained a<br />
BLEU score of 77% when translating severe storm warnings from English to French.<br />
On a more diverse warning corpus, however, this figure dropped to 58% in their<br />
study.<br />
When French is the source language (Fig. 7), the BLEU score is slightly lower,<br />
which is a bit surprising given the fact that the target language, i.e. English, is<br />
morphologically poorer. The BLEU score now peaks at 77.2% when discarding the<br />
clearly unusable maxdelta4 configurations. This time, even when taking the error