

The Ecology of San Francisco Bay Tidal Marshes - USGS National ...
The Ecology of San Francisco Bay Tidal Marshes - USGS National ...
The Ecology of San Francisco Bay Tidal Marshes - USGS National ...

Create successful ePaper yourself
Turn your PDF publications into a flip-book with our unique Google optimized e-Paper software.
Sacramento-<strong>San</strong> Joaqu i n river system, the<br />
local drainage system, and water users.<br />
Groundwater sources are mi nor due to the<br />
impermeable bay mud underlying most tidal<br />
marshes.<br />
<strong>The</strong> drainage basin <strong>of</strong> the <strong>San</strong><br />
<strong>Francisco</strong> <strong>Bay</strong> system covers over 40% <strong>of</strong><br />
the land area <strong>of</strong> California, or 163,000<br />
km2. Ninety percent <strong>of</strong> total surface flow<br />
enters the bay via the Sacramento and <strong>San</strong><br />
Joaquin Rivers. Outflow from these rivers<br />
into the bay is termed delta outflow because<br />
<strong>of</strong> the confluence and mixing <strong>of</strong> the<br />
two rivers within a low 1y1ng delta area<br />
immediately east <strong>of</strong> Suisun <strong>Bay</strong>.<br />
Historical ly, delta outflow has varied<br />
considerably due to yearly variations in<br />
rainfall and snow pack thickness. During<br />
one particularly wet year (1862), fresh<br />
water flowed outward through the Golden<br />
Gate for 10 consecutive days and during<br />
the draught <strong>of</strong> 1931, salt water extended<br />
almost to Sacramento. Present1 y, delta<br />
outflow is controlled by numerous dams and<br />
pumplng stations operated by state and<br />
federal agencies and can be esti mated with<br />
some precision (Conomos 1979).<br />
Between 1906-1977, total annual outflow<br />
has ranged between 7.7 x lo9 m3 to<br />
5.8 x 10l0 m3 with a median <strong>of</strong> 2.8 x 101°<br />
m3 (CSWRCB 1978). If flow were continuous,<br />
this would amount to a discharge <strong>of</strong><br />
approximatel y 880 m3/sec. <strong>The</strong> pronounced<br />
seasonal period <strong>of</strong> rainfall (snowfall at<br />
higher elevations) followed by dry weather<br />
creates a cyclic pattern <strong>of</strong> de1 ta outflow<br />
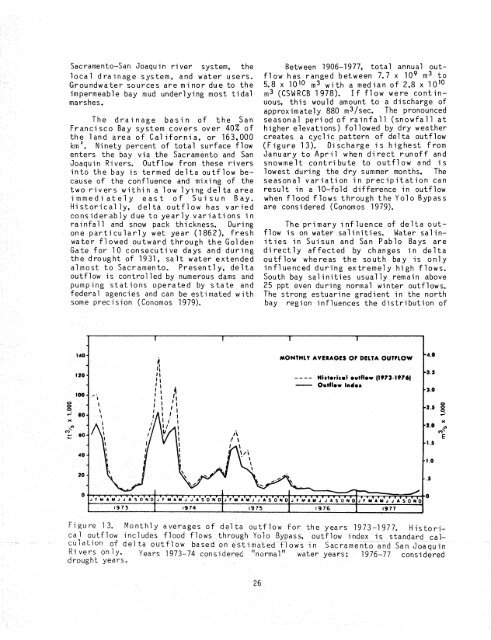
(Figure 13). Discharge is highest from<br />
January to April when direct run<strong>of</strong>f and<br />
snowmelt contribute to outflow and is<br />
lowest during the dry summer months. <strong>The</strong><br />
seasonal variation in precipitation can<br />
result in a 10-fold difference in outflow<br />
when flood flows through the Yolo Bypass<br />
are considered (Conomos 1979).<br />
<strong>The</strong> primary influence <strong>of</strong> delta outflow<br />
is on water salinities. Water salinities<br />
in Suisun and <strong>San</strong> Pablo <strong>Bay</strong>s are<br />
directly affected by changes in delta<br />
outflow whereas the south bay is only<br />
influenced during extreme1 y high flows.<br />
South bay salinities usually remain above<br />
25 ppt even during normal winter outflows.<br />
<strong>The</strong> strong estuarine gradient in the north<br />
bay region influences the distribution <strong>of</strong><br />
Figure 13. Monthly averages <strong>of</strong> delta outflow for the years 1973-1977. Historjca1<br />
outflow includes flood flows through Yolo Bypass, outflow index is standard calcu;atio!~<br />
<strong>of</strong> deita outflow based on estimated flows in Sacramento and <strong>San</strong> Joaquin<br />
Rivers only. Years 1973-74 considered "normal" water years; 1975-77 considered<br />
drought years.


