English - BCSD Static Server - Bakersfield City School District
English - BCSD Static Server - Bakersfield City School District
English - BCSD Static Server - Bakersfield City School District

Create successful ePaper yourself
Turn your PDF publications into a flip-book with our unique Google optimized e-Paper software.
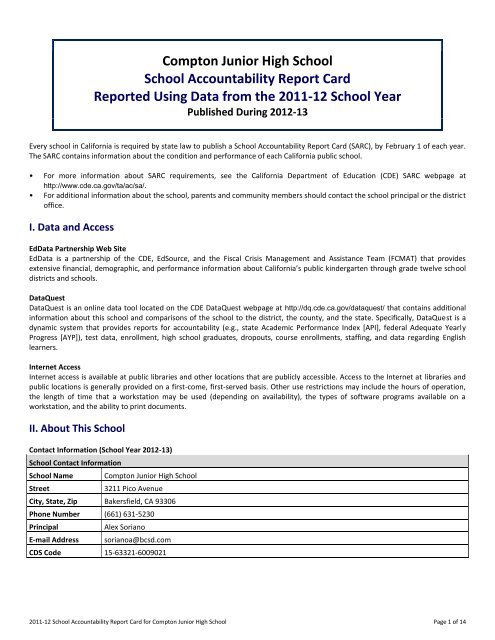
Compton Junior High <strong>School</strong><br />
<strong>School</strong> Accountability Report Card<br />
Reported Using Data from the 2011-12 <strong>School</strong> Year<br />
Published During 2012-13<br />
Every school in California is required by state law to publish a <strong>School</strong> Accountability Report Card (SARC), by February 1 of each year.<br />
The SARC contains information about the condition and performance of each California public school.<br />
• For more information about SARC requirements, see the California Department of Education (CDE) SARC webpage at<br />
http://www.cde.ca.gov/ta/ac/sa/.<br />
• For additional information about the school, parents and community members should contact the school principal or the district<br />
office.<br />
I. Data and Access<br />
EdData Partnership Web Site<br />
EdData is a partnership of the CDE, EdSource, and the Fiscal Crisis Management and Assistance Team (FCMAT) that provides<br />
extensive financial, demographic, and performance information about California’s public kindergarten through grade twelve school<br />
districts and schools.<br />
DataQuest<br />
DataQuest is an online data tool located on the CDE DataQuest webpage at http://dq.cde.ca.gov/dataquest/ that contains additional<br />
information about this school and comparisons of the school to the district, the county, and the state. Specifically, DataQuest is a<br />
dynamic system that provides reports for accountability (e.g., state Academic Performance Index [API], federal Adequate Yearly<br />
Progress [AYP]), test data, enrollment, high school graduates, dropouts, course enrollments, staffing, and data regarding <strong>English</strong><br />
learners.<br />
Internet Access<br />
Internet access is available at public libraries and other locations that are publicly accessible. Access to the Internet at libraries and<br />
public locations is generally provided on a first-come, first-served basis. Other use restrictions may include the hours of operation,<br />
the length of time that a workstation may be used (depending on availability), the types of software programs available on a<br />
workstation, and the ability to print documents.<br />
II. About This <strong>School</strong><br />
Contact Information (<strong>School</strong> Year 2012-13)<br />
<strong>School</strong> Contact Information<br />
<strong>School</strong> Name-------<br />
Street-------<br />
Compton Junior High <strong>School</strong><br />
3211 Pico Avenue<br />
<strong>City</strong>, State, Zip------- <strong>Bakersfield</strong>, CA 93306<br />
Phone Number------- (661) 631-5230<br />
Principal-------<br />
E-mail Address-------<br />
Alex Soriano<br />
sorianoa@bcsd.com<br />
CDS Code------- 15-63321-6009021<br />
2011-12 <strong>School</strong> Accountability Report Card for Compton Junior High <strong>School</strong> Page 1 of 14
<strong>District</strong> Contact Information<br />
<strong>District</strong> Name-------<br />
<strong>Bakersfield</strong> <strong>City</strong> <strong>School</strong> <strong>District</strong><br />
Phone Number------- (661) 631-4600<br />
Web Site-------<br />
www.bcsd.com<br />
Superintendent------- Robert J. Arias, Ed.D.<br />
E-mail Address-------<br />
supt@bcsd.com<br />
<strong>School</strong> Description and Mission Statement (<strong>School</strong> Year 2011-12)<br />
This section provides information about the school, its programs and its goals.<br />
The <strong>School</strong> Accountability Report Card was established by Proposition 98, an initiative passed by California voters. As you read the<br />
Report Card, you will gain a better understanding of Compton as a school with a record for improvement, a faculty that is<br />
professionally skilled and personally committed to meeting the learning needs of students and a student body which is enthusiastic<br />
and motivated to perform well.<br />
Compton Junior High <strong>School</strong>, located in East <strong>Bakersfield</strong>, serves grades seven and eight. The Compton campus was established in<br />
1960.<br />
Compton Junior High consists of a pro-active collaboration of students, teachers, and administrators, support staff, parents and<br />
community partners, committed to having students become lifelong learners. All members of this team are responsible and<br />
accountable for expanding student potential through accelerated learning using current technology in a clean, safe, appealing school<br />
environment, and emphasizing school pride and self-respect.<br />
Opportunities for Parental Involvement (<strong>School</strong> Year 2011-12)<br />
This section provides information on how parents can become involved in school activities, including contact information pertaining<br />
to organized opportunities for parent involvement.<br />
In addition to monthly Parent Booster Club meetings, parents may be involved in the following ways:<br />
• <strong>School</strong> Site Council – Elected parents form 25% of the council and oversee the implementation of the school plan.<br />
• <strong>English</strong> Learner Advisory Committee – Parents are nominated and sit on the committee in an advisory capacity for <strong>School</strong><br />
Site Council.<br />
• <strong>School</strong> Advisory Committee – When convened, parents are nominated and sit on the committee in an advisory capacity for<br />
<strong>School</strong> Site Council.<br />
• Student Intervention Team Meetings – Parents are formally invited to attend and participate in meetings that focus on<br />
intervention strategies for their child<br />
• <strong>English</strong> Learner Reclassification Meetings – Parents of <strong>English</strong> Learners are formally invited to attend Language Acquisition<br />
Team meeting to determine the language status reclassification of their child. They are also invited to attend a celebration<br />
of their child’s reclassification.<br />
• Awards Assemblies – Parents are formally invited to attend and watch their child receive an award.<br />
• Title I Parent Meeting – All parents are invited each year to attend a meeting focusing on categorical funds and how they<br />
are used to improve student achievement at Compton.<br />
• Parent Conference Week – One week each year is set aside for parents to attend meetings after school in regard to their<br />
individual child and his/her academics.<br />
In addition, a newsletter is mailed home monthly, translated into Spanish. The newsletter includes a letter from the Principal and<br />
Outreach Specialist. There is also a monthly calendar, articles from various support staff, recognition of students, Booster Club<br />
news, school website, and After <strong>School</strong> Program activities. Annual events include Back to <strong>School</strong> Night, fundraisers, concerts,<br />
awards assemblies, sixth grade orientation, and eighth grade graduation.<br />
2011-12 <strong>School</strong> Accountability Report Card for Compton Junior High <strong>School</strong> Page 2 of 14
Student Enrollment by Grade Level (<strong>School</strong> Year 2011-12)<br />
Grade Level<br />
Number of Students<br />
Grade 7------- 331<br />
Grade 8 306<br />
Total Enrollment------- 637<br />
Student Enrollment by Group (<strong>School</strong> Year 2011-12)<br />
Group<br />
Percent of<br />
Total Enrollment<br />
Group<br />
Percent of<br />
Total Enrollment<br />
Black or African American------- 7.4 White 13.2<br />
American Indian or Alaska Native----<br />
0.3 Two or More Races 1.1<br />
Asian------- 0.8 Socioeconomically Disadvantaged 77.7<br />
Filipino------- 1.3 <strong>English</strong> Learners 29.8<br />
Hispanic or Latino------- 75.7 Students with Disabilities 8.3<br />
Native Hawaiian/Pacific Islander 0.3<br />
Average Class Size and Class Size Distribution (Secondary)<br />
Subject<br />
<strong>English</strong>-------<br />
----------<br />
Mathematics<br />
----------<br />
Science-------<br />
----------<br />
Social Science<br />
----------<br />
2009-10 2010-11 2011-12<br />
Avg. Number of Classrooms Avg. Number of Classrooms Avg. Number of Classrooms<br />
Class<br />
Class<br />
Class<br />
Size 1-22 23-32 33+ Size 1-22 23-32 33+ Size 1-22 23-32 33+<br />
29.23 6 7 13 26.2 17 16 17 28.1 15 11 22<br />
30 2 13 6 24.9 12 6 8 24.7 8 10 9<br />
23.77 12 7 7 25.6 12 2 7 25.8 10 3 9<br />
26.95 8 7 7 23.8 12 6 6 21 13 9 6<br />
* Number of classes indicates how many classrooms fall into each size category (a range of total students per classroom). At the secondary school level, this<br />
information is reported by subject area rather than grade level.<br />
III. <strong>School</strong> Climate<br />
<strong>School</strong> Safety Plan (<strong>School</strong> Year 2011-12)<br />
This section provides information about the school’s comprehensive safety plan, including the dates on which the safety plan was<br />
last reviewed, updated, and discussed with faculty; as well as a brief description of the key elements of the plan.<br />
Compton established its Comprehensive <strong>School</strong> Safety Plan in 1998. A law enforcement officer specializing in safety provided<br />
direction in the establishment of the <strong>School</strong> Safety Plan. Compton’s <strong>School</strong> Safety Plan is current and is updated annually. Key<br />
elements of Compton’s <strong>School</strong> Safety Plan include the following: (a) routine and emergency disaster procedures; (b) suspension, and<br />
expulsion procedures; (c) teacher notification of pupils with a specific discipline history; (d) child abuse reporting procedures, (e) the<br />
district’s sexual harassment policy; (f) school crime data; (g) the student dress code; (h) safe entrance and exit procedures; (i) the<br />
civil defense and disaster plan; and (j) discipline rules and procedures. Our overall goal is to maintain a safe and orderly school<br />
environment conducive to learning.<br />
Suspensions and Expulsions<br />
Rate*<br />
<strong>School</strong><br />
<strong>District</strong><br />
2009-10 2010-11 2011-12 2009-10 2010-11 2011-12<br />
Suspensions------- 59.2 37.9 29.5 32.43 33.8 22.0<br />
Expulsions------- 0.88 1 0.5 0.4 0.5 0.3<br />
* The rate of suspensions and expulsions is calculated by dividing the total number of incidents by the total enrollment (and multiplying by 100).<br />
2011-12 <strong>School</strong> Accountability Report Card for Compton Junior High <strong>School</strong> Page 3 of 14
IV. <strong>School</strong> Facilities<br />
<strong>School</strong> Facility Conditions and Planned Improvements (<strong>School</strong> Year 2012-13)<br />
This section provides information from the most recent Facility Inspection Tool (FIT) data (or equivalent), including:<br />
• Description of the safety, cleanliness, and adequacy of the school facility<br />
• Description of any planned or recently completed facility improvements<br />
• The year and month in which the data were collected<br />
• Description of any needed maintenance to ensure good repair<br />
Year and month in which data were collected: 9/2012<br />
Compton <strong>School</strong> was built in 1960. It sits on 9.9 acres of which 4.01 acres is playground. This school has 25 classrooms, a multipurpose<br />
facility, two science labs, band room, teacher tutor room, lounge room, counseling room, wood shop, PTA room, computer<br />
room, nurse/psychologist room and a library. The campus has staff dinning and a workroom.<br />
The custodial staff adheres to a weekly cleaning schedule that includes classrooms, restrooms, cafeteria and kitchen areas.<br />
The <strong>District</strong>’s Mobile Maintenance Team visits the school site at least twice a year. Maintenance emergencies are addressed<br />
immediately. <strong>District</strong> personnel maintain the grounds at least once every two weeks.<br />
This site also is maintained to ensure a clean, safe, and functional facility as determined pursuant to a Facility Inspection Tool<br />
developed by the State of California Office of Public <strong>School</strong> Construction.<br />
For the 2011-12/2012-13 school year, the <strong>District</strong>’s governing board has approved deferred maintenance projects for this school<br />
that resulted in the completion of a protective asphalt coating.<br />
During the 2012-2013 school year, local bond funds Measure G and state matching funds will be used to modernize this site. The<br />
work on this project is scheduled to begin in 2013 and estimated to be completed prior to the start of the 2014-2015 school year.<br />
<strong>School</strong> Facility Good Repair Status (<strong>School</strong> Year 2012-13)<br />
This section provides information from the most recent Facility Inspection Tool (FIT) data (or equivalent), including:<br />
• Determination of repair status for systems listed<br />
• Description of any needed maintenance to ensure good repair<br />
• The Overall Rating (bottom row)<br />
System Inspected<br />
Systems:<br />
Gas Leaks, Mechanical/HVAC, Sewer<br />
Interior:<br />
Interior Surfaces<br />
Cleanliness:<br />
Overall Cleanliness, Pest/ Vermin Infestation<br />
Electrical:<br />
Electrical<br />
Repair Status<br />
Exemplary Good Fair Poor<br />
Repair Needed and<br />
Action Taken or Planned<br />
[ ] [X] [ ] [ ] Room 11 - HVAC leaking water into<br />
classrooms.<br />
12/5/12 - Cleaned condensation.<br />
[ ] [X] [ ] [ ]<br />
[ ] [X] [ ] [ ]<br />
[ ] [ ] [ ] [X] Rooms 10,11, 12,16,19,24 - Daisy<br />
chain power strip.<br />
12/11/12 - Corrected.<br />
Room 11 - Top electrical plug on<br />
west wall does not work.<br />
12/11/12 - Electrical plug fixed.<br />
2011-12 <strong>School</strong> Accountability Report Card for Compton Junior High <strong>School</strong> Page 4 of 14
System Inspected<br />
Restrooms/Fountains:<br />
Restrooms, Sinks/ Fountains<br />
Safety:<br />
Fire Safety, Hazardous Materials<br />
Repair Status<br />
Exemplary Good Fair Poor<br />
Repair Needed and<br />
Action Taken or Planned<br />
[ ] [X] [ ] [ ] CR Bldgs Roms 1-34 - Low water<br />
pressure and hardware replacement<br />
observed.<br />
12/20/12 - Repaired water pressure<br />
and replaced some hardware where<br />
needed.<br />
[ ] [X] [ ] [ ] Room 24 - No tag on fire<br />
extinguisher.<br />
12/17/12 - Put tag on ext.<br />
Structural:<br />
Structural Damage, Roofs<br />
External:<br />
Playground/<strong>School</strong> Grounds, Windows/<br />
Doors/Gates/Fences<br />
[ ] [X] [ ] [ ]<br />
[ ] [X] [ ] [ ]<br />
Overall Rating [ ] [X] [ ] [ ]<br />
V. Teachers<br />
Teacher Credentials<br />
Teachers<br />
<strong>School</strong><br />
<strong>District</strong><br />
2009-10 2010-11 2011-12 2011-12<br />
With Full Credential 20 24 19 1222<br />
Without Full Credential 1 0 2 35<br />
Teaching Outside Subject Area of Competence 3 2 3 ---<br />
Teacher Misassignments and Vacant Teacher Positions<br />
Indicator 2010-11 2011-12 2012-13<br />
Misassignments of Teachers of <strong>English</strong> Learners 1 0 0<br />
Total Teacher Misassignments 1 0 0<br />
Vacant Teacher Positions 0 0 0<br />
* “Misassignments” refers to the number of positions filled by teachers who lack legal authorization to teach that grade level, subject area, student group, etc.<br />
2011-12 <strong>School</strong> Accountability Report Card for Compton Junior High <strong>School</strong> Page 5 of 14
Core Academic Classes Taught by Highly Qualified Teachers (<strong>School</strong> Year 2011-12)<br />
The Federal Elementary and Secondary Education Act (ESEA), also known as No Child Left Behind (NCLB), requires that core<br />
academic subjects be taught by Highly Qualified Teachers, defined as having at least a bachelor’s degree, an appropriate California<br />
teaching credential, and demonstrated core academic subject area competence. For more information, see the CDE Improving<br />
Teacher and Principal Quality webpage at: http://www.cde.ca.gov/nclb/sr/tq/<br />
Location of Classes<br />
Taught by Highly Qualified Teachers<br />
Percent of Classes In Core Academic Subjects<br />
Not Taught by Highly Qualified Teachers<br />
This <strong>School</strong> 58.14 41.86<br />
All <strong>School</strong>s in <strong>District</strong> 73.63 26.37<br />
High-Poverty <strong>School</strong>s in <strong>District</strong> 73.37 26.63<br />
Low-Poverty <strong>School</strong>s in <strong>District</strong> 96.43 3.57<br />
* High-poverty schools are defined as those schools with student eligibility of approximately 40 percent or more in the free and reduced price meals program.<br />
Low-poverty schools are those with student eligibility of approximately 25 percent or less in the free and reduced price meals program.<br />
VI. Support Staff<br />
Academic Counselors and Other Support Staff (<strong>School</strong> Year 2011-12)<br />
Title<br />
Number of FTE<br />
Assigned to <strong>School</strong><br />
Academic Counselor------- 1<br />
Average Number of Students per<br />
Academic Counselor<br />
Counselor (Social/Behavioral or Career Development) ---<br />
Library Media Teacher (Librarian) 1 ---<br />
Library Media Services Staff (Paraprofessional) ---<br />
Psychologist------- ---<br />
Social Worker------- ---<br />
Nurse------- ---<br />
Speech/Language/Hearing Specialist ---<br />
Resource Specialist------- 2 ---<br />
Other------- ---<br />
* One Full-Time Equivalent (FTE) equals one staff member working full-time; one FTE could also represent two staff members who each work 50 percent of fulltime.<br />
2011-12 <strong>School</strong> Accountability Report Card for Compton Junior High <strong>School</strong> Page 6 of 14
VII. Curriculum and Instructional Materials<br />
Quality, Currency, Availability of Textbooks and Instructional Materials (<strong>School</strong> Year 2012-13)<br />
This section describes whether the textbooks and instructional materials used at the school are from the most recent adoption;<br />
whether there are sufficient textbooks and instruction materials for each student; and information about the school’s use of any<br />
supplemental curriculum or non-adopted textbooks or instructional materials.<br />
Year and month in which data were collected: September, 2012<br />
Core Curriculum Area<br />
Reading/Language Arts<br />
Textbooks and Instructional Materials/<br />
Year of Adoption<br />
Grades K-5: Pearson Scott Foresman Pearson CA<br />
Reading Street; Pearson Calle de Lectura para<br />
California, 2010<br />
Grades 6-8: Holt, Rinehart & Winston, Holt Literature<br />
and Language Arts, 2010<br />
Grades K-5: Harcourt <strong>School</strong> Publishers Moving Into<br />
<strong>English</strong> (ELD), 2006<br />
Grades 6-8: Lit Conn <strong>English</strong> Now! (ELD), 2005<br />
Grades 4-6 Elementary: Sopris West Educational<br />
Services, Language! 2011<br />
Grades 6-8 Junior High/Middle <strong>School</strong>s: Steck-Vaughn<br />
California Gateways, 2011<br />
From<br />
Most Recent<br />
Adoption?<br />
Percent of Students<br />
Lacking Own<br />
Assigned Copy<br />
Yes 0%<br />
Mathematics<br />
Grades K-5: Houghton Mifflin Houghton Mifflin<br />
California Math, 2009<br />
Grades 6-8: Holt, Rinehart & Winston Holt<br />
Mathematics Course 1 and 2, Algebra 1, 2008<br />
Grade 8: McDougal Littell McDougal Littell Algebra<br />
Readiness, 2008<br />
Yes 0%<br />
Science-------<br />
Grades K-5: Houghton Mifflin Houghton Mifflin<br />
California Science, 2007<br />
Grades 6-8: Holt, Rinehart & Winston, Holt California<br />
Science: Earth, Life and Physical Science, 2007<br />
Yes 0%<br />
2011-12 <strong>School</strong> Accountability Report Card for Compton Junior High <strong>School</strong> Page 7 of 14
Core Curriculum Area<br />
History-Social Science<br />
Textbooks and Instructional Materials/<br />
Year of Adoption<br />
Grades K-5: Harcourt <strong>School</strong> Publishers Reflections,<br />
2007<br />
Grade 6: Holt, Rinehart & Winston Holt California<br />
Social Studies: World History, Ancient Civilizations,<br />
2006<br />
Grade 7: Holt, Rinehart & Winston Holt California<br />
Social Studies: World History Medieval to Early<br />
Modern Times, 2006<br />
Grade 8: Holt, Rinehart & Winston Holt California<br />
Social Studies: United States History Independence to<br />
1914, 2006<br />
From<br />
Most Recent<br />
Adoption?<br />
Percent of Students<br />
Lacking Own<br />
Assigned Copy<br />
Yes 0%<br />
Foreign Language Yes 0%<br />
Health------- Yes 0%<br />
Visual and Performing Arts<br />
Grades K-5: Harcourt <strong>School</strong> Publishers Harcourt Art<br />
Express, 1999<br />
Grade 6 (Elementary): Glencoe/McGraw Hill<br />
Glencoe/McGraw Hill, Understanding Art, 1999<br />
Grades 6-8 (Jr Hi/Middle <strong>School</strong>): Pearson Scott<br />
Foresman Pearson/Scott Foresman, Art, 2007<br />
Grades K-6: Silver Burdett Silver Burdett Music<br />
Connection, 1999<br />
Grades 6-8: Silver Burdett Silver Burdett Making<br />
Music, 2007<br />
Yes 0%<br />
2011-12 <strong>School</strong> Accountability Report Card for Compton Junior High <strong>School</strong> Page 8 of 14
VIII. <strong>School</strong> Finances<br />
Expenditures Per Pupil and <strong>School</strong> Site Teacher Salaries (Fiscal Year 2010-11)<br />
Level<br />
Total<br />
Expenditures Per Pupil<br />
Supplemental/<br />
Restricted<br />
Basic/<br />
Unrestricted<br />
Average<br />
Teacher<br />
Salary<br />
<strong>School</strong> Site------- $5,398 $1,709 $3,689 $56,692<br />
<strong>District</strong>------- --- --- $5,148 $62,224<br />
Percent Difference: <strong>School</strong> Site and <strong>District</strong> --- --- -17.6% 3.2%<br />
State------- --- --- $5,455 $69,404<br />
Percent Difference: <strong>School</strong> Site and State --- --- -25.3% -7.3%<br />
* Supplemental/Restricted expenditures come from money whose use is controlled by law or by a donor. Money that is designated for specific purposes by the<br />
district or governing board is not considered restricted.<br />
** Basic/Unrestricted expenditures are from money whose use, except for general guidelines, is not controlled by law or by a donor.<br />
For detailed information on school expenditures for all districts in California, see the CDE Current Expense of Education & Per-pupil Spending webpage at<br />
http://www.cde.ca.gov/ds/fd/ec/. For information on teacher salaries for all districts in California, see the CDE Certificated Salaries & Benefits webpage at<br />
http://www.cde.ca.gov/ds/fd/cs/. To look up expenditures and salaries for a specific school district, see the Ed-Data Web site at: http://www.ed-data.org.<br />
Types of Services Funded (Fiscal Year 2011-12)<br />
This section provides specific information about the types of programs and services available at the school that support and assists<br />
students. For example, this narrative may include information about supplemental educational services related to the school’s<br />
federal Program Improvement (PI) status.<br />
<br />
<br />
<br />
<br />
<br />
<br />
<br />
<br />
SLIBG<br />
Special Ed<br />
Migrant Ed<br />
Education Jobs Fund<br />
EIA/SCE<br />
EIA/LEP<br />
TITLE I<br />
After <strong>School</strong> Program<br />
Teacher and Administrative Salaries (Fiscal Year 2010-11)<br />
Category<br />
<strong>District</strong><br />
Amount<br />
State Average for<br />
<strong>District</strong>s In Same Category<br />
Beginning Teacher Salary $40,433 $41,246<br />
Mid-Range Teacher Salary $60,955 $67,400<br />
Highest Teacher Salary $78,592 $85,481<br />
Average Principal Salary (Elementary) $110,207 $107,739<br />
Average Principal Salary (Middle) $111,716 $111,540<br />
Average Principal Salary (High) $110,146<br />
Superintendent Salary $181,619 $180,572<br />
Percent of Budget for Teacher Salaries 37% 42%<br />
Percent of Budget for Administrative Salaries 5% 5%<br />
* For detailed information on salaries, see the CDE Certificated Salaries & Benefits webpage at http://www.cde.ca.gov/ds/fd/cs/.<br />
2011-12 <strong>School</strong> Accountability Report Card for Compton Junior High <strong>School</strong> Page 9 of 14
IX. Student Performance<br />
The Standardized Testing and Reporting (STAR) Program consists of several key components, including:<br />
• California Standards Tests (CSTs), which include <strong>English</strong>-language arts (ELA) and mathematics in grades two through eleven;<br />
science in grades five, eight, and nine through eleven; and history-social science in grades eight, and nine through eleven.<br />
• California Modified Assessment (CMA), an alternate assessment that is based on modified achievement standards in ELA for<br />
grades three through eleven; mathematics for grades three through seven, Algebra I, and Geometry; and science in grades five<br />
and eight, and Life Science in grade ten. The CMA is designed to assess those students whose disabilities preclude them from<br />
achieving grade-level proficiency on an assessment of the California content standards with or without accommodations.<br />
• California Alternate Performance Assessment (CAPA), includes ELA and mathematics in grades two through eleven, and science<br />
for grades five, eight, and ten. The CAPA is given to those students with significant cognitive disabilities whose disabilities<br />
prevent them from taking either the CSTs with accommodations or modifications or the CMA with accommodations.<br />
The assessments under the STAR Program show how well students are doing in relation to the state content standards. On each of<br />
these assessments, student scores are reported as performance levels.<br />
For detailed information regarding the STAR Program results for each grade and performance level, including the percent of<br />
students not tested, see the CDE STAR Results Web site at http://star.cde.ca.gov.<br />
Standardized Testing and Reporting Results for All Students - Three-Year Comparison<br />
Subject<br />
Percent of Students Scoring at Proficient or Advanced<br />
<strong>School</strong> <strong>District</strong> State<br />
2009-10 2010-11 2011-12 2009-10 2010-11 2011-12 2009-10 2010-11 2011-12<br />
<strong>English</strong>-Language Arts 43 47 48 37 40 41 52 54 56<br />
Mathematics------- 45 41 49 46 47 51 48 50 51<br />
Science------- 39 48 49 30 34 38 54 57 60<br />
History-Social Science 29 42 33 23 28 27 44 48 49<br />
* Scores are not shown when the number of students tested is ten or less, either because the number of students in this category is too small for statistical<br />
accuracy or to protect student privacy.<br />
2011-12 <strong>School</strong> Accountability Report Card for Compton Junior High <strong>School</strong> Page 10 of 14
Standardized Testing and Reporting Results by Student Group - Most Recent Year<br />
Group<br />
Percent of Students Scoring at Proficient or Advanced<br />
<strong>English</strong>-Language Arts Mathematics Science History-Social Science<br />
All Students in the LEA 41 51 38 27<br />
All Student at the <strong>School</strong> 48 49 49 33<br />
Male------- 42 46 47 34<br />
Female------- 54 53 52 32<br />
Black or African American 33 23 23 15<br />
American Indian or Alaska Native<br />
Asian-------<br />
Filipino-------<br />
Hispanic or Latino 44 48 48 30<br />
Native Hawaiian/Pacific Islander<br />
White------- 71 68 64 48<br />
Two or More Races-------<br />
Socioeconomically Disadvantaged 43 45 43 27<br />
<strong>English</strong> Learners------- 12 23 17 6<br />
Students with Disabilities 49 29 14 5<br />
Students Receiving Migrant Education Services 37 51 38 31<br />
* Scores are not shown when the number of students tested is ten or less, either because the number of students in this category is too small for statistical<br />
accuracy or to protect student privacy.<br />
California Physical Fitness Test Results (<strong>School</strong> Year 2011-12)<br />
The California Physical Fitness Test (PFT) is administered to students in grades five, seven, and nine only. This table displays by grade<br />
level the percent of students meeting the fitness standards for the most recent testing period. For detailed information regarding<br />
this test, and comparisons of a school’s test results to the district and state, see the CDE PFT webpage at<br />
http://www.cde.ca.gov/ta/tg/pf/.<br />
Grade<br />
Level<br />
Percent of Students Meeting Fitness Standards<br />
Four of Six Standards Five of Six Standards Six of Six Standards<br />
-------7------- 35.6 18.4 9.8<br />
* Scores are not shown when the number of students tested is ten or less, either because the number of students in this category is too small for statistical<br />
accuracy or to protect student privacy.<br />
X. Accountability<br />
Academic Performance Index<br />
The Academic Performance Index (API) is an annual measure of state academic performance and progress of schools in California.<br />
API scores range from 200 to 1,000, with a statewide target of 800. For detailed information about the API, see the CDE API webpage<br />
at http://www.cde.ca.gov/ta/ac/ap/.<br />
Academic Performance Index Ranks - Three-Year Comparison<br />
This table displays the school’s statewide and similar schools’ API ranks. The statewide API rank ranges from 1 to 10. A statewide<br />
rank of 1 means that the school has an API score in the lowest ten percent of all schools in the state, while a statewide rank of 10<br />
means that the school has an API score in the highest ten percent of all schools in the state.<br />
2011-12 <strong>School</strong> Accountability Report Card for Compton Junior High <strong>School</strong> Page 11 of 14
The similar schools API rank reflects how a school compares to 100 statistically matched “similar schools.” A similar schools rank of<br />
1 means that the school’s academic performance is comparable to the lowest performing ten schools of the 100 similar schools,<br />
while a similar schools rank of 10 means that the school’s academic performance is better than at least 90 of the 100 similar schools.<br />
API Rank 2009 2010 2011<br />
Statewide------- 2 3 4<br />
Similar <strong>School</strong>s------- 3 6 8<br />
Academic Performance Index Growth by Student Group – Three-Year Comparison<br />
Group<br />
Actual API Change<br />
2009-10 2010-11 2011-12<br />
All Students at the <strong>School</strong> 49 20 2<br />
Black or African American<br />
American Indian or Alaska Native<br />
Asian-------<br />
Filipino-------<br />
Hispanic or Latino 51 24 4<br />
Native Hawaiian/Pacific Islander<br />
White-------<br />
Two or More Races<br />
Socioeconomically Disadvantaged 47 22 -3<br />
<strong>English</strong> Learners 56 9 -4<br />
Students with Disabilities<br />
* "N/D” means that no data were available to the CDE or LEA to report. “B” means the school did not have a valid API Base and there is no Growth or target<br />
information. “C” means the school had significant demographic changes and there is no Growth or target information.<br />
Academic Performance Index Growth by Student Group - 2012 Growth API Comparison<br />
This table displays, by student group, the number of students included in the API and the 2012 Growth API at the school, district, and<br />
state level.<br />
Group<br />
2012 Growth API<br />
<strong>School</strong> <strong>District</strong> State<br />
# of Students Growth API # of Students Growth API # of Students Growth API<br />
All Students at the <strong>School</strong> 573 746 19,644 731 4,664,264 788<br />
Black or African American 39 631 1,664 673 313,201 710<br />
American Indian or Alaska Native 2 142 712 31,606 742<br />
Asian------- 5 161 786 404,670 905<br />
Filipino------- 8 108 873 124,824 869<br />
Hispanic or Latino 434 735 15,365 725 2,425,230 740<br />
Native Hawaiian/Pacific Islander 2 34 776 26,563 775<br />
White------- 76 838 1,981 808 1,221,860 853<br />
Two or More Races 7 188 789 88,428 849<br />
Socioeconomically Disadvantaged 464 714 17,433 715 2,779,680 737<br />
<strong>English</strong> Learners 170 640 8,022 687 1,530,297 716<br />
Students with Disabilities 47 583 2,058 566 530,935 607<br />
2011-12 <strong>School</strong> Accountability Report Card for Compton Junior High <strong>School</strong> Page 12 of 14
Adequate Yearly Progress<br />
The federal ESEA requires that all schools and districts meet the following Adequate Yearly Progress (AYP) criteria:<br />
• Participation rate on the state’s standards-based assessments in ELA and mathematics<br />
• Percent proficient on the state’s standards-based assessments in ELA and mathematics<br />
• API as an additional indicator<br />
• Graduation rate (for secondary schools)<br />
Detailed information about AYP, including participation rates and percent proficient results by student group, can be found at the<br />
CDE Adequate Yearly Progress (AYP) webpage at http://www.cde.ca.gov/ta/ac/ay/.<br />
Adequate Yearly Progress Overall and by Criteria (<strong>School</strong> Year 2011-12)<br />
AYP Criteria <strong>School</strong> <strong>District</strong><br />
Made AYP Overall No No<br />
Met Participation Rate: <strong>English</strong>-Language Arts Yes Yes<br />
Met Participation Rate: Mathematics Yes Yes<br />
Met Percent Proficient: <strong>English</strong>-Language Arts No No<br />
Met Percent Proficient: Mathematics No No<br />
Met API Criteria Yes Yes<br />
Met Graduation Rate (if applicable) N/A N/A<br />
Federal Intervention Program (<strong>School</strong> Year 2012-13)<br />
<strong>School</strong>s and districts receiving federal Title I funding enter Program Improvement (PI) if they do not make AYP for two consecutive<br />
years in the same content area (ELA or mathematics) or on the same indicator (API or graduation rate). After entering PI, schools and<br />
districts advance to the next level of intervention with each additional year that they do not make AYP. For detailed information<br />
about PI identification, see the CDE PI Status Determinations webpage: http://www.cde.ca.gov/ta/ac/ay/tidetermine.asp.<br />
Indicator <strong>School</strong> <strong>District</strong><br />
Program Improvement Status In PI In PI<br />
First Year of Program Improvement 2009-2010 2004-2005<br />
Year in Program Improvement Year 4 Year 3<br />
Number of <strong>School</strong>s Currently in Program Improvement --- 35<br />
Percent of <strong>School</strong>s Currently in Program Improvement --- 87.5<br />
2011-12 <strong>School</strong> Accountability Report Card for Compton Junior High <strong>School</strong> Page 13 of 14
XII. Instructional Planning and Scheduling<br />
Professional Development<br />
This section provides information on the number of days provided for professional development and continuous professional growth<br />
in the most recent three year period. Questions that may be answered include:<br />
• What are the primary/major areas of focus for staff development and specifically how were they selected? For example, were<br />
student achievement data used to determine the need for professional development in reading instruction?<br />
• What are the methods by which professional development is delivered (e.g., after school workshops, conference attendance,<br />
individual mentoring, etc.)?<br />
• How are teachers supported during implementation (e.g., through in-class coaching, teacher-principal meetings, student<br />
performance, and data reporting, etc.)?<br />
Professional development is designed to provide continuous learning opportunities for administrators, teachers, and classified<br />
personnel. Training opportunities affirm the basic philosophy of education that learning is a lifelong process that contributes to the<br />
wellbeing of the students, teachers, administrators, and community. Professional Development is an essential component of<br />
effective instruction and student learning.<br />
All training revolves around identified needs for the purpose of the improvement of instruction and increasing content knowledge.<br />
Central to all training are student achievement data, district focus areas, the California Frameworks, the Common Core State<br />
Standards, the state adopted standards-based instructional materials, and strategies to effectively teach the academic content<br />
standards to all students.<br />
The district created and provided instructional modules based on the Common Core State Standards for teachers and<br />
administrators. The modules included a Common Core overview, Mathematical Practices, Cross-Curricular/Evidence Based Writing<br />
and Text Complexity/Academic Vocabulary. Training for Learning Village, a web based digital curriculum portal that contains best<br />
practices, instructional strategies and ideas, lesson plans for core curriculum, professional development and classroom technology<br />
resources, has also been offered to all classroom teachers. On-site coaching and support is provided by academic coaches for<br />
reading/language arts and mathematics. Additionally, the district provides time and resources for collaboration, planning, and<br />
professional development for all staff.<br />
Teachers new to the <strong>District</strong> received four days of professional development prior to the beginning of the school year focused on<br />
orientation to <strong>District</strong> and school site policies and services, classroom management, curriculum and pacing, and setting up the<br />
classroom. Teachers in their second year with the <strong>District</strong> received two days of professional development prior to the beginning of<br />
the school year focused on best practices for improving student achievement.<br />
New teachers with California preliminary credentials received professional development through the Beginning Teacher Support and<br />
Assessment (BTSA) program. The focus of training was in the Formative Assessment for California Teachers (FACT), California<br />
Standards for the Teaching Profession (CSTP), meeting the California Induction standards, and the California Academic Content<br />
Standards. Each beginning teacher was assigned a veteran teacher who served as a support provider. The support providers<br />
received on-going professional development in FACT, coaching strategies, and instructional techniques. Professional development<br />
was provided through individual mentoring, monthly meetings, and after-school workshops.<br />
Intern teachers received professional development at monthly meetings focusing on the initial teaching skills of the CSTP including<br />
classroom management, lesson planning, assessment, and establishing a climate that is conducive to student achievement. Each<br />
Intern was assigned a support provider that provided day-to-day support in these areas as well as advisement toward meeting<br />
credential requirements. Support providers received monthly professional development in meeting the needs of Intern teachers.<br />
Interns also received coursework and supervision from universities partnered with <strong>BCSD</strong> to provide the Intern Program.<br />
2011-12 <strong>School</strong> Accountability Report Card for Compton Junior High <strong>School</strong> Page 14 of 14