Method for Bias Field Correction of Brain T1-Weighted Magnetic ...
Method for Bias Field Correction of Brain T1-Weighted Magnetic ...
Method for Bias Field Correction of Brain T1-Weighted Magnetic ...

You also want an ePaper? Increase the reach of your titles
YUMPU automatically turns print PDFs into web optimized ePapers that Google loves.
Gispert et al. <br />
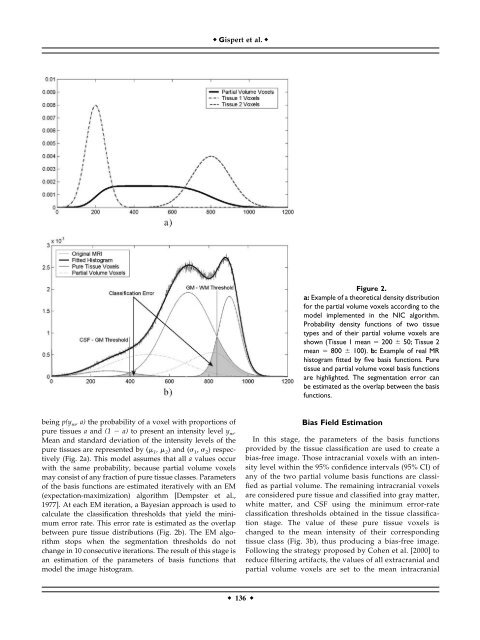
Figure 2.<br />
a: Example <strong>of</strong> a theoretical density distribution<br />
<strong>for</strong> the partial volume voxels according to the<br />
model implemented in the NIC algorithm.<br />
Probability density functions <strong>of</strong> two tissue<br />
types and <strong>of</strong> their partial volume voxels are<br />
shown (Tissue 1 mean 200 50; Tissue 2<br />
mean 800 100). b: Example <strong>of</strong> real MR<br />
histogram fitted by five basis functions. Pure<br />
tissue and partial volume voxel basis functions<br />
are highlighted. The segmentation error can<br />
be estimated as the overlap between the basis<br />
functions.<br />
being p(y m ,a)the probability <strong>of</strong> a voxel with proportions <strong>of</strong><br />
pure tissues a and (1 a) to present an intensity level y m .<br />
Mean and standard deviation <strong>of</strong> the intensity levels <strong>of</strong> the<br />
pure tissues are represented by ( 1 , 2 ) and ( 1 , 2 ) respectively<br />
(Fig. 2a). This model assumes that all a values occur<br />
with the same probability, because partial volume voxels<br />
may consist <strong>of</strong> any fraction <strong>of</strong> pure tissue classes. Parameters<br />
<strong>of</strong> the basis functions are estimated iteratively with an EM<br />
(expectation-maximization) algorithm [Dempster et al.,<br />
1977]. At each EM iteration, a Bayesian approach is used to<br />
calculate the classification thresholds that yield the minimum<br />
error rate. This error rate is estimated as the overlap<br />
between pure tissue distributions (Fig. 2b). The EM algorithm<br />
stops when the segmentation thresholds do not<br />
change in 10 consecutive iterations. The result <strong>of</strong> this stage is<br />
an estimation <strong>of</strong> the parameters <strong>of</strong> basis functions that<br />
model the image histogram.<br />
<strong>Bias</strong> <strong>Field</strong> Estimation<br />
In this stage, the parameters <strong>of</strong> the basis functions<br />
provided by the tissue classification are used to create a<br />
bias-free image. Those intracranial voxels with an intensity<br />
level within the 95% confidence intervals (95% CI) <strong>of</strong><br />
any <strong>of</strong> the two partial volume basis functions are classified<br />
as partial volume. The remaining intracranial voxels<br />
are considered pure tissue and classified into gray matter,<br />
white matter, and CSF using the minimum error-rate<br />
classification thresholds obtained in the tissue classification<br />
stage. The value <strong>of</strong> these pure tissue voxels is<br />
changed to the mean intensity <strong>of</strong> their corresponding<br />
tissue class (Fig. 3b), thus producing a bias-free image.<br />
Following the strategy proposed by Cohen et al. [2000] to<br />
reduce filtering artifacts, the values <strong>of</strong> all extracranial and<br />
partial volume voxels are set to the mean intracranial<br />
136