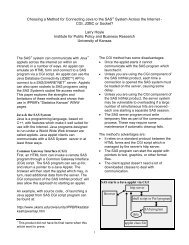
<strong>2001</strong> Tax Rates <strong>for</strong> 2002 <strong>Kansas</strong> Cities of the Second Class Assessed Total <strong>2001</strong>* Tangible Bonded Total City City Population Valuation Indebtedness Levy Total Mills Levied in City By All Units Abilene 6,543 $35,622,174 $8,044,115 $30.960 $116.508 Andover 6,698 48,975,403 29,702,620 28.515 156.753 Anthony 2,440 7,380,965 8,918,536 75.041 216.353 Arkansas City 11,963 39,464,874 10,048,774 64.157 158.252 Augusta 8,423 39,923,834 18,446,812 42.866 156.238 Baxter Springs 4,602 17,374,744 707,761 27.568 101.677 Bel Aire 5,836 29,846,996 9,337,000 14.857 116.214 Belleville 2,239 8,230,392 2,505,000 66.416 178.615 Beloit 4,019 18,330,357 2,150,042 46.350 155.789 Bonner Springs 6,768 41,879,301 11,690,000 39.027 Wyandotte County 40,137,953 39.027 159.866 Johnson County 1,741,348 39.027 143.699 Burlington 2,790 11,321,044 2,874,498 41.172 100.987 Caldwell 1,284 4,939,728 672,797 69.641 203.777 Caney 2,092 7,715,610 ** 39.731 151.363 Chanute 9,411 34,809,925 31,310,000 27.836 165.583 Cherryvale 2,386 5,883,015 720,000 53.212 180.107 Chetopa 1,281 2,700,266 594,787 40.706 144.571 Clay Center 4,564 18,287,149 2,129,032 47.253 152.850 Colby 5,450 29,993,003 14,243,814 37.617 134.861 Columbus 3,396 16,020,821 48,000 33.844 113.702 Concordia 5,714 20,874,954 5,634,891 58.671 181.291 Council Grove 2,321 11,070,724 ** 47.520 137.479 Derby 17,807 94,177,738 56,437,000 45.791 130.258 El Dorado 12,057 55,766,997 18,406,592 43.261 144.800 Elkhart 2,233 8,293,469 583,000 43.330 126.319 Ellis 1,873 6,673,889 1,462,828 57.229 137.083 Eureka 2,914 8,831,100 3,554,631 51.606 178.660 Fairway 3,952 57,160,881 1,090,000 12.339 92.851 Florence 671 2,056,464 249,001 81.215 183.664 Fredonia 2,600 9,157,616 6,540,074 35.519 145.212 Frontenac 2,996 13,770,011 3,823,087 24.096 105.583 Galena 3,287 9,012,168 2,122,000 33.275 119.305 Garnett 3,368 13,526,797 14,969,404 41.814 152.377 Girard 2,773 12,342,959 5,756,746 39.095 117.813 Goodland 4,948 22,872,831 3,438,361 50.034 136.789 Great Bend 15,345 68,845,957 14,210,321 39.276 156.933 Halstead 1,873 9,927,806 6,631,871 59.379 129.392 Harper 1,567 5,054,808 861,960 63.779 197.792 Hays 20,013 126,117,827 24,082,188 36.545 127.120 Haysville 8,502 34,945,899 14,126,280 43.371 141.409 Herington 2,563 6,951,479 2,080,672 69.421 Dickinson County 6,600,012 69.421 151.131 Morris County 351,467 69.421 169.431 Hesston 3,509 24,684,982 4,343,592 31.074 109.260 Hiawatha 3,417 15,020,967 2,955,000 39.657 121.669 Hillsboro 2,854 11,738,457 7,750,000 40.977 142.411 Hoisington 2,975 6,847,310 4,440,112 58.943 182.324 Holton 3,353 15,596,965 10,619,822 44.395 147.404 Horton 1,967 4,205,556 901,520 50.212 144.009
<strong>2001</strong> Tax Rates <strong>for</strong> 2002 <strong>Kansas</strong> Cities of the Second Class Assessed Total <strong>2001</strong>* Tangible Bonded Total City City Population Valuation Indebtedness Levy Total Mills Levied in City By All Units Hugoton 3,708 $13,216,425 $2,083,494 $41.613 $101.431 Humboldt 1,999 4,819,093 2,509,028 60.922 167.916 Independence 9,846 42,223,819 13,543,583 40.050 163.633 Iola 6,302 23,343,253 2,858,000 31.816 137.811 Kingman 3,387 15,654,820 10,410,000 52.650 154.559 Kinsley 1,658 5,286,476 861,333 80.610 186.368 Lansing 9,199 38,267,054 4,760,000 29.622 124.004 Larned 4,236 13,618,277 1,384,000 77.261 200.270 Lincoln 1,349 3,813,348 0 32.886 182.233 Lindsborg 3,321 15,042,752 4,958,368 30.431 117.493 Lyons 3,732 12,101,807 ** 48.469 170.828 McPherson 13,770 79,333,304 61,946,207 46.776 137.074 Marion 2,110 7,672,580 1,810,621 54.570 157.917 Marysville 3,271 17,450,603 4,748,669 53.324 139.510 Merriam 11,008 144,163,943 12,483,300 17.592 90.438 Minneapolis 2,046 7,373,399 18,880,734 42.705 151.869 Mission 9,727 119,488,652 3,425,000 5.124 83.546 Mulberry 577 582,578 497,855 46.651 118.479 Mulvane 5,155 21,885,877 7,266,236 49.969 Sedwick County 17,793,805 49.969 127.767 Sumner County 4,092,072 49.969 151.690 Neodesha 2,848 7,267,759 600,000 36.849 153.557 Nickerson 1,194 3,150,628 371,119 62.719 159.384 Norton 3,012 10,956,493 1,020,065 48.445 168.699 Osage City 3,034 13,759,323 4,865,000 33.336 113.473 Osawatomie 4,645 14,611,027 4,470,525 43.212 131.714 Osborne 1,607 4,860,087 931,504 67.150 176.500 Oswego 2,046 5,551,469 1,608,458 59.119 175.716 Ottawa 11,921 54,695,659 9,432,268 44.923 158.553 Paola 5,011 33,240,845 6,002,132 42.100 143.507 Park City 5,814 25,764,349 11,895,994 33.991 139.371 Phillipsburg 2,668 9,066,505 1,592,256 48.022 171.696 Pratt 6,570 26,888,539 21,494,630 45.097 181.903 Roeland Park 6,817 52,640,197 ** 17.340 97.016 Russell 4,696 17,273,882 5,692,658 51.530 156.915 Sabetha 2,589 13,878,677 8,594,547 41.548 Nemaha County 12,850,014 41.548 140.332 Brown County 1,538,693 41.548 135.570 Scammon 496 1,310,803 15.448 96.523 Scott City 3,855 17,098,133 2,440,196 61.252 158.777 Seneca 2,122 12,373,551 480,000 34.789 111.383 Sterling 2,642 6,300,035 ** 51.676 162.373 Ulysses 5,960 27,868,219 3,507,078 39.477 112.512 Valley Center 4,883 22,092,240 10,667,000 40.028 131.566 Wamego 4,246 20,420,339 3,215,000 41.439 126.703 Weir 780 1,500,389 ** 60.195 128.614 Wellington 8,647 34,566,909 25,257,724 46.357 160.132 Winfield 12,206 53,745,602 18,730,082 47.308 149.412 Yates Center 1,599 4,943,860 431,413 60.954 164.630 *U.S. Bureau of the Census, 2000 Census of total population on April 1, 2000. **Data not supplied by the taxing unit. Source: League of <strong>Kansas</strong> Municipalities, <strong>Kansas</strong> Government Journal , March 2002.
- Page 1 and 2:
Kansas Statistical Abstract 2001 36
- Page 3 and 4:
Table of Contents Foreword ........
- Page 5 and 6:
Education (con’t) Percent High Sc
- Page 7 and 8:
Housing and Construction (con’t)
- Page 9 and 10:
Transportation (con’t) Expenditur
- Page 11 and 12:
Preface Special thanks are owed to
- Page 13 and 14:
County Rankings December 2002 Kansa
- Page 15 and 16:
Selected County Population Rankings
- Page 17 and 18:
Selected County Rankings Per Capita
- Page 19 and 20:
Selected County Rankings Per Capita
- Page 21 and 22:
State Summary, 2000 Acres Acres Yie
- Page 24 and 25:
Thousands 100 NumberofFarmsinKansas
- Page 26 and 27:
Land Area and Proportion in Farms 1
- Page 28 and 29:
Farm, Crop and Livestock Informatio
- Page 30 and 31:
Farm, Crop and Livestock Informatio
- Page 32 and 33:
Agriculture Industry Production In
- Page 34 and 35:
Farm Value of Kansas Livestock and
- Page 36 and 37:
Livestock Shipped Into Kansas, by S
- Page 38 and 39:
ThousandsofDollars 35 30 25 20 Aver
- Page 40 and 41:
Crops Percentage of Farm Cash Recei
- Page 42 and 43:
Total Loans/Total Assets and Net Fa
- Page 44 and 45:
Banking and Finance December 2002 K
- Page 46 and 47:
Bank Deposits in Kansas by County F
- Page 48 and 49:
Banking Growth in Kansas 1949-2001
- Page 50 and 51:
New Firms by State, 1995-2000 Perce
- Page 52 and 53:
Self-Employment by State, 1995-2000
- Page 54 and 55:
Hispanic-Owned Businesses in Kansas
- Page 56 and 57:
Women-Owned Businesses in Kansas, 1
- Page 58 and 59:
Manufacturing in Kansas 1998r All e
- Page 60 and 61:
Manufacturing in Kansas 2000 All em
- Page 62 and 63:
Kind of Business Retail Trade in Ka
- Page 64 and 65:
Wholesale Trade in Kansas, 1997 Typ
- Page 66 and 67:
Total Annual Payroll ($1,000) by In
- Page 68 and 69:
Total Annual Payroll ($1,000) by In
- Page 70 and 71:
Total Annual Payroll ($1,000) by In
- Page 72 and 73:
Total Annual Payroll ($1,000) by In
- Page 74 and 75:
Total Annual Payroll ($1,000) by In
- Page 76 and 77:
Total Annual Payroll ($1,000) by In
- Page 78 and 79:
Number of Establishments by Industr
- Page 80 and 81:
Number of Establishments by Industr
- Page 82 and 83:
Number of Establishments by Industr
- Page 84 and 85:
Number of Establishments by Industr
- Page 86 and 87:
Number of Establishments by Industr
- Page 88 and 89:
Number of Establishments by Industr
- Page 90 and 91:
Taxable Retail Sales, by County 199
- Page 92 and 93:
Taxable Retail Sales, by County 199
- Page 94 and 95:
Taxable Retail Sales, by County 199
- Page 96 and 97:
Taxable Retail Sales, by County 199
- Page 98 and 99:
Taxable Retail Sales, by County 199
- Page 100 and 101:
County Trade Pull Factors* FY 1990-
- Page 102 and 103:
Value Value Value Rank Country 1999
- Page 104 and 105:
Kansas Gross State Product by Indus
- Page 106 and 107:
Patent Grants by County, 1990-1999
- Page 108 and 109:
KansasRegionalTemperatures,2000 Jan
- Page 110 and 111:
Precipitation in Kansas, 2000 and A
- Page 112 and 113:
Kansas County Precipitation 1997-20
- Page 114 and 115:
Communications December 2002 Kansas
- Page 116 and 117:
Daily Newspapers of Kansas, 1993-20
- Page 118 and 119:
Daily Newspapers of Kansas, 1993-20
- Page 120 and 121:
Total Crime Index Offenses in Kansa
- Page 122 and 123:
Crime Index Offenses by County* 199
- Page 124 and 125:
Arrests by County 1995-1998 County
- Page 126 and 127:
Admissions and Releases All Institu
- Page 128 and 129:
Inmate Characteristics in Correctio
- Page 130 and 131:
Number of Full-Time Law Enforcement
- Page 132 and 133:
Allen Anderson Atchison Barber Bart
- Page 134 and 135:
Number of Accredited Public Schools
- Page 136 and 137:
High School Graduates by County, by
- Page 138 and 139:
Percent High School Graduate or Hig
- Page 140 and 141:
County Headcount Grades 7-12 High S
- Page 142 and 143:
Pupil-Teacher Ratio by County, 2001
- Page 144 and 145:
Kansas School Districts: 2001 Schoo
- Page 146 and 147:
Kansas School Districts: 2001 Schoo
- Page 148 and 149:
Kansas School Districts: 2001 Schoo
- Page 150 and 151:
Current Expenditure Per Pupil in Pu
- Page 152 and 153:
Kansas School Districts: Estimates
- Page 154 and 155:
Kansas School Districts: Estimates
- Page 156 and 157:
Kansas School Districts: Estimates
- Page 158 and 159:
Kansas School Districts: Estimates
- Page 160 and 161:
Enrollment in Kansas' Four-Year Col
- Page 162 and 163:
Enrollment in Kansas' Four-Year Col
- Page 164 and 165:
Enrollment in Kansas' Technical Col
- Page 166 and 167:
County Less than 9th Grade 9-12th G
- Page 168 and 169:
Public Library Materials by State,
- Page 170 and 171:
Public Library Service by State, FY
- Page 172 and 173:
Public Library Service by State, FY
- Page 174 and 175:
Public Libraries Providing Access t
- Page 176 and 177:
Elections December 2002 Kansas Stat
- Page 178 and 179:
Allen Anderson Atchison Barber Bart
- Page 180 and 181:
Kansas General Election Statistics
- Page 182 and 183:
County Kansas General Election Stat
- Page 184 and 185:
Kansas General Election Statistics
- Page 186 and 187:
County Kansas General Election Stat
- Page 188 and 189:
Kansas General Election Statistics
- Page 190 and 191:
Kansas General Election Statistics
- Page 192 and 193:
Voter Registration and Party Affili
- Page 194 and 195:
Civilian Labor Force in Kansas 1950
- Page 196 and 197:
Civilian Labor Force Estimates by C
- Page 198 and 199:
Civilian Labor Force Estimates by C
- Page 200 and 201:
MillionsofPersons 1.44 1.42 1.40 1.
- Page 202 and 203:
Unemployment Rates in Kansas by Cou
- Page 204 and 205:
ThousandsofPersons 70 KansasUnemplo
- Page 206 and 207:
Kansas Labor Market Summary 2000 an
- Page 208 and 209:
Employment Data for Metropolitan St
- Page 210 and 211:
Mid-March Employment by Industry, 1
- Page 212 and 213:
Mid-March Employment by Industry, 1
- Page 214 and 215: Mid-March Employment by Industry, 1
- Page 216 and 217: Mid-March Employment by Industry, 2
- Page 218 and 219: County Real Estate Prof. Sci.& Admi
- Page 220 and 221: Mid-March Employment by Industry, 2
- Page 222 and 223: Farm and Nonfarm Employees* by Coun
- Page 224 and 225: State Average Annual Pay for 1999 a
- Page 226 and 227: Average Wage per Job for Counties a
- Page 228 and 229: Average Wage per Job for Counties a
- Page 230 and 231: Energy December 2002 Kansas Statist
- Page 232 and 233: Natural Gas Prices for Kansas 1997
- Page 234 and 235: Prices Energy Prices and Expenditur
- Page 236 and 237: State and Local Government December
- Page 238 and 239: State General Fund Comparative Stat
- Page 240 and 241: Revenue and Expenditure of Local Go
- Page 242 and 243: Revenue and Expenditure of State Go
- Page 244 and 245: Public Employment Data, Kansas Stat
- Page 246 and 247: Summary of Bonds, Temporary Notes,
- Page 248 and 249: Summary of Bonds, Temporary Notes,
- Page 250 and 251: Sales Tax Collectons by Kansas Coun
- Page 252 and 253: Sales Tax Collectons by Kansas Coun
- Page 254 and 255: Per Capita Sales Tax Collections by
- Page 256 and 257: StateSalesTaxperCapita,FiscalYear20
- Page 258 and 259: Summary of Property Taxes Levied by
- Page 260 and 261: Assessed Valuation and Taxes by Cou
- Page 262 and 263: 2001 County Tax Rates for 2002 Asse
- Page 266 and 267: Federal Government Expenditure by O
- Page 268 and 269: Federal Government Expenditure by O
- Page 270 and 271: Total Federal Government Expenditur
- Page 272 and 273: Housing and Construction December 2
- Page 274 and 275: Number of Housing Units by Counties
- Page 276 and 277: Housing Characteristics by County,
- Page 278 and 279: Selected Housing Characteristics by
- Page 280 and 281: Selected Housing Characteristics by
- Page 282 and 283: House Heating Fuel, by County 2000
- Page 284 and 285: Specified Owner - Occupied Housing
- Page 286 and 287: Specified Renter - Occupied Housing
- Page 288 and 289: County Occupied Housing Units and P
- Page 290 and 291: New Privately-Owned Housing Units A
- Page 292 and 293: Permit Authorized Construction in K
- Page 294 and 295: Value of Construction Permits Issue
- Page 296 and 297: Income December 2002 Kansas Statist
- Page 298 and 299: Total Personal Income by State and
- Page 300 and 301: Total Personal Income by State and
- Page 302 and 303: Kansas Personal Income by Source 19
- Page 304 and 305: Kansas Personal Income by Major Sou
- Page 306 and 307: Personal Income by Source by County
- Page 308 and 309: Personal Income by Source by County
- Page 310 and 311: Personal Income by Source by County
- Page 312 and 313: Personal Income by Source by County
- Page 314 and 315:
Personal Income by Source by County
- Page 316 and 317:
Personal Income by Source by County
- Page 318 and 319:
Per Capita Personal Income and Pers
- Page 320 and 321:
Per Capita Income 1989 and 1999 and
- Page 322 and 323:
Per Capita Personal Income by Count
- Page 324 and 325:
Per Capita Personal Income by Count
- Page 326 and 327:
Median Income of Households by Stat
- Page 328 and 329:
Estimated Median Household Income f
- Page 330 and 331:
Median Income, Kansas and Kansas Co
- Page 332 and 333:
Percent of People in Poverty by Sta
- Page 334 and 335:
Poverty Status by State in 2001, Pe
- Page 336 and 337:
Estimates of People of All Ages in
- Page 338 and 339:
Estimates of Related Children Age 5
- Page 340 and 341:
Estimates of People Under Age 18 in
- Page 342 and 343:
Food Stamp Beneficiaries and Expend
- Page 344 and 345:
Food Stamp Beneficiaries and Expend
- Page 346 and 347:
Nonfuel Raw Mineral Production and
- Page 348 and 349:
Oil Production in Kansas 1889-2001,
- Page 350 and 351:
KansasGasProductionbyCounty,2001 (i
- Page 352 and 353:
Kansas Oil Production and Number of
- Page 354 and 355:
Parks and Recreation December 2002
- Page 356 and 357:
Visitation Data and Size of State P
- Page 358 and 359:
Number and Value of Hunting and Fis
- Page 360 and 361:
Allen Anderson Atchison Barber Bart
- Page 362 and 363:
Population of Kansas by Age Group a
- Page 364 and 365:
Both Sexes Population of Kansas by
- Page 366 and 367:
Projections of the Population of Ka
- Page 368 and 369:
Population Summary for Congressiona
- Page 370 and 371:
Race and Hispanic Origin by Congres
- Page 372 and 373:
Population of Kansas Counties, Cens
- Page 374 and 375:
Population of Kansas Counties, 1980
- Page 376 and 377:
Population of Kansas Counties, 1990
- Page 378 and 379:
Population of Kansas Counties, 1990
- Page 380 and 381:
County Population of Kansas Countie
- Page 382 and 383:
Population Estimates for Counties a
- Page 384 and 385:
Population Estimates for Counties a
- Page 386 and 387:
Population Change in Kansas and Net
- Page 388 and 389:
Population Projections of Kansas Co
- Page 390 and 391:
Population Projections of Kansas Co
- Page 392 and 393:
Age by County, in Kansas, 2000 All
- Page 394 and 395:
Age by County, in Kansas, 1990 All
- Page 396 and 397:
Median Age of Persons in Kansas Cou
- Page 398 and 399:
Population Projections of People Ag
- Page 400 and 401:
Population Projections of People Ag
- Page 402 and 403:
Population Projections of People Ag
- Page 404 and 405:
Population Projections of People Ag
- Page 406 and 407:
Population Projections of People Ag
- Page 408 and 409:
Land Area and Population Density in
- Page 410 and 411:
County Male 1990 Population of Kans
- Page 412 and 413:
Urban and Rural Population by Count
- Page 414 and 415:
Urban and Rural Population by Count
- Page 416 and 417:
Percentage of Urban Population in K
- Page 418 and 419:
Land Area by Urban and Rural Reside
- Page 420 and 421:
Hispanic Population of Kansas Count
- Page 422 and 423:
Population of Counties by Race Apri
- Page 424 and 425:
Population of Counties by Race Apri
- Page 426 and 427:
Population of Metropolitan Areas 20
- Page 428 and 429:
Population of Urban Places of 10,00
- Page 430 and 431:
Population of Incorporated Places i
- Page 432 and 433:
Population of Incorporated Places i
- Page 434 and 435:
Population of Incorporated Places i
- Page 436 and 437:
Population of Kansas Cities, 1990 a
- Page 438 and 439:
Population of Kansas Cities, 1990 a
- Page 440 and 441:
Population of Kansas Cities, 1990 a
- Page 442 and 443:
Population of Kansas Cities, 1990 a
- Page 444 and 445:
Population of Kansas Cities, 1990 a
- Page 446 and 447:
Population of Kansas Cities, 1990 a
- Page 448 and 449:
Population of Kansas Cities, 1990 a
- Page 450 and 451:
Population of Kansas Cities, 1990 a
- Page 452 and 453:
Population of Kansas Cities, 1990 a
- Page 454 and 455:
Group Quarters Population by County
- Page 456 and 457:
Persons, Households, and Families i
- Page 458 and 459:
Number of Households by County 1990
- Page 460 and 461:
Kansas Transportation at a Glance,
- Page 462 and 463:
Expenditure of Federal Funds Admini
- Page 464 and 465:
State Motor Fuel Tax Rates* 2000 Ga
- Page 466 and 467:
Number of Vehicle Registrations in
- Page 468 and 469:
Kansas Motor Vehicle Registration b
- Page 470 and 471:
Special City & County Highway Fund
- Page 472 and 473:
Commuting to Work: 2000 Percent of
- Page 474 and 475:
Commuting to Work: 2000 Percent of
- Page 476 and 477:
Registered Live Births, Deaths, Mar
- Page 478 and 479:
Marriages, Divorces and Annulments
- Page 480 and 481:
Live Births and Deaths by County of
- Page 482 and 483:
Reported Abortions by Age Group of
- Page 484 and 485:
Hospitals in Kansas by County, 2000
- Page 486 and 487:
Allen Anderson Atchison Barber Bart
- Page 488 and 489:
Practicing Physicians in Kansas by
- Page 490 and 491:
Allen 1.06 Anderson 1.10 Atchison 2
- Page 492 and 493:
Active Dentists in Kansas by County
- Page 494 and 495:
Allen 0.42 Anderson 0.37 Atchison 0
- Page 496 and 497:
Child Care Facilities by County Oct
- Page 498 and 499:
County Adult Care Homes in Kansas b
- Page 500 and 501:
Cancer Death Rates Per 10,000 Popul
- Page 502 and 503:
Source:PolicyResearchInstitute;Kans
- Page 504 and 505:
Low Income Uninsured Children by St
- Page 506 and 507:
Quick link to: A B C D E F G H I J
- Page 508 and 509:
- D - Dairy products: production an
- Page 510 and 511:
Highway funds, 470 Highways and str
- Page 512 and 513:
population growth, 379 precipitatio
- Page 514 and 515:
climate, 108, 109, 110 land in farm
- Page 516:
deaths, 476, 479 divorces, 476, 477